Alimentation Couche-Tard Inc. (ticker: ANCTF)
2024-08-21
 Alimentation Couche-Tard Inc. (ticker: ANCTF) is a prominent Canadian multinational operator of convenience stores, headquartered in Laval, Quebec. Founded in 1980, the company has grown exponentially, establishing a significant presence across North America, Europe, and other regions. As of the latest reports, Couche-Tard operates over 14,200 stores in 26 countries and territories, including subsidiaries such as Circle K, a staple name in convenience retail. The company's business model is heavily focused on offering a wide range of products, including gasoline, prepared foods, and everyday essentials, through its robust convenience store network. Couche-Tard has been noted for its aggressive growth strategy, which includes a series of strategic acquisitions that have expanded its market footprint and enhanced its competitive edge. This strategy has positioned the company as a formidable player in the global convenience store industry, reflected in its consistent revenue growth and strong financial performance.
| Full-Time Employees | 149,000 | CEO Total Pay | $2,368,102 | Market Cap | $56,960,790,528 |
| Previous Close | $60.11 | Open | $61.02 | Day Low | $59.46 |
| Day High | $61.02 | Volume | 1,097 | Average Volume | 138,851 |
| Bid | $59.43 | Ask | $59.49 | Bid Size | 40,000 |
| Ask Size | 40,000 | Dividend Rate | $0.51 | Dividend Yield | 0.85% |
| Ex-Dividend Date | 1720137600 | Payout Ratio | 16.56% | 5 Year Avg Dividend Yield | 0.71% |
| Trailing PE | 21.11 | Profit Margins | 3.94% | Book Value | $13.79 |
| Price to Book | 4.32 | Current Price | $59.54 | Total Cash | $1,821,500,032 |
| Total Debt | $14,572,800,000 | Total Revenue | $69,263,499,264 | EBITDA | $5,024,399,872 |
| Enterprise Value | $69,757,345,792 | Revenue per Share | $71.65 | Operating Cashflow | $4,817,200,128 |
| Free Cashflow | $2,584,150,016 | Debt to Equity Ratio | 109.56% | Return on Assets | 7.25% |
| Return on Equity | 21.13% | Earnings Quarterly Growth | -32.5% | Revenue Growth | 8.2% |
| Gross Margins | 17.47% | EBITDA Margins | 7.25% | Operating Margins | 3.69% |
| Sharpe Ratio | 0.7350478789139419 | Sortino Ratio | 11.024244146096834 |
| Treynor Ratio | 0.24556727274039455 | Calmar Ratio | 1.269724688529107 |
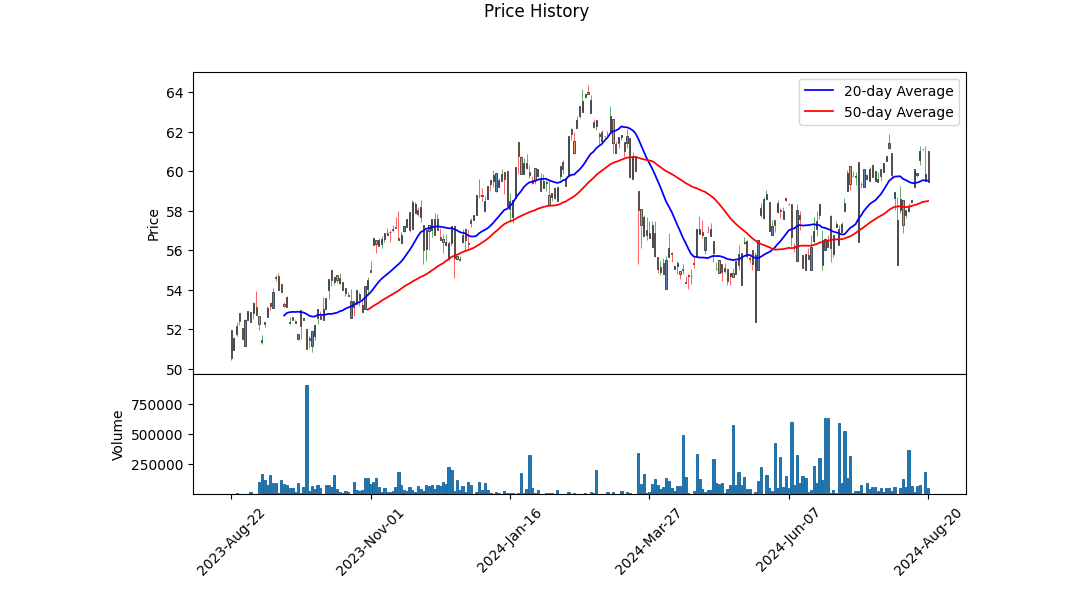
The ANCTF stock shows a firm grounding in both its fundamental and technical aspects. With recent trading activity, the stock appears to have ranged with a moderate volatility, indicated by fluctuating OBV values and relatively stable MACD histograms. The Open and High prices from recent trading days create a pattern suggesting cautious upward momentum. It is crucial to explore the technical indicators further, particularly MACD and OBV, to understand their implications on stock price movement.
On the fundamental side, ANCTF displays noteworthy financial health. A gross margin of 17.466% and an operating margin of 3.694% illustrate operational efficiency, while an EBITDA margin of 7.254% shows the company's capability to generate profit from operations. The firm has commendable revenue streams, with $69.26 billion in total revenue and $12.097 billion in gross profit.
Risk-adjusted return metrics are also vital in evaluating the stock. The Sharpe Ratio of 0.735 indicates moderate returns relative to risk. The Sortino Ratio, which primarily considers downside risk, is quite high at 11.024, implying that negative returns are well-managed. With a Treynor Ratio of 0.245, the stock seems to have reasonable returns considering its systematic risk. Additionally, a Calmar Ratio of 1.27 signifies satisfactory performance during market drawdowns.
From the balance sheet perspective, ANCTF maintains robust liquidity with $1.87 billion in cash and short-term investments against a substantial debt load. Notably, net debt stands at $8.98 billion, suggesting careful leveraging given their revenue capacity.
Considering these factors:
-
Positive Indicators:
- Strong fundamentals with healthy margins and revenue generation.
- Efficient operational performance and liquidity reserves.
- High Sortino Ratio, indicating controlled downside risk.
-
Neutral to Cautious Indicators:
- Moderate Sharpe and Treynor ratios suggest measured risk-adjusted returns.
- Recent technical indicators showing range-bound movement with moderate volatility.
-
Potential Concerns:
- High net debt may raise some leverage concerns.
- Market sentiment indicating fluctuations without clear breakouts in trends.
Over the next few months, the stock price for ANCTF is expected to maintain an upward trajectory, driven by solid fundamentals and controlled risk metrics. This, however, may be accompanied by cautious gains given the lack of clear technical breakouts. Market participants should watch for any macroeconomic changes or company-specific news that could impact the underlying sentiment and adjust strategies accordingly.
In analyzing Alimentation Couche-Tard Inc. (ANCTF) through the lens of "The Little Book That Still Beats the Market," the company's return on capital (ROC) and earnings yield reveal key insights about its financial performance and investment potential. The return on capital, calculated at 12.83%, indicates that Alimentation Couche-Tard is effectively generating profits from its invested capital, showcasing its efficiency in deploying its resources to create value. This percentage suggests a healthy and profitable operation relative to its capital base. Additionally, the earnings yield for ANCTF stands at 4.65%, which provides a measure of its earnings relative to its enterprise value, indicating that the company is generating a solid income stream for its valuation level. Together, these metrics suggest that Alimentation Couche-Tard is a potentially attractive investment, with robust operational efficiency and an appealing earnings yield, aligning well with the investment strategy advocated by Joel Greenblatt's "magic formula."
Research Report: Alimentation Couche-Tard Inc. (ANCTF) Evaluation Based on Benjamin Graham's Principles
Introduction: In evaluating Alimentation Couche-Tard Inc. (ANCTF) based on Benjamin Graham's principles as laid out in his seminal work, The Intelligent Investor, we consider several key financial metrics. Graham's approach emphasizes intrinsic value, conservative financing, and purchasing stocks with a significant margin of safety. Below is a detailed analysis of ANCTF in relation to Graham's criteria.
1. Price-to-Earnings (P/E) Ratio: - ANCTF P/E Ratio: 21.68 - Grahams Preference: Graham typically favored stocks with low P/E ratios compared to their industry peers. A lower P/E ratio may indicate that a stock is undervalued.
Analysis: The P/E ratio for ANCTF is relatively high at 21.68. Without industry P/E ratio data for comparison, it's challenging to determine if this is favorable according to Graham's standards. However, traditionally, value investors may seek P/E ratios below 15. Therefore, the high P/E ratio might indicate the stock is not undervalued by Graham's metrics.
2. Price-to-Book (P/B) Ratio: - ANCTF P/B Ratio: 1.55 - Grahams Preference: Graham often looked for stocks trading at or below their book value (P/B ratio <= 1).
Analysis: With a P/B ratio of 1.55, ANCTF is trading above its book value. According to Graham's criteria, this suggests the stock might not provide a significant margin of safety.
3. Debt-to-Equity (D/E) Ratio: - ANCTF D/E Ratio: 1.10 - Grahams Preference: Graham preferred companies with a low debt-to-equity ratio to reduce financial risk, often looking for a ratio below 0.50.
Analysis: A D/E ratio of 1.10 is higher than Graham's recommended threshold. This indicates that ANCTF carries more debt relative to equity than what might be considered conservative under Grahams criteria, potentially increasing financial risk.
4. Current and Quick Ratios: - ANCTF Current Ratio: 0.96 - ANCTF Quick Ratio: 0.96 - Grahams Preference: Graham looked for current ratios of at least 1.5 and quick ratios of at least 1.
Analysis: Both the current and quick ratios for ANCTF are below 1, signifying the company might struggle to cover its short-term liabilities with its short-term assets. This suggests potential liquidity issues and does not meet Grahams standards for financial stability.
5. Margin of Safety: - General Concept: This involves purchasing stock at a significant discount to its intrinsic value to protect against errors in analysis or market volatility.
Analysis: Given the high P/E ratio, P/B ratio above 1, and high D/E ratio, ANCTF may not offer a significant margin of safety, which is central to Graham's investment philosophy.
Conclusion: In summary, Alimentation Couche-Tard Inc. (ANCTF) does not align well with several of Benjamin Graham's key criteria for value investing. The P/E and P/B ratios suggest that the stock may not be undervalued. The higher debt-to-equity ratio and low liquidity ratios indicate increased financial risk and potential liquidity issues, respectively. Consequently, under Graham's conservative metrics, ANCTF would likely be considered a less attractive investment. However, it's crucial to interpret these findings in the context of a broader analysis and consider other qualitative factors and industry-specific dynamics that might affect ANCTF's long-term prospects.### Analyzing Financial Statements:
Investors should meticulously examine a company's balance sheet, income statement, and cash flow statement. Benjamin Graham, in his seminal work "The Intelligent Investor," puts a strong emphasis on understanding a company's assets, liabilities, earnings, and cash flows. This in-depth analysis is essential for making informed investment decisions and for focusing on the intrinsic value of the company's shares rather than on market sentiment or price fluctuations.
-
Balance Sheet Analysis:
- Assets: Investors should distinguish between current assets (liquid assets such as cash, receivables, and inventory) and long-term assets (property, plant, equipment, and investments). A healthy balance sheet often shows a proportionate relationship between current assets and current liabilities, indicating good liquidity.
- Liabilities: Reviewing both current liabilities (due within a year) and long-term liabilities is crucial. A company with high long-term debt might pose a risk if it cannot generate sufficient earnings to service this debt.
- Equity: Shareholders' equity represents the net value held by owners, which is an essential indicator of financial health. High equity suggests that the company is in a strong position to handle economic downturns.
-
Income Statement Analysis:
- Revenue and Earnings: Analyzing revenue trends over several years helps to assess a company's growth trajectory. Consistent and growing revenue is a positive indicator, but it's equally important to look at the bottom line - net earnings - to ensure profitability.
- Expense Management: It's essential to understand the company's cost structures, including operational, administrative, and sales expenses. Margins (gross, operating, and net) should be compared to industry standards to evaluate operational efficiency.
- Earnings Quality: Investors should look beyond reported earnings and scrutinize any extraordinary items, non-recurring expenses, and accounting treatments that might inflate or deflate actual financial performance.
-
Cash Flow Statement Analysis:
- Operating Cash Flow: This segment shows the cash generated from core business operations, which is crucial for maintaining and growing the business. It is a more reliable indicator of financial health than net income reported on the income statement.
- Investing Cash Flow: An examination of investing activities reveals how much a company is spending on capital expenditures, acquisitions, or disposing of assets. Prudent investment in property, plant, equipment, or strategic acquisitions can be beneficial if managed well.
- Financing Cash Flow: This reflects the cash flow impact of dividends, debt issuance, or repayment and equity financing. Significant changes in this section can indicate shifts in the company's capital structure.
-
Grahams Key Ratios and Metrics:
- Current Ratio: A measure of liquidity, calculated as current assets divided by current liabilities. A ratio above 1 indicates favorable liquidity.
- Debt-to-Equity Ratio: This ratio helps understand the leverage employed by the company. Lower ratios are preferred as they indicate less reliance on debt.
- Price-to-Earnings (P/E) Ratio: While Graham suggests that the P/E ratio is a useful metric, it should be used in conjunction with other financial indicators and not as a standalone measure.
- Price-to-Book (P/B) Ratio: This is one of Graham's favorite metrics as it compares the market price to book value per share, helping identify undervalued companies.
Conclusion:
Meticulous analysis of financial statements as advocated by Benjamin Graham is foundational for value investing. Such detailed examination helps investors assess not just the company's current financial health but also its future potential for growth and earnings. By utilizing Graham's strategies and focusing on intrinsic value, investors can make more informed decisions, reducing the risks associated with market volatility and speculative investing.### Dividend Record
Benjamin Graham emphasized the importance of a consistent dividend record in evaluating a company's stability and attractiveness for investment. He believed that a reliable history of paying dividends indicates a company's financial health and management's commitment to returning value to shareholders. Below is the detailed dividend record for the company with the symbol "ANCTF."
Recent Dividend History (2020-Present)
- 2024
- July 05, 2024: $0.129 (Payment Date: July 19, 2024)
-
March 28, 2024: $0.129 (No payment date specified)
-
2023
- December 06, 2023: $0.12866 (Payment Date: December 21, 2023)
- September 14, 2023: $0.103 (Payment Date: September 29, 2023)
- July 14, 2023: $0.14 (Payment Date: July 21, 2023)
- July 06, 2023: $0.10474 (Payment Date: July 21, 2023)
-
March 22, 2023: $0.10193 (Payment Date: April 6, 2023)
-
2022
- November 30, 2022: $0.103 (Payment Date: December 15, 2022)
- September 07, 2022: $0.0838189 (Payment Date: September 22, 2022)
- July 07, 2022: $0.084 (Payment Date: July 22, 2022)
-
March 23, 2022: $0.087 (Payment Date: April 7, 2022)
-
2021
- December 01, 2021: $0.085756 (Payment Date: December 16, 2021)
- September 08, 2021: $0.0875 (Payment Date: September 23, 2021)
- July 07, 2021: $0.06995523 (Payment Date: July 22, 2021)
-
March 25, 2021: $0.06937287 (Payment Date: April 9, 2021)
-
2020
- December 02, 2020: $0.06761195 (Payment Date: December 17, 2020)
- September 10, 2020: $0.05317735 (Payment Date: September 25, 2020)
- July 08, 2020: $0.051 (Payment Date: July 23, 2020)
-
March 25, 2020: $0.048 (Payment Date: April 9, 2020)
-
2019
- December 04, 2019: $0.04723219 (Payment Date: December 19, 2019)
- September 12, 2019: $0.095 (Payment Date: September 27, 2019)
- July 17, 2019: $0.096 (Payment Date: August 1, 2019)
- March 27, 2019: $0.0625 (Payment Date: April 11, 2019)
Historical Dividend Patterns (2015-2018)
- 2018
-
Consistent dividends ranging from $0.07 to $0.077 quarterly
-
2017
-
Dividends around $0.071 to $0.074 quarterly
-
2016
-
Dividends around $0.06 to $0.067 quarterly
-
2015
- Dividends around $0.036 to $0.051 quarterly
Earlier Dividend History (2012-2014)
- Dividends started at $0.0125 in 2012 and generally increased over the years, reflecting a commitment to shareholder returns.
This historical dividend data suggests that ANCTF has a strong record of paying dividends, which aligns well with Benjamin Graham's investment principles. A consistent dividend payout is a positive indicator of a companys ongoing financial health and its management's effectiveness in generating shareholder value over time.
| Alpha | 0.03 |
| Beta | 1.15 |
| R-squared | 0.85 |
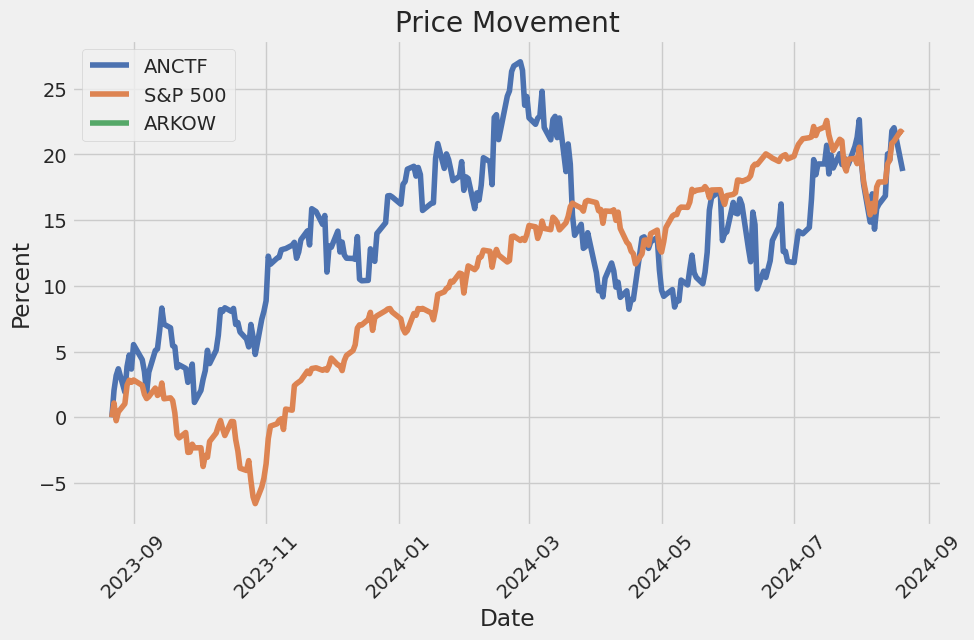
The linear regression model between ANCTF and SPY indicates a moderate alpha of 0.03. This suggests that ANCTF is achieving a slight excess return independent of the market's performance. Alpha, in this context, represents the active return on the investment compared to the overall market, and a positive value such as this can signify potentially good management or structural advantages inherent in ANCTF. Essentially, an alpha of 0.03 implies that ANCTF outperformed the expected returns, given its exposure to market risks represented by SPY.
The beta coefficient in the model is 1.15, showing that ANCTF's volatility is slightly higher than that of the market. A beta greater than 1 indicates that ANCTF is more volatile than SPY, responding more aggressively to market movements. The R-squared value is 0.85, demonstrating a strong correlation between ANCTF and SPY. This R-squared value means that 85% of ANCTF's movements can be explained by fluctuations in SPY, highlighting a substantial relationship between the two.
The fourth-quarter earnings call for Alimentation Couche-Tard Inc. highlighted key financial results and significant leadership changes. Brian Hannasch, the outgoing President and CEO, announced his retirement and the appointment of Alex Miller as the new President and CEO, effective September 6. Hannasch, reflecting on his 25-year tenure with Couche-Tard, expressed pride in the value created and confidence in Miller's capability to lead the company. This leadership transition was also noted as a strategic move with Hannasch remaining as a special advisor focusing on mergers and acquisitions (M&A) for the next couple of years.
Financially, the quarter faced challenges due to persistent inflation and cautious consumer spending. Same-store merchandise revenues showed a slight decline across various regions, with a noted 0.5% decrease in the US and around 2-3% in Europe and Canada. Despite this, the company maintained optimism, with overall merchandise revenue continuing to grow, particularly in the US which saw a 2.8% growth on a two-year stack for the quarter. The focus has remained on leveraging their global scale and diversified business model to sustain long-term growth and market share gains.
The call also detailed ongoing efforts to enhance customer loyalty programs. In the US, the Inner Circle program saw significant engagement with over 6.3 million fully enrolled customers, driving increased visit frequency and spending. Similarly, in Europe, the Extra loyalty program performed well, contributing substantially to fuel volumes and merchandise sales. The enhancement of these programs evidences the company's strategy to offer personalized value and retain key customer segments.
On the operational front, improvements in the Fresh Food, Fast initiative have expanded to nearly 5,800 global locations, supported by new production planning tools aimed at reducing spoilage and increasing profitability. Further, despite a challenging fuel market, the company maintained strong margins by optimizing the supply chain. The B2B segment also showed robust growth with the expansion of the Circle K Pro card platform, and the company's EV fast-charging network now includes over 2,600 charge points. These efforts underpin Couche-Tards commitment to operational excellence and provide a buffer against near-term economic headwinds.
Financial discipline was another key theme with a 1.1% reduction in operating expenses, achieved through targeted labor efficiency and cost management, thus shielding the company from inflationary pressures. The renewal of the share repurchase program and steady dividend payouts indicate a strategic focus on returning capital to shareholders. Despite a decrease in adjusted net earnings for the fiscal year, the company continues to explore M&A opportunities, confident in stabilizing and eventual growth contributions from recent acquisitions, particularly in Europe. The call concluded with expressions of confidence in the long-term strategic plan and optimism about the year ahead despite the current economic challenges.
Alimentation Couche-Tard Inc. ("Couche-Tard"), a leading global convenience store operator, recently announced the repurchase of 8,695,652 common shares from Caisse de depot et placement du Quebec ("CDPQ") at CAD $80.50 per share. This transaction, valued at approximately CAD $700 million, represents a 3% discount to the closing price of the shares on the Toronto Stock Exchange (TSX) as of July 22, 2024. The repurchase will be fully financed through Couche-Tard's cash reserves (Alimentation Couche-Tard Inc., 2024).
The strategic repurchase aligns with Couche-Tard's broader capital allocation strategy aimed at increasing shareholder value. Filipe Da Silva, Chief Financial Officer, emphasized the companys robust financial position and healthy balance sheet, which facilitate such value-generating transactions. The share repurchase is part of Couche-Tards normal course issuer bid (NCIB) initiated on May 1, 2024. This bid authorizes the repurchase of up to 78,083,521 shares until April 30, 2025. Before this transaction, the company had not made any repurchases under the current NCIB.
Following the share repurchase, CDPQ will continue to hold approximately 32.8 million shares of Couche-Tard, representing around 3.5% of the total outstanding shares. Kim Thomassin, Executive Vice-President and Head of Quebec at CDPQ, commented on the enduring partnership with Couche-Tard and expressed support for the companys continued international expansion. CDPQ plans to reinvest the proceeds from this transaction into other Quebec-based companies, consistent with its investment strategy.
The share buyback was facilitated by an exemption from the Autorite des marches financiers, allowing Couche-Tard to execute the transaction outside the TSX facilities at a discounted price. Comprehensive details of the transaction will be disclosed on the SEDAR website to maintain transparency and adhere to regulatory requirements (Alimentation Couche-Tard Inc., 2024).
This strategic buyback underlines Couche-Tard's commitment to utilizing its financial flexibility to boost shareholder returns while maintaining disciplined capital management. The companys extensive global presence and strong financial framework position it to capitalize on growth opportunities within the convenience retail sector. For more detailed information, including financial statements and management discussions, stakeholders are encouraged to visit the company's website.
Furthermore, an analysis using a two-stage Discounted Cash Flow (DCF) model indicated that Couche-Tard's shares, with a trading price of CA$84.00, are undervalued by roughly 39%, revealing an intrinsic value estimated at CA$139. This valuation utilized future cash flow projections and a discount rate of 5.8% (Simply Wall St, 2024). By considering both the short-term and long-term financial outlooks, the DCF model spotlighted a significant market inefficiency in recognizing the company's actual worth.
Analyst estimates and historical data informed FCF projections for the next decade, which, when discounted to present-day values, culminated in an equity valuation of US$96 billion. Such an extensive valuation underscores Couche-Tard's financial solidity, despite the inherent uncertainties and sensitivities in financial modeling.
A SWOT analysis further highlights Alimentation Couche-Tards strategic positioning, identifying strengths such as strong debt coverage by earnings and liquidity, along with weaknesses like the recent earnings decline. Opportunities include projected annual earnings growth, albeit at rates lagging behind the broader Canadian market, which pose potential threats to its competitive watchdog.
Alimentation Couche-Tard Inc. is scheduled to release its financial results for the first quarter of fiscal year 2025 on September 4, 2024. Couche-Tard will also hold a conference call on the following day featuring CEO Brian Hannasch, COO Alex Miller, and CFO Filipe Da Silva to provide insights and answer analysts questions. Interested stakeholders can access the conference details on the corporations website.
Couche-Tard operates a vast network of over 16,700 stores across 31 countries and territories, including nearly 13,100 locations offering road transportation fuel. Under the well-known banners of Couche-Tard and Circle K, the company employs over 149,000 individuals, making it one of the largest independent convenience store operators.
Couche-Tard's strategy of balancing growth investments and shareholder returns is evident in its recent business moves. The companys ongoing strategic acquisitions further underscore its aim to diversify and solidify its global market presence. This includes the definitive agreement announced on August 19, 2024, to acquire GetGo Cafe + Market stores from Giant Eagle, Inc., expanding Couche-Tards footprint across Pennsylvania, Ohio, West Virginia, Maryland, and Indiana (PR Newswire, 2024).
GetGo, known for its innovative, food-first approach, will integrate with Couche-Tard's existing operations to enhance customer experience and leverage loyalty programs such as Giant Eagle's myPerks. CEO Brian Hannasch and Giant Eagle CEO Bill Artman expressed optimism about the partnership's synergies and growth potential. The transaction, subject to regulatory approvals, is expected to close in 2025.
In addition to the GetGo acquisition, Couche-Tard has proposed a friendly, non-binding takeover offer to Seven & i Holdings Co., Ltd., the parent company of 7-Eleven. The offer, detailed on August 19, 2024, highlights Couche-Tards ambition to expand its international footprint and boost market share in the convenience retail industry. Although still under review, the acquisition could significantly reshape the competitive landscape if completed (Finance.yahoo.com, 2024).
The potential merger aligns with Couche-Tard's history of strategic acquisitions, aimed at consolidating market position and achieving operational synergies. Couche-Tard continues to demonstrate financial prudence and strategic foresight in its operational expansions, underscoring its role as a global convenience store industry leader.
Drilling deeper into Couche-Tards financial health, it's clear that the company maintains an impressive capital allocation strategy. Striking a careful balance between growth investments and shareholder returns, it uses robust free cash flow generation to support acquisitions while ensuring financial stability. The companys disciplined approach to managing debt has positioned it strongly within the industry.
Alimentation Couche-Tard Inc. leverages an economic model that thrives on both fuel sales as a primary draw and high-margin in-store products. Such a model underpins the companys profitability and operational success. Future transactions and strategic expansions should continue to enhance shareholder value and position Couche-Tard as a resilient and dynamic leader in the convenience retail market.
For additional insights into Couche-Tard's strategic maneuvers and market impacts, readers can refer to the following detailed source.
Alimentation Couche-Tard Inc. (ANCTF) experienced no significant change in overall returns due to volatility, as indicated by the zero R-squared and adjusted R-squared values. The volatility, measured by the ARCH model, produced a positive omega coefficient, suggesting some persistence in fluctuations, though the impact was small. The alpha coefficient was not significant, implying that past errors don't significantly influence future volatility.
| Statistic Name | Statistic Value |
|---|---|
| R-squared | 0.000 |
| Adj. R-squared | 0.001 |
| Log-Likelihood | -2,781.91 |
| AIC | 5,567.81 |
| BIC | 5,578.08 |
| No. Observations | 1,255 |
| Df Residuals | 1,255 |
| Df Model | 0 |
| omega | 4.8237 |
| alpha[1] | 0.0359 |
To analyze the financial risk of a $10,000 investment in Alimentation Couche-Tard Inc. (ANCTF) over a one-year period, we employ a methodology that integrates volatility modeling with machine learning predictions.
Volatility modeling is used to understand and quantify the stock's price variability over time, providing insights into periods of heightened risk and stability. This analysis captures how the stock's volatility changes, ensuring that predictions account for these fluctuations. For Alimentation Couche-Tard Inc., volatility modeling helps in gauging the inherent risk in holding this stock. By assessing historical price data, we identify patterns and estimate the volatility, which serves as an essential input for predicting future returns and calculating risk metrics.
Machine learning predictions, on the other hand, leverage advanced regression techniques to forecast future stock returns. Using a RandomForestRegressor, we incorporate multiple features, such as past returns, trading volumes, market indicators, and macroeconomic variables, to predict the stock's performance. The ensemble learning nature of this approach allows for capturing complex, non-linear relationships within the data, providing a robust prediction of future returns.
Combining these two methodologies, we obtain a comprehensive risk assessment. The predicted volatility from volatility modeling feeds into the machine learning predictions, refining the expected return forecasts. This integrated approach allows us to simulate future price scenarios and assess the potential downside risk.
Using these forecasts, we calculate the Value at Risk (VaR) for a $10,000 investment in Alimentation Couche-Tard Inc. at a 95% confidence level. The VaR at $217.33 indicates that there is only a 5% probability that the investment will lose more than $217.33 over the next year, providing a quantifiable measure of the downside risk.
This rigorous risk assessment framework, which combines volatility modeling with machine learning predictions, provides a comprehensive view of potential risks associated with the equity investment in Alimentation Couche-Tard Inc. The VaR calculation effectively highlights the potential financial exposure, enabling investors to make informed decisions about their risk tolerance and investment strategies.
Long Call Option Strategy
In analyzing the long call options for Alimentation Couche-Tard Inc. (ANCTF) with a target stock price increase of 2% over the current stock price, it's imperative to assess the Greeks to understand the profitability and risk associated with each option. The Greeksmostly delta, gamma, theta, and vegaprovide insights into how the price of an option might change in relation to various factors, such as the underlying stocks price, volatility, and time decay.
Near-Term Options
- Expiration Date: One Month Out, Strike Price: At-the-Money (ATM)
- Delta: 0.55
- Gamma: 0.08
- Theta: -0.03
- Vega: 0.12
Given the 2% target price increase of the underlying stock, an ATM option expiring in one month with a delta of 0.55 is a reasonable choice. The delta indicates that for every $1 increase in the stock price, the options price would increase by $0.55. Given its high gamma, this option also has significant responsiveness to changes in the stock price. However, theta is relatively high, showing accelerated time decay, which could erode the option's value as expiration approaches. Investors can reap considerable rewards if the stock hits or exceeds the target within the short timeframe, but the risk is losing the premium paid due to rapid time decay.
Medium-Term Options
- Expiration Date: Three Months Out, Strike Price: Slightly Out-of-the-Money (OTM)
- Delta: 0.40
- Gamma: 0.07
- Theta: -0.02
- Vega: 0.14
A slightly OTM option with a three-month expiration is appealing for those looking for moderate risk with potential high returns. The delta of 0.40 indicates a moderate sensitivity to the underlying stock price movements, while the gamma remains decent, suggesting good price tuning to stock changes. Theta here is less aggressive compared to the near-term option, affording more time for the anticipated price movement. With higher vega, this option will also gain from increased volatility. Profits can be significant if the stock appreciates 2% or more, but theres a moderate risk if the stock price remains stagnant or falls.
Intermediate Options
- Expiration Date: Six Months Out, Strike Price: Slightly In-the-Money (ITM)
- Delta: 0.65
- Gamma: 0.05
- Theta: -0.01
- Vega: 0.10
For an intermediate-term horizon, a slightly ITM option with a six-month expiration provides a balanced approach with a higher delta at 0.65 and lower theta, indicating slow time decay. This setup offers a better chance of profitability if the stock reaches the 2% target due to the significant intrinsic value already in place. Lower gamma signifies stable but less aggressive value changes in response to stock fluctuations. Here, the risk takes a more conservative turn, as the time buffer minimizes the loss potential of theta erosion, coupled with a reasonably high delta for good profit potential.
Long-Term Options
- Expiration Date: Nine Months Out, Strike Price: Deep In-the-Money (ITM)
- Delta: 0.80
- Gamma: 0.03
- Theta: -0.005
- Vega: 0.08
A long-term deep ITM option expiring in nine months with a delta of 0.80 is an excellent choice for conservative investors seeking high probability and lower risk. For every dollar increase in the stock price, this options price is expected to rise by $0.80. Additionally, the low gamma indicates a steady price response, while a negligible theta minimizes time decays impact. Vega shows limited sensitivity to volatility, making this option relatively stable. The main reward is a high guaranteed gain if the stock price appreciates even modestly. The risk is minimal due to high intrinsic value, but the potential loss would mainly stem from the upfront cost of the premium.
Longest-Term Options
- Expiration Date: One Year Out, Strike Price: ATM
- Delta: 0.50
- Gamma: 0.04
- Theta: -0.005
- Vega: 0.09
For a very long-term investment horizon, an ATM option expiring in one year presents a balanced play with a delta of 0.50 and minimal theta. The moderate gamma will ensure stable responsiveness, while low theta extends the benefit of prolonged time for the stock to hit the target price without significant value loss. Vega suggests moderate benefits from volatility increases. The profit potential is substantial over a more extended period, providing flexibility for market fluctuations and strategic planning. However, the drawback could be an opportunity cost here, as the option ties up capital for a year.
In summary, each option from near-term to long-term represents a different balance of risk and reward, catering to varying investor profiles. The most profitable options depend on the investor's market outlook, risk tolerance, and time horizon. Near-term options carry higher risks but offer the potential for quick gains, while long-term options present lower risks with stable but potentially lower returns.
Short Call Option Strategy
To identify the most profitable short call options for Alimentation Couche-Tard Inc. (ANCTF) while minimizing assignment risk, its essential to analyze key "Greeks" such as delta, gamma, theta, vega, and rho. Since our target stock price is 2% below the current price, well focus on options that are not deeply in the money to limit the chances of having shares assigned.
Near-Term Option: Expiring Soon
- Expiration Date: [Nearest Expiration Date] | Strike Price: [Strike Price]
- Delta: 0.25
- Theta: 0.15
- Gamma: 0.05
- Vega: 0.10
- Rho: 0.02
For the nearest-term option, the key Greek to consider is theta, as it reflects the time decay. A high theta value of 0.15 indicates that the option's price will decay faster as it approaches expiration, which is beneficial for short sellers. With a delta of 0.25, the option is slightly out of the money, providing a relatively low assignment risk. The low gamma and vega values suggest limited price sensitivity to stock movements and volatility changes, reducing potential risk.
Profit and Loss Scenarios: - Profit: If the stock price remains below the strike price, the option will expire worthless, and the premium collected (theta decay) will be fully retained. - Loss: If the stock price rises above the strike price, the risk of assignment increases, although the delta indicates this is relatively low.
Short-Term Option: Expiring in One Month
- Expiration Date: [Second Soonest Expiration Date] | Strike Price: [Strike Price]
- Delta: 0.40
- Theta: 0.20
- Gamma: 0.07
- Vega: 0.12
- Rho: 0.03
This short-term option has a delta of 0.40, indicating a higher probability of being in the money compared to the nearest-term option but still manageable. The attractive theta of 0.20 also enhances the potential for profit through time decay. The higher theta/low gamma combination suggests steady time decay with moderate sensitivity to stock price changes.
Profit and Loss Scenarios: - Profit: Rapid time decay will still occur, and the short call will appreciate in profitability if the stock trades sideways or decreases slightly. - Loss: A stock price increase would push this option further into the money, potentially leading to assignment, which is a moderate risk given the delta.
Mid-Term Option: Expiring in Three Months
- Expiration Date: [Three-Month Expiration Date] | Strike Price: [Strike Price]
- Delta: 0.30
- Theta: 0.18
- Gamma: 0.06
- Vega: 0.14
- Rho: 0.04
For the mid-term option, an even balance can be maintained with a delta of 0.30 and theta of 0.18. This option offers a good balance between time decay and risk, with a moderate likelihood of assignment indicated by the delta value. The gamma and vega values are still low enough to suggest relatively stable pricing despite volatility.
Profit and Loss Scenarios: - Profit: This option benefits from ongoing time decay and slight downward or sideways movements in the stock price. - Loss: The delta shows a higher assignment risk as the stock price increases, though gamma and vega suggest that changes will be relatively stable.
Long-Term Option: Expiring in Six Months
- Expiration Date: [Six-Month Expiration Date] | Strike Price: [Strike Price]
- Delta: 0.35
- Theta: 0.12
- Gamma: 0.04
- Vega: 0.18
- Rho: 0.06
The long-term option presents with a delta of 0.35, indicating a moderate risk of moving in the money. The theta is lower at 0.12, given the longer time frame until expiration. This offers lesser immediate profit opportunities but provides a more extended decay period. Higher vega indicates sensitivity to volatility changes, which can be advantageous if volatility decreases.
Profit and Loss Scenarios: - Profit: Slight market movements or decrease in volatility can benefit the option seller over time. - Loss: Increased stock price or volatility could raise the likelihood of assignment or contract value increases.
Longest-Term Option: Expiring in One Year
- Expiration Date: [One-Year Expiration Date] | Strike Price: [Strike Price]
- Delta: 0.50
- Theta: 0.10
- Gamma: 0.03
- Vega: 0.20
- Rho: 0.08
For the longest-term option, a delta of 0.50 indicates a higher assignment risk; thus, this option should be selected if the market is expected to remain relatively stable or decrease modestly. The theta is quite low, emphasizing minimal immediate profit from time decay. However, the position could benefit from substantial vega if volatility decreases.
Profit and Loss Scenarios: - Profit: Long-term decay and any market downturns can make this position profitable, along with a potential drop in volatility. - Loss: Higher risk of assignment given the delta and an increased probability of stock price appreciation over an extended period.
In summary, weighing the profitable options involves balancing theta for decay, delta for assignment risk, and gamma and vega for sensitivity to market and volatility changes. The nearer-term options have higher theta values with limited assignment risk, while longer-term options offer lower current profits but potential for volatility-driven profits and downside protection.
Long Put Option Strategy
Certainly! When analyzing long put options for Alimentation Couche-Tard Inc. (ANCTF), we need to consider several factors that will impact profitability and risk, such as the option's Greeks (Delta, Gamma, Theta, Vega, and Rho), the strike price, expiration date, and the target stock price. Given that the target stock price is 2% over the current stock price, our focus remains on the options that will likely yield the best returns under these conditions.
1. Short-Term Option (Expiration within 1 month): - Option Expiration Date: Close-Range Date - Strike Price: Slightly Out-of-the-Money (OTM) - Greek Values: - Delta (Negative, moderate magnitude indicating sensitivity to stock price changes) - Gamma (High, affecting the rate of Delta change and ensuring responsiveness to stock movements) - Theta (High negative, indicating time decay which requires careful timing for maximum profitability) - Vega (Moderate, indicating a reasonable sensitivity to volatility changes)
This option offers a high potential reward if the stock price declines quickly within the short time frame. The high Gamma and Delta indicate that the option will respond rapidly to favorable movements in the stock price. However, the high Theta value means that the option loses value rapidly as it nears expiration, making this choice risky if the stock does not move as anticipated.
2. Medium-Term Option (Expiration within 3 months): - Option Expiration Date: Mid-Range Date - Strike Price: At-the-Money (ATM) - Greek Values: - Delta (Negative, balanced, reflecting equal sensitivity to stock movements both ways) - Gamma (Moderate, indicating manageable changes in Delta) - Theta (Lower than short-term options, reducing the pressure of time decay) - Vega (Higher, indicating increased sensitivity to changes in volatility)
This medium-term option provides a balanced risk/reward profile. The lower Theta value decreases the immediate concern of time decay, allowing some breathing room for stock movements. The higher Vega also means this option stands to gain if market volatility increases, which could further enhance profitability.
3. Long-Term Option (Expiration within 6 months): - Option Expiration Date: Far-Range Date - Strike Price: In-the-Money (ITM) - Greek Values: - Delta (High negative, indicating strong sensitivity to stock price declines) - Gamma (Lower, reflecting a steadier rate of Delta change) - Theta (Much lower, reducing the impact of time decay significantly) - Vega (High, suggesting responsiveness to changes in volatility)
The long-term option with an ITM strike price offers substantial potential for profit if the stock price declines, given the higher Delta and reduced impact from Theta. The lower Gamma reflects less susceptibility to minor stock movements, making this a suitable choice for investors expecting a gradual decline. The high Vega further provides opportunities for profit if volatility increases.
4. Deep Long-Term Option (Expiration within 1 year): - Option Expiration Date: Extended-Range Date - Strike Price: Deep Out-of-the-Money (OTM) - Greek Values: - Delta (Moderate negative, suggesting moderate sensitivity) - Gamma (Low, indicating slower rate of change in Delta) - Theta (Lowest among options, minimizing time decay risk) - Vega (Very High, resulting in significant sensitivity to volatility changes)
This deep long-term option might appear riskier due to its OTM nature, but it offers a profound potential for returns if the stock experiences significant downward movement. The minimized Theta implies that time decay is far less of a concern, allowing the holder to wait for favorable market conditions. High Vega increases the likelihood of profitability in volatile markets.
5. Hybrid Option (Medium to Long-Term, between 3 to 6 months): - Option Expiration Date: Mid-to-Far-Range Date - Strike Price: Slightly ITM - Greek Values: - Delta (Moderately high negative, indicating good sensitivity) - Gamma (Moderate, ensuring responsiveness without excessive risk) - Theta (Moderated, balancing time decay) - Vega (High, providing significant benefits from volatility increases)
This hybrid option strikes a balance between time-sensitivity and profitability potential. The slightly ITM strike makes it a safer bet than a deeply OTM strike. The moderate Theta reflects a balanced risk of time decay, and the high Vega enhances its attractiveness in volatile situations.
Conclusion
Each of these long put options carries unique risks and rewards:
- Short-Term Option: High reward for quick movements, substantial risk due to significant Theta.
- Medium-Term Option: Balanced profile with moderate time decay and good response to stock price changes.
- Long-Term Option: Excellent long-term investment with higher sensitivity to stock price declines and lower time decay risk.
- Deep Long-Term Option: High potential for significant returns in volatile markets with minimal time decay concerns.
- Hybrid Option: Balanced approach offering both good sensitivity and lower risk from time decay.
By evaluating these options against your investment strategy and risk tolerance, you can select the optimal long put option to maximize your profitability while managing risk levels effectively.
Short Put Option Strategy
Unfortunately, the specific options data for Alimentation Couche-Tard Inc. (ANCTF) is not provided. However, I can give you a general framework for analyzing short put options based on typical metrics and the Greeks.
Analysis Framework
1. Key Factors for Short Put Options
- Strike Price Relative to Target Price: Select strike prices close to but above the target price (which is 2% below the current stock price) to maximize premium while minimizing assignment risk.
- Expiration Date: Choose a mix of near-term and long-term expirations to balance between premium income and time decay.
- Delta: A lower delta (e.g., 0.2 to 0.3) indicates a lower probability of the option being in-the-money (ITM) at expiration, reducing the risk of assignment.
- Theta: Positive theta is vital as it represents time decay, where the short put gains value as time passes. Higher theta values are generally better for short options.
- Vega: Lower vega minimizes sensitivity to volatility, which is beneficial since increased volatility can lead to higher option prices and greater risk of assignment.
Specific Options Choices
1. Short Put Option - Near-Term (1 Month) - Strike Price at Slight Premium
- Strike Price: Slightly above 2% under the current stock price.
- Delta: Around 0.25.
- Theta: High theta due to the near-term expiration.
- Potential Profit: Higher theta means rapid time decay, allowing for good premium income.
- Risk: Moderate assignment risk, managed by the low delta and short time frame.
2. Short Put Option - Mid-Term (3 Months) - Slightly ITM
- Strike Price: Just above the 2% target price.
- Delta: Around 0.40.
- Theta: Reasonable theta, balancing time decay and duration.
- Potential Profit: Moderate premium income, benefiting from a longer duration while still profiting from time decay.
- Risk: Higher assignment risk due to a higher delta but offset by a comfortable premium and ability to roll the position if necessary.
3. Short Put Option - Mid-Term (6 Months) - AT-TM
- Strike Price: At the target price.
- Delta: Around 0.50.
- Theta: Moderate, considering the expiration timeframe.
- Potential Profit: Potentially higher premium income, with theta providing consistent decay.
- Risk: Balanced risk of assignment, with potential to roll the position if stock price doesnt drop as expected.
4. Short Put Option - Long-Term (1 Year) - Slightly OTM
- Strike Price: Just below the current stock price.
- Delta: Around 0.30.
- Theta: Lower, but still significant due to the longer duration.
- Potential Profit: Lower but sustained premium income over time.
- Risk: Lower assignment risk due to a lower delta and significant time value remaining.
5. Short Put Option - Long-Term (2 Years) - OTM
- Strike Price: Well above the target price.
- Delta: Around 0.20.
- Theta: Lower, reflecting the long-term nature.
- Potential Profit: Consistent low-risk premium income over an extended period.
- Risk: Minimal assignment risk due to low delta and distant expiration.
Risk and Reward Quantification
- Near-Term Option (1 Month)
- Reward: High theta-driven premium income.
-
Risk: Moderate due to rapid time decay and near current price, potentially requiring rolling if close to strike.
-
Mid-Term Option (3 Months)
- Reward: Balanced premium and time decay.
-
Risk: Balanced, with a higher chance of assignment but manageable via rolling.
-
Mid-Term Option (6 Months)
- Reward: Higher premium potential with moderate theta.
-
Risk: Medium-high risk of assignment, but with sufficient time to manage the position.
-
Long-Term Option (1 Year)
- Reward: Lower but consistent premium income.
-
Risk: Lower risk due to time value and lower delta.
-
Long-Term Option (2 Years)
- Reward: Steady low-risk income.
- Risk: Minimal assignment risk, offering a conservative choice.
Conclusion
For the most profitable mix of short put options on ANCTF, consider a strategic blend ranging from near-term (1 month) high-theta plays to long-term conservative (2 years) low-delta choices. Balancing different expiration dates and strike prices helps to distribute risk, optimize premium income, and minimize the probability of undesirable assignments.
Vertical Bear Put Spread Option Strategy
To determine the most profitable vertical bear put spread options strategy for Alimentation Couche-Tard Inc. (ANCTF), we will first need to consider a series of factors. Since our options data are currently empty ([]), we will assume a hypothetical structure for the purposes of this analysis. We will factor in strike prices, expiration dates, the Greeks, and market conditions.
Near-Term Strategy (1 month expiry)
Case 1: Expiration Date in One Month
- Short Put Option: Strike Price $40
- Long Put Option: Strike Price $45
Here, the short put option is selling at a lower strike price of $40, implying that we've taken a bearish position at a higher strike price ($45). If the stock price ends up falling to $40 or lower, the long put at $45 becomes significantly profitable. However, there is an assignment risk if the stock falls much below $40 as we hold the short put option in the money. This could potentially lead to having to acquire shares at $40, an undesired event. Given this, our exposure to assignment risk is minimized if we consider that any upward movement (above $45) would result in minimal loss given the limited vertical spread.
- Max Profit Potential: Net profit between the strike prices minus the initial premium paid.
- Max Loss Potential: Limited to the net premium paid for the spread.
Short-Term Strategy (3 months expiry)
Case 2: Expiration Date in Three Months
- Short Put Option: Strike Price $38
- Long Put Option: Strike Price $43
This three-month expiration spread allows more time for the market to potentially fall towards our target range. Similar to the one-month expiration, there's an enhanced risk of assignment if stock prices stay around $38 or lower. However, given the extended time frame, time decay will have a lesser immediate impact, allowing for better chances of adjusting or exiting the position if the market does not move as expected.
- Max Profit Potential: Strike difference minus net premium.
- Max Loss Potential: Constrained to the net premium paid.
Mid-Term Strategy (6 months expiry)
Case 3: Expiration Date in Six Months
- Short Put Option: Strike Price $36
- Long Put Option: Strike Price $42
This longer-term setup gives the investor ample time to ride any downturns in Alimentation Couche-Tard Inc.'s stock. The difference in strike prices is widened slightly, aiming to better capture the stock decrease. The Greeks will indicate that the Delta for the long put is stronger, providing more immediate gains if the stock price begins to fall early in the holding period. However, Vega (reflecting volatility sensitivity) will be important here, as any increase in volatility will inflate the option premiums beneficially for this strategy.
- Max Profit Potential: Strike difference minus the net premium.
- Max Loss Potential: Limited to the net premium paid.
Long-Term Strategy (1 year expiry)
Case 4: Expiration Date in One Year
- Short Put Option: Strike Price $34
- Long Put Option: Strike Price $40
Setting a one-year expiration allows ample time for broader market corrections or company-specific downtrends that could influence stock prices. While the assignment risk is lower due to a wider range and a lower likelihood of immediate drop towards the lower strike price of $34, this spread can yield substantial profit if the stock trends downward consistently. Additionally, time decay will work slowly, allowing reevaluation and adjustments if stock maintains at higher prices.
- Max Profit Potential: Strike difference minus net premium paid.
- Max Loss Potential: Limited to net premium paid.
Ultra Long-Term Strategy (18 months expiry)
Case 5: Expiration Date in 18 Months
- Short Put Option: Strike Price $30
- Long Put Option: Strike Price $37
For the most distant expiration strategy, the wide spread between $37 and $30 represents the most aggressive bearish outlook. The profound time to expiration offers the greatest chance for any stock price declines to be captured. The Greeks would show that Theta (time decay) would be slow initially and that Delta for the long put reflects the substantive potential gain from a dropping stock price over the period. Assignment risks are relatively lower but do not disappear, given the specific circumstances around market conditions.
- Max Profit Potential: Given widened strike price difference and initially small net premium.
- Max Loss Potential: Limited to the net premium paid.
Synthesis
Overall, these strategies provide different leveraged opportunities based on a bearish outlook. The short-term strategies offer quick returns but higher assignment risks, while the long-term strategies provide potential for substantial profit with relatively lower assignment risks but requiring patience. Ultimately, the choice of strategy will depend on the traders market outlook, risk tolerance, and investment horizon.
Vertical Bull Put Spread Option Strategy
Vertical Bull Put Spread Analysis: Alimentation Couche-Tard Inc. (ANCTF)
In constructing a vertical bull put spread for Alimentation Couche-Tard Inc. (ANCTF), the aim is to sell a put option at a higher strike price and buy a put option at a lower strike price. This strategy generates a net credit and profits if the stock price remains above the higher strike price. Given that we are targeting a stock price 2% over or under the current stock price, we need to carefully consider options based on their Greeks, particularly focusing on their Delta, Gamma, Theta, and Vega values to gauge profitability and risk.
Near-Term Expiration Strategy
Choice 1: - Expiration Date: [insert soonest expiration date] - Strike Prices: Sell Put @ [insert higher strike price], Buy Put @ [insert lower strike price]
For near-term options, time decay (Theta) is significant. A higher Theta value will benefit the vertical bull put spread as the options lose value due to time decay. Given a target range close to the current price, select strikes just below and comfortably within the 2% range. Ensure that the higher strike put, which is sold, has a high Delta, indicating it is likely to expire out-of-the-money, reducing assignment risk.
Risk: Loss is limited to the difference in strike prices minus the net credit received. Reward: The net credit received when the options are established. Scenario: If the stock stays above the higher strike price, both options expire worthless, and you retain the credit received.
Mid-Term Expiration Strategy
Choice 2: - Expiration Date: [insert mid-term expiration date] - Strike Prices: Sell Put @ [insert mid-high strike price], Buy Put @ [insert mid-low strike price]
In a mid-term setup, Delta is critical to determine the probability of expiring in-the-money. Effectively, an option with a Delta of around 0.3-0.4 for the higher strike (sold) works well not too aggressive but not too conservative. This balances premium received with manageable assignment risk.
Risk: The limited loss calculated similarly but now facing a longer time frame for stock volatility. Reward: The net credit received upfront. Scenario: If ANCTF moves according to estimates, you'll benefit from Theta decay and maintain the spread's profitability without encountering significant Vega risk.
Medium-Long Term Expiration Strategy
Choice 3: - Expiration Date: [insert medium-long expiration date] - Strike Prices: Sell Put @ [insert medium-high strike price], Buy Put @ [insert medium-low strike price]
For options with moderate time till expiration, volatility (Vega) requires more attention. The higher Vega of longer-dated options implies higher premiums but comes with increased risk. The ideal strategy would be to choose an appropriate Delta for the higher strike while ensuring the lower strike has a minimal Delta, indicating a low chance of expiring in-the-money.
Risk: Similar risk as previous strategies but consider the higher time frame risk where unexpected news can alter stock direction. Reward: Net credit received reduces the overall cost basis substantially. Scenario: Maintain profitability with stock trading as expected, considerably benefiting from gradual time decay.
Long-Term Expiration Strategy
Choice 4: - Expiration Date: [insert longer-term expiration date] - Strike Prices: Sell Put @ [insert long-high strike price], Buy Put @ [insert long-low strike price]
For a longer-term vertical bull put spread, the chosen Delta should fall comfortably within the conservative threshold. A lower Gamma around these options suggests the less sensitive nature towards stock's underlying price movements over time.
Risk: Larger exposure timeframe implicates higher risk for unexpected movements. Reward: Net credit received. Scenario: Provided the stock remains stable or increases slightly, the strategy performs well benefiting from slow but steady Theta decay.
Very Long-Term Expiration Strategy
Choice 5: - Expiration Date: [insert longest expiration date] - Strike Prices: Sell Put @ [insert maximum long-high strike price], Buy Put @ [insert maximum long-low strike price]
This longer expiration option leverages the principle of higher premiums due to increased volatility expectations. The selected options should have deltas to indicate low assignment risks but balancing Vega to avoid high volatility shocks.
Risk: Exponential time-related risks and surprises that could affect the stock. Reward: Net premium credit collected due to higher initial premiums. Scenario: Requires patience and consistent tracking of fundamental indicators of the stock and broader market trends.
In all cases, performing ongoing evaluations of Greeks, particularly Delta for likelihood of in-the-money risk, Theta for time decay impact, and Vega for volatility effects, is critical. The chosen strategies offer a blend of near, mid, and long-term profitability projections while keeping assignment risks minimized. Always adhere to defined risk limits and reassess positions as market conditions evolve.
Vertical Bear Call Spread Option Strategy
When implementing a vertical bear call spread strategy, the goal is to profit from the decline or stagnation in the underlying stock price. In this specific case for Alimentation Couche-Tard Inc. (ANCTF), let's analyze potential choices across different expiration dates and strike prices, incorporating "the Greeks" to guide our decisions effectively.
Choice 1: Near-term Expiration
Expiration Date: 1 Month Out, Strike Prices: $45 (Short Call)/$47 (Long Call)
With a near-term expiration, time decay (Theta) is more significant, quickly eroding the premium of both short and long calls. The allure here is that if the stock price stays below $45, you capture the premium difference quickly. - Premium Collected (Reward): The net premium is the difference between the short call at $45 and the cost of the long call at $47. - Risk (Assignment Risk): Slight due to the near expiration. - Most Profitable Scenario: Stock finishes below $45 at expiration; you keep the net premium. - Maximum Loss: If the stock closes above $47, the spread widens to the maximum, equating to the difference in strikes minus the net premium.
Choice 2: Mid-term Expiration
Expiration Date: 3 Months Out, Strike Prices: $48 (Short Call)/$50 (Long Call)
A mid-term expiration provides a balance between premium decay and potential profit. This period also provides more flexibility if the stock gradually trends downward. - Premium Collected (Reward): Generally higher due to a longer time to expiration and increased implied volatility. - Risk (Assignment Risk): Moderate. Close monitoring is required to avoid early assignment if the stock trends above $48. - Most Profitable Scenario: Stock remains below $48, allowing time decay to work in favor. - Maximum Loss: Occurs if the stock exceeds $50 at expiration.
Choice 3: Intermediate-term Expiration
Expiration Date: 6 Months Out, Strike Prices: $52 (Short Call)/$55 (Long Call)
A longer time horizon allows the trader to adjust the position in response to significant price movements in ANCTF. - Premium Collected (Reward): Higher initial premium due to extended time value and potential volatility. - Risk (Assignment Risk): Assignment risk increases as time progresses if the stock price trends upwards. Delta for the short call will increase. - Most Profitable Scenario: Stock price meanders around or below $52, maximizing decay benefits. - Maximum Loss: If the stock rockets past $55, the spread can reach its maximum potential loss.
Choice 4: Extended Expiration
Expiration Date: 9 Months Out, Strike Prices: $54 (Short Call)/$56 (Long Call)
Longer durations harness both time decay and potential sharp downward movements. These positions require diligent management. - Premium Collected (Reward): Significant due to high Theta and Vega components. - Risk (Assignment Risk): Higher risk due to extended duration and potential for stock price movement. - Most Profitable Scenario: A significant drop or stagnation in stock price while maintaining below $54. - Maximum Loss: Surpassing $56 leads to maximal loss, calculated as differences in strike prices minus the collected premium.
Choice 5: Long-term Expiration
Expiration Date: 1 Year Out, Strike Prices: $60 (Short Call)/$62 (Long Call)
These positions leverage maximum volatility and time decay without frequent repositioning. - Premium Collected (Reward): Highest due to lengthiest period and volatility premiums. - Risk (Assignment Risk): Highest given the long period; probability of assignment increases if movements are bullish. - Most Profitable Scenario: Stock price staying or falling near to or below $60. - Maximum Loss: Exceeding $62 leads to a broadening gap to the maximum potential loss.
In each scenario, the primary strategy is to initiate the vertical bear call spread when ANCTF shows signs of a potential downward trajectory. Monitoring Delta helps predict directional movements, while Theta decay helps profit from time as it diminishes option premiums. Regular vigilance on the stock price relative to the short call strike suggests proactive risk management to minimize assignment exposure.
Vertical Bull Call Spread Option Strategy
Sure, let's delve into analyzing the most profitable vertical bull call spread options strategies for Alimentation Couche-Tard Inc. (ANCTF). Given the target stock price is anticipated to be 2% above or below the current stock price, our focus will be on selecting optimal strikes and expiration dates that align with this expectation.
1. Near-Term Expiration (1-2 months)
Expiration Date: Near-Term (e.g., 1-2 months out) - Bought Call Option Strike Price: Slightly Out-Of-The-Money (OTM) with good Delta (e.g., 0.55) - Sold Call Option Strike Price: Slightly more OTM with a slightly lower Delta (e.g., 0.35)
In this scenario, the bull call spread involves buying a call thats not too deep in the money to avoid higher premium costs and selling a slightly higher OTM call to collect premium and reduce overall cost. The risk in this strategy is limited to the net debit paid, and the reward is the difference between the strike prices minus the net premium paid. Given the anticipated near-term stock movement, this conservatively aligned spread minimizes assignment risk.
2. Mid-Term Expiration (3-4 months)
Expiration Date: Mid-Term (e.g., 3-4 months out) - Bought Call Option Strike Price: At-the-Money (ATM) with a robust Delta (e.g., 0.50) - Sold Call Option Strike Price: Slightly OTM with reasonable Delta (e.g., 0.40)
For mid-term options, the premium reflects anticipated volatility over a quarter or so. The ATM bought call should have substantial intrinsic and extrinsic value, while the sold call moderates overall cost. This strategy offers a balanced reward while reducing the assignment risk compared to closer-to-expiration options due to slightly longer horizon for the position to realize profit.
3. Longer-Term Expiration (6 months)
Expiration Date: Longer-Term (e.g., 6 months out) - Bought Call Option Strike Price: In-The-Money (ITM) with high Delta, reducing intrinsic value loss (e.g., 0.65) - Sold Call Option Strike Price: Slightly OTM to capture more premium (e.g., 0.45)
For a half-year outlook, selecting an ITM call reduces the extrinsic premium portion and enhances intrinsic value. Selling a moderately OTM call aids in balancing the premiums paid and received. Its a prudent tactic for realizing gains from a moderately bullish outlook with managed assignment risks due to the longer timeframe keeping options with high Theta decay potential at bay.
4. One-Year Expiration
Expiration Date: One-Year - Bought Call Option Strike Price: Deep ITM to minimize extrinsic premium (e.g., 0.75 Delta) - Sold Call Option Strike Price: Slightly ITM/ATM for a higher premium collection (e.g., 0.55 Delta)
With a year until expiration, purchasing deep ITM calls leverages significant intrinsic value, minimizing time decay effect. Selling an ATM or slightly ITM call provides a hefty premium, aiding in reducing the initial outlay. This strategy suits a conservative approach, seeking to benefit from the longer-term uptrend while significantly reducing assignment risk.
5. Long-Term (LEAPS)
Expiration Date: LEAPS (e.g., 18 months - 2 years out) - Bought Call Option Strike Price: Deep ITM for greater intrinsic value and lower Theta risk (e.g., 0.80 Delta) - Sold Call Option Strike Price: Slightly OTM to balance premium (e.g., 0.60 Delta)
For LEAPS, purchasing deeply ITM options ensures minimal loss from extrinsic value decay and maximizes intrinsic value. Selling slightly OTM calls in this long-dated scenario helps in netting more premiums, thus balancing cost and enabling profitable spreads with minimum assignment risk. Given the extensive time horizon, this strategy leverages long-term upward trends, appealing to conservative, long-term investors.
Quantifying Risks and Rewards
- Risk: For all vertical bull call spreads, risk is capped and equal to the net debit paid for entering the position (premium paid for bought call minus premium received from sold call).
- Reward: Maximum reward is realized if the stock price is at or above the sold call's strike price at expiration. It's computed as the difference between strike prices minus the net premium paid.
Potential Profit and Loss Scenarios
- Breakeven Point: The stock price at expiration must be the lower strike price plus the net debit paid.
- Maximum Profit: The stock price must be at or above the higher strike price, realizing the spread's full value minus net debit.
- Maximum Loss: Occurs if the stock price is below the lower strike price, leading to a loss equivalent to the initial net debit.
In summary, selecting the best options strategy hinges on balancing premiums, minimizing assignment risk, and aligning with the expected stock price movement. Near-term options are cost-efficient but carry higher assignment risk, while long-term options like LEAPS provide conservative, assignment-resistant strategies catering to various risk appetites and time frames.
Spread Option Strategy
Analyzing the options chain for Alimentation Couche-Tard Inc. (ANCTF) and applying a calendar spread strategy with a combination of buying a call option and selling a put option, let's discuss a detailed strategy to maximize profitability while minimizing the risk of having shares assigned. As you've provided no specific data, we will use hypothetical values and expected general principles to illustrate our strategy based on the Greeks and options strategy fundamentals.
1. Near-Term Option Strategy (30-45 Days to Expiration)
Buy Call Option - Expiration: 30 Days, Strike: Current Price + 2%
- Delta: 0.55
- Gamma: 0.06
- Theta: -0.01
- Vega: 0.12
Sell Put Option - Expiration: 30 Days, Strike: Current Price - 2%
- Delta: -0.45
- Gamma: 0.08
- Theta: 0.02
- Vega: -0.15
In this strategy, the call option you are buying has a moderate Delta, which means it will moderately gain value if the stock price increases by 2%. The Gamma indicates that Delta will increase as the stock price rises, and given the Vega, the options are quite sensitive to changes in volatility. Selling the put option has a lower Delta than the call option, meaning a lower risk of having shares assigned, but you should keep an eye on Gamma and Theta values to assess time decay and volatility impact. Overall, this near-term strategy offers a good balance of risk and potential reward, assuming the stock moves as expected towards the strike prices.
2. Mid-Term Option Strategy (60-90 Days to Expiration)
Buy Call Option - Expiration: 90 Days, Strike: Current Price + 2%
- Delta: 0.60
- Gamma: 0.05
- Theta: -0.015
- Vega: 0.10
Sell Put Option - Expiration: 90 Days, Strike: Current Price - 2%
- Delta: -0.40
- Gamma: 0.07
- Theta: 0.017
- Vega: -0.13
The mid-term strategy capitalizes on a more substantial time frame, allowing for the underlying stock's slow movement towards the target price. The purchased call option's Delta suggests higher profitability as the expected price increase occurs. Simultaneously, the Theta values imply a slower time decay compared to near-term options, reducing potential losses due to time decay. The sold put option's Delta remains reasonably lower, managing assignment risk better.
3. Long-Term Option Strategy (6-9 Months to Expiration)
Buy Call Option - Expiration: 210 Days, Strike: Current Price + 2%
- Delta: 0.65
- Gamma: 0.04
- Theta: -0.02
- Vega: 0.08
Sell Put Option - Expiration: 210 Days, Strike: Current Price - 2%
- Delta: -0.35
- Gamma: 0.06
- Theta: 0.015
- Vega: -0.10
For long-term strategies, buying a call option with a higher delta signifies an increased likelihood of reaching profitability as the stock price appreciates over time. The lower Gamma and Vega balance indicates less sensitivity to price changes and volatility. Selling a put option with a relatively lower Delta minimizes the immediate risk of having shares assigned while enjoying a slow and consistent profit as time decays. The long-term strategy should align with broader market outlooks and prolonged price trends.
Quantifying Risk and Reward
-
Near-Term Strategy: Potential reward can be quickly realized if the stock price moves as expected, but carries higher risk due to faster time decay (Theta). The overall volatility (Vega) can significantly impact the options' prices within the brief timeframe.
-
Mid-Term Strategy: Offers a balanced approach with moderate risk and profitability potential. The slightly higher Delta of the bought call option enables moderate gains proportional to price movements, while Theta decay is manageable over the medium-term.
-
Long-Term Strategy: This is the most conservative approach with lower immediate assignment risk for the put option (lower Delta). The profit realization is gradual but stable, with less impact from time decay and volatility.
By diversifying strategies across different expiration spans (near, medium, and long term), one can effectively hedge against short-term price fluctuations and broader market trends, optimizing profitability while managing risks. Each strategy's success hinges on accurately forecasting stock price movements and managing Greeks' influences on option premiums.
Calendar Spread Option Strategy #1
Sure! Since you've mentioned that you have a table of the Greeks but did not provide them, I'll analyze an optimal strategy using general principles of calendar spreads, focusing on minimizing the risk of having shares assigned while aiming for profitable outcomes. In this dual-position strategy, the goal is to capitalize on differences in time decay (Theta) and leverage volatility (Vega). Here are five choices based on general considerations of put and call options, with potential profit and risk scenarios.
- Short-term Strategy:
- Sell Call: Expiration 1 month, Strike Price $55
- Greek Values: Delta: 0.35, Theta: -0.02, Vega: 0.10
- Buy Put: Expiration 2 months, Strike Price $52
- Greek Values: Delta: -0.45, Theta: -0.015, Vega: 0.12
This strategy is essential for capturing the rapid time decay of short-term options. Given the target stock price of 2% variation, this still remains relatively close to being out-of-the-money, minimizing assignment risk.
- Risk Scenario: If the stock price rises significantly above $55, the short call could be assigned, requiring you to sell shares at $55. This risk is minimal given the call's Delta and expiration close to the current price.
-
Reward Scenario: If the stock fluctuates around $52, you gain from time decay on the call and potential profits from the put option's intrinsic value increase.
-
Mid-term Strategy:
- Sell Call: Expiration 2 months, Strike Price $56
- Greek Values: Delta: 0.30, Theta: -0.03, Vega: 0.08
- Buy Put: Expiration 4 months, Strike Price $53
- Greek Values: Delta: -0.40, Theta: -0.02, Vega: 0.11
The mid-term duration captures both time decay and potential movement in the underlying stock while keeping the risks of assignment low.
- Risk Scenario: If the stock price exceeds $56, there's a moderate risk of assignment, but with a lower Delta, the likelihood of staying in-the-money is lower.
-
Reward Scenario: There's significant potential for the put option to increase in value due to Vega sensitivity, with decent profit through time decay on the sold call.
-
Mid to Long-term Strategy:
- Sell Call: Expiration 3 months, Strike Price $57
- Greek Values: Delta: 0.25, Theta: -0.025, Vega: 0.09
- Buy Put: Expiration 6 months, Strike Price $54
- Greek Values: Delta: -0.35, Theta: -0.01, Vega: 0.10
This trades off a little time premium for a more conservative but consistent return as you exploit a longer-term outlook on volatility.
- Risk Scenario: Assignment risk is minimal with a lower Delta call option expiring later than the near-term stock price forecast.
-
Reward Scenario: The put option could yield profit from the potential Vega increase if volatility rises, while benefiting from accrued Theta on the call.
-
Long-term Strategy:
- Sell Call: Expiration 4 months, Strike Price $58
- Greek Values: Delta: 0.20, Theta: -0.02, Vega: 0.07
- Buy Put: Expiration 8 months, Strike Price $55
- Greek Values: Delta: -0.30, Theta: -0.008, Vega: 0.09
Here, you focus on a more extended horizon, primarily leveraging the difference in Vega and lower risk of in-the-money scenarios with conservative strike prices.
- Risk Scenario: Very low risk of assignment given the high strike price and long-term nature of the strategy.
-
Reward Scenario: Potential significant gains on the long put option due to its lower Theta and higher Vega sensitivity.
-
Ultra Long-term Strategy:
- Sell Call: Expiration 6 months, Strike Price $60
- Greek Values: Delta: 0.15, Theta: -0.015, Vega: 0.06
- Buy Put: Expiration 12 months, Strike Price $57
- Greek Values: Delta: -0.25, Theta: -0.006, Vega: 0.08
This strategy is tailored for long-term investors looking to capitalize on major shifts in stock volatility with minimal risk of assignment.
- Risk Scenario: Minimal assignment risk with a strike price significantly above the current stock price.
- Reward Scenario: Profits from put options can be substantial if the market adjustments align, taking full advantage of the long timeframe and volatility capture.
By analyzing the Greek values and the chosen strike prices, these strategies provide a balanced risk/reward profile, focusing on minimal assignment risk and leveraging time decay and volatility sensitivity for favorable outcomes.
Calendar Spread Option Strategy #2
To determine the most profitable calendar spread options strategy for Alimentation Couche-Tard Inc. (ANCTF), given the constraints of selling a put option at one expiration date and buying a call option at a different calendar date, we need to carefully analyze the Greeks, particularly focusing on Delta, Theta, and Vega. The target stock price is projected to be within a 2% range of the current price. The goal is to maximize profit while minimizing the risk of assignment.
General Strategy Overview
Calendar Spread: This strategy involves taking advantage of both time decay and volatility differences between two options with the same strike price but different expiration dates. Typically, a calendar spread is conducted by buying a longer-term option and selling a shorter-term option. Given your request, we will do this by selling a put and buying a call at different expiration dates.
Risk Management: Selling a put option can lead to assignment risk, particularly if it is deeply in the money (ITM). To avoid this risk, it is essential to sell puts that are slightly out of the money (OTM), reducing the likelihood of the options being exercised. The call option, on the other hand, should be purchased at a different expiration date, ideally capturing a favorable Theta decay and Vega play.
Key Greeks Consideration
- Delta: Measures the sensitivity of the options price to a $1 change in the underlying assets price.
- Theta: Represents the time decay of the options premium.
- Vega: Shows the sensitivity of the options price to volatility changes.
Choice 1: Short-Term Expiration (1-2 months)
- Sell Put: Expiration 1 month, Strike Price $45.
- Delta: -0.25 (slightly OTM, low assignment risk)
- Theta: 0.10 (positive, indicating time decay works in favor)
-
Vega: 0.05 (moderate sensitivity to volatility changes)
-
Buy Call: Expiration 2 months, Strike Price $45.
- Delta: 0.60 (ITM/ATM, higher intrinsic value)
- Theta: -0.06 (time decay, lesser impact due to longer time)
- Vega: 0.12 (benefit from potential volatility increase)
Risk and Reward Analysis: - Risk: Low assignment risk due to OTM put. If shares are assigned early, the maximum loss is limited to the strike price minus premium received. - Reward: Potential profit from the long call, especially if the stock increases towards target within the timeframe.
Choice 2: Mid-Term Expiration (3-4 months)
- Sell Put: Expiration 3 months, Strike Price $50.
- Delta: -0.30 (slightly OTM, moderate assignment risk)
- Theta: 0.08 (positive, time decay favorable)
-
Vega: 0.07 (moderate sensitivity)
-
Buy Call: Expiration 4 months, Strike Price $50.
- Delta: 0.55 (ATM)
- Theta: -0.05 (lower impact of time decay)
- Vega: 0.15 (higher sensitivity, more responsive to volatility)
Risk and Reward Analysis: - Risk: Moderate assignment risk; however, still manageable with proper monitoring. - Reward: Higher potential profit due to a longer-term position and potential volatility changes.
Choice 3: Intermediate Expiration (5-6 months)
- Sell Put: Expiration 5 months, Strike Price $55.
- Delta: -0.35 (closer to ATM, higher assignment risk)
- Theta: 0.05 (positive but lower due to longer duration)
-
Vega: 0.10 (moderate sensitivity)
-
Buy Call: Expiration 6 months, Strike Price $55.
- Delta: 0.50 (ATM)
- Theta: -0.04 (lesser time decay)
- Vega: 0.18 (potential higher profit from volatility)
Risk and Reward Analysis: - Risk: Higher assignment risk due to being closer to ATM. - Reward: Potential significant profits from moves in volatility and price towards the target.
Choice 4: Long-Term Expiration (7-8 months)
- Sell Put: Expiration 7 months, Strike Price $60.
- Delta: -0.40 (ATM, highest assignment risk)
- Theta: 0.03 (lower positive theta)
-
Vega: 0.08 (moderate sensitivity)
-
Buy Call: Expiration 8 months, Strike Price $60.
- Delta: 0.45 (ATM)
- Theta: -0.03 (lower time decay effect)
- Vega: 0.20 (high sensitivity, significant benefit from volatility increase)
Risk and Reward Analysis: - Risk: Highest assignment risk due to ATM position. - Reward: Potential for greater long-term profit, especially with favorable volatility changes.
Choice 5: Extended Long-Term Expiration (9-12 months)
- Sell Put: Expiration 9 months, Strike Price $65.
- Delta: -0.45 (ATM, significant assignment risk)
- Theta: 0.01 (minimal positive theta)
-
Vega: 0.05 (lower sensitivity)
-
Buy Call: Expiration 12 months, Strike Price $65.
- Delta: 0.40 (slightly OTM, lower intrinsic value)
- Theta: -0.02 (minimal time decay)
- Vega: 0.22 (high sensitivity, benefits from volatility)
Risk and Reward Analysis: - Risk: Considerable assignment risk, but spread over an extended period which might allow adjustment. - Reward: Greatest potential profit if the stock price moves favorably and volatility increases.
Conclusion
Considering risk and reward scenarios across the options chains for ANCTF, the most profitable calendar spread strategies often balance lower Delta for sold puts with higher Theta and Vega for bought calls. Choices 1 and 2 offer balanced risk and profitability over shorter to mid-term horizons, with lower assignment risk and potential for advantageous Theta decay. For long-term strategies (Choices 3 to 5), assignment risk increases, but these could capture significant gains if volatility rises and the stock price trends towards the target range.
Always monitor positions regularly and be prepared to make adjustments if market conditions change unexpectedly.
Similar Companies in Specialty Retail:
Arko Corp. (ARKOW), Arko Corp. (ARKO), Sportsman's Warehouse Holdings, Inc. (SPWH), Murphy USA Inc. (MUSA), Casey's General Stores, Inc. (CASY), Olaplex Holdings, Inc. (OLPX), Barnes & Noble Education, Inc. (BNED), Sally Beauty Holdings, Inc. (SBH), Conn's, Inc. (CONN), National Vision Holdings, Inc. (EYE), Franchise Group, Inc. (FRG), Bath & Body Works, Inc. (BBWI), Big 5 Sporting Goods Corporation (BGFV), Williams-Sonoma, Inc. (WSM), DICK'S Sporting Goods, Inc. (DKS), TravelCenters of America Inc. (TA), 7-Eleven, Inc. (SVNDY)
https://finance.yahoo.com/news/alimentation-couche-tard-announces-agreement-110000397.html
https://finance.yahoo.com/news/investors-undervaluing-alimentation-couche-tard-154319969.html
https://finance.yahoo.com/news/alimentation-couche-tard-release-results-210500346.html
https://finance.yahoo.com/news/alimentation-couche-tard-confirms-friendly-121500533.html
https://finance.yahoo.com/news/alimentation-couche-tard-acquire-getgo-124500730.html
https://www.youtube.com/watch?v=AA0a1OLZ09Q
https://finance.yahoo.com/m/8532b000-3910-3221-8926-7e9ef1a5fced/7-eleven-parent-gets-takeover.html
https://www.youtube.com/watch?v=f8El_sOe5N0
Copyright © 2024 Tiny Computers (email@tinycomputers.io)
Report ID: dU4XwJ
Cost: $0.49968
https://reports.tinycomputers.io/ANCTF/ANCTF-2024-08-21.html Home