ANSYS, Inc. (ticker: ANSS)
2024-03-25
 ANSYS, Inc. (ticker: ANSS) stands as a global leader in engineering simulation software, essential for designing and testing products across a variety of industries such as aerospace, automotive, electronics, energy, and healthcare. The company's software solutions allow engineers and designers to simulate the physical aspects of their products, including structures, electronics, fluid dynamics, and semiconductors, dramatically reducing the need for costly physical prototypes and accelerating the innovation process. Founded in 1970 and headquartered in Canonsburg, Pennsylvania, ANSYS has evolved from a small company into a multinational corporation that serves thousands of enterprise customers worldwide. ANSYS's commitment to research and development has kept it at the forefront of simulation technology, solidifying its position in the market and ensuring continuous growth. Its comprehensive product suite supports a broad range of applications, empowering users to predict with confidence that their designs will thrive in the real world.
| Full Time Employees | 6,200 | Previous Close | $349.24 | Open | $347.58 |
| Day Low | $343.47 | Day High | $348.23 | Beta | 1.155 |
| Trailing PE | 60.65 | Forward PE | 32.30 | Volume | 416,393 |
| Average Volume | 834,626 | Market Cap | $30,240,423,936 | 52 Week Low | $258.01 |
| 52 Week High | $364.31 | Price To Sales Trailing 12 Months | 13.32 | Enterprise Value | $30,384,128,000 |
| Profit Margins | 0.22045 | Shares Outstanding | 87,017,800 | Book Value | $62.03 |
| Price To Book | 5.60 | Net Income To Common | $500,412,000 | Trailing Eps | 5.73 |
| Forward Eps | 10.76 | Last Fiscal Year End | 1703980800 | Earnings Quarterly Growth | 0.065 |
| Revenue Growth | 0.16 | Gross Margins | 0.91616 | Total Revenue | $2,269,948,928 |
| Ebitda Margins | 0.33421 | Operating Margins | 0.41361 | Free Cashflow | $645,751,424 |
| Sharpe Ratio | 0.31043875895647866 | Sortino Ratio | 5.603100108197204 |
| Treynor Ratio | 0.06983060836400413 | Calmar Ratio | 0.4214044736586224 |
Analyzing the provided data for ANSS, including technical analysis, fundamental, balance sheet data, ratios, and analyst expectations reveals a multi-dimensional view of its potential future stock movements. Starting with technical indicators in the closing months, we see a progressive increase in the OBV (On-Balance Volume), suggesting a robust accumulation phase. The MACD histogram values are positive and increasing over the same timeframe, indicating strong bullish momentum.
The fundamental data points to ANSS's strong operational and financial health. The company has shown a growth in gross margins, operating margins, and ebitdaMargins, which are crucial for operational efficiency and profitability. With a total revenue increment observed year-over-year, ANSS showcases its ability to generate sales and sustain growth even in a competitive environment. Moreover, the cash flows from operating activities have been robust, allowing ANSS to invest in growth opportunities.
Looking at the balance sheet, ANSS maintains a healthy treasury with significant cash and cash equivalents, which is crucial for short-term financial health and strategic investments. Despite the presence of debt, ANSS's substantial net income and operating income justify its debt levels while still positioning the company for future growth.
With the maritime financial ratiosSharpe, Sortino, Treynor, and CalmarANSS presents a promising but risk-aware investment profile. These ratios, especially the high Sortino ratio, suggest that ANSS can potentially offer strong returns for the risks assumed by investors. Moreover, the positive Altman Z-Score and Piotroski Score highlight a low risk of bankruptcy and solid financial health, respectively.
Analyst expectations, through earnings and revenue estimates, signal optimism about ANSS's future performance. The consensus points towards continued growth in earnings and revenue, with a notable sales growth forecast at 9.50%. These anticipations are supported by ANSS's historical performance and affirmed by revisions in EPS estimates.
Given the comprehensive evaluation of ANSS through technical analysis, fundamental performance, and projected growth, the outlook for the stock in the coming months is largely positive. The combination of strong market momentum, solid financials, a healthy balance sheet, and favorable analyst outlook suggests a continued bullish trajectory. However, as with any investment, market conditions and unforeseen external factors could influence actual performance. Investors are encouraged to monitor market and company-specific developments closely.
In our analysis of ANSYS, Inc. (ANSS), we have computed critical financial metrics that are essential for understanding the company's investment potential as outlined in "The Little Book That Still Beats the Market." The Return on Capital (ROC) for ANSYS stands at 10.03%, which signifies how effectively the company generates profit from its capital. An ROC of over 10% is generally considered good, indicating that ANSYS utilizes its capital efficiently to generate returns. On the other hand, the Earnings Yield for ANSYS is calculated at 1.66%, derived from the ratio of the companys earnings relative to its market price. Although a higher earnings yield is typically more attractive, reflecting better earnings per share for the price paid, it's crucial to compare this figure against industry benchmarks and interest rates. Considering the current low-interest-rate environment, ANSYS's earnings yield might still appeal to certain investors, especially when juxtaposed with returns on safer assets. However, investors should also weigh this against the company's growth prospects and the broader market context to make an informed decision.
| Statistic Name | Statistic Value |
| R-squared | 0.568 |
| Adj. R-squared | 0.567 |
| F-statistic | 1646 |
| Prob (F-statistic) | 1.38e-230 |
| Log-Likelihood | -2288.9 |
| No. Observations | 1256 |
| AIC | 4582 |
| BIC | 4592 |
| coef (const) | -0.0046 |
| coef (0) | 1.3015 |
| Std err (const) | 0.042 |
| Std err (0) | 0.032 |
| t (const) | -0.109 |
| t (0) | 40.577 |
| P>|t| (const) | 0.913 |
| P>|t| (0) | 0.000 |
| [0.025 (const) | -0.088 |
| 0.975] (const) | 0.078 |
| [0.025 (0) | 1.239 |
| 0.975] (0) | 1.364 |
| Alpha | -0.004617410558842024 |
| Beta | 1.3014906042511531 |
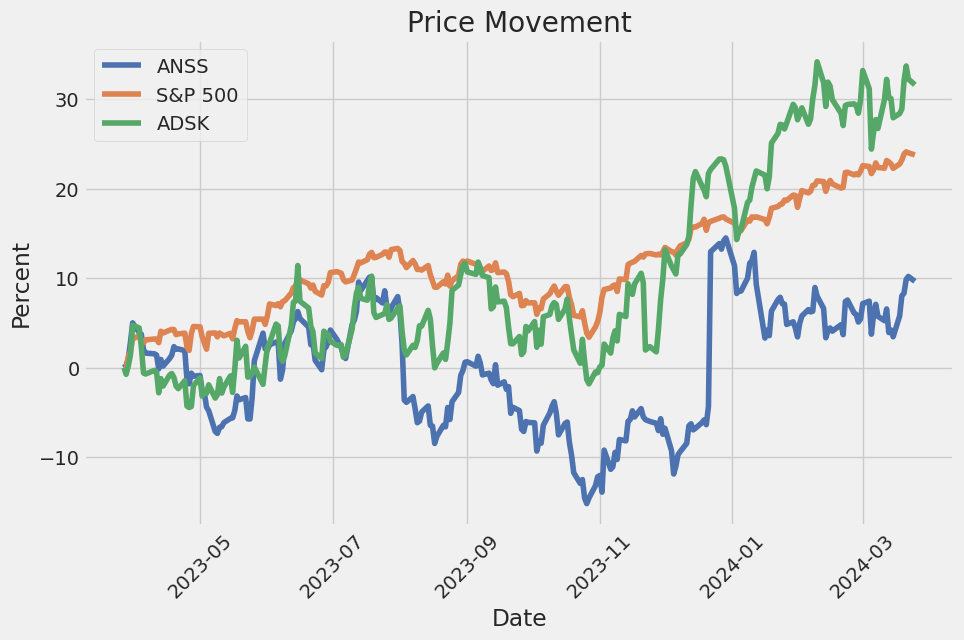
The linear regression analysis highlights a significant relationship between ANSS (ANSYS, Inc.) and SPY (SPDR S&P 500 ETF Trust) based on market data up to 25 March 2024. The analysis reveals a beta coefficient of 1.3015, suggesting that ANSS has a positive but more volatile movement in relation to the market (represented by SPY). For every unit of change in SPY, ANSS is expected to change by approximately 1.3015 units in the same direction under the observed conditions. However, the alpha value of -0.004617410558842024, though small, indicates a slight negative average return that ANSS generates over and above the returns predicted by the CAPM model, holding market movements constant.
The model's R-squared value of 0.568 indicates that approximately 56.8% of the variance in ANSS's returns is explained by its relationship with SPY, marking a considerable level of correlation between these two securities. Despite ANSS's positive beta coefficient suggesting it moves in tandem with the market but with greater magnitude, the alpha's slight negativity might raise concerns for investors looking for securities that consistently outperform market returns based on this model. It is essential to note that the practically insignificant alpha might not entirely detract from ANSS's value as an investment, considering its strong market-related movements captured by the relatively high beta.
ANSYS, Inc. held its third-quarter 2023 earnings conference call, witnessing participation from Ajei Gopal, President and CEO; Nicole Anasenes, CFO; and Kelsey DeBriyn, VP of Investor Relations, among others. The discussion revolved around the financial performance, recent business challenges, particularly focusing on sales restrictions to certain Chinese entities, and providing guidance for Q4 and the full fiscal year of 2023. Despite hurdles, ANSYS reported a strong quarter with double-digit growth in ACV, although the company acknowledged falling below expectations in both ACV and revenue due to the new U.S. Department of Commerce restrictions affecting sales to China.
During the call, Ajei Gopal highlighted the impact of additional vetting required for transactions involving prospects in China, attributing a decline in expected business to these new procedures. He mentioned that while this situation has temporarily dampened growth prospects in China through 2023 and 2024, ANSYS anticipates a return to steady-state growth thereafter. Nonetheless, Gopal expressed confidence in the overall strength and worldwide reach of the business, underpinned by solid performances across various industries such as high-tech, semiconductors, aerospace and defense, and automotive and ground transportation.
Gopal also delved into the transformative role ANSYS's simulation solutions play across different sectors, specifically focusing on the automotive industry. He outlined how simulation is ushering in a new era of mobility through electrification, autonomy, and software-defined vehicles. This detailed account underscored the significance of simulation technology in reducing project costs, enhancing battery management systems, and improving driver assistance systems, further catalyzing innovation in vehicle development.
CFO Nicole Anasenes provided financial insights, highlighting the company's resilient business model and the ability to deliver double-digit ACV growth despite market challenges, including new export compliance requirements in China. She raised the full-year ACV and revenue guidance based on operational momentum, offsetting impacts stemming from the tightened export regulations in China and currency exchange fluctuations. The guidance for the remaining fiscal year reflects optimism bolstered by a strong renewal business and a promising pipeline, despite acknowledging the unexpected quarter-three outcomes influenced by these regulatory challenges.
In summary, the earnings call painted a picture of a company navigating unforeseen regulatory hurdles with a positive outlook, buoyed by strong demand across industries for its simulation technologies. The emphasis on future growth, particularly through advancements in electrification and autonomous driving within the automotive sector, highlights ANSYS's strategic focus on innovation and market leadership in simulation software.
During the three months ended September 30, 2023, ANSYS, Inc. (ANSS) reported a decrease in GAAP revenue of 2.9% compared to the same period in 2022, which translates to a 4.2% decrease in constant currency. This decrease primarily resulted from reduced subscription lease license and perpetual license revenue, though this was partially balanced by an increase in maintenance revenue. Over the nine-month period ending September 30, 2023, ANSYS experienced a revenue increase of 6.8% (or 7.6% in constant currency) driven mainly by growth in maintenance and subscription lease license revenue, despite a dip in perpetual license revenue.
In terms of capital resources, as of September 30, 2023, ANSYS reported cash, cash equivalents, and short-term investments totaling $639.5 million, an increase of 4.1% since December 31, 2022. Working capital stood at approximately $908.1 million at the end of this period, marking a 4.5% rise from the end of the previous year. These financial resources, bolstered by cash flows from operating activitieswhich amounted to $484.4 million over the nine months up to September 30, thereby showing a 6.0% year-over-year increasehighlight ANSYSs robust financial health and its capacity to meet working capital and capital expenditure requirements, alongside its contractual obligations.
From an investment perspective, cash used in investing activities decreased by $38.5 million over the same nine-month span due to lesser acquisition-related net cash outlays compared to the prior year. Projections for capital expenditure were set at $25.0 to $30.0 million for fiscal year 2023, suggesting a focused approach to managing expenses and investments. Moreover, financing activities over the nine months encompassed $232.6 million in net cash usage mainly attributed to increased stock repurchases aligning with the company's strategy to enhance shareholder value.
The company's effective management of equity, as demonstrated by its stock repurchase program (650 shares repurchased over nine months in 2023 at an average price of $302.34), coupled with existing cash balances and operational cash flows, underscores ANSYS's strategic initiatives to foster growth while maintaining financial stability. Furthermore, ANSYS's acknowledgment of the potential impacts of external economic factors, including geopolitical tensions and shifts in trade policies, and the strategic inclination towards acquisitions, indicates a proactive and adaptive management approach aimed at maintaining its competitive edge in the engineering simulation software market amidst a rapidly changing global landscape.
These operating results and financial strategies reflect ANSYSs commitment to sustainable growth, operational efficiency, and shareholder value maximization amid potential economic and market challenges. Moving forward, the company appears well-positioned to navigate uncertainties with its strong financial foundation, strategic investments, and a focused approach towards managing expenses and optimizing operational performance.
In recent developments, Altair Engineering Inc. and Ansys, Inc. have showcased significant movements within the engineering simulation software sector, each making substantial strides in technological collaborations, financial performance, and strategic partnerships. Altair's Q4 2023 earnings call on February 23, 2024, revealed a period of robust performance, with a record high in both quarterly and full-year revenue. The company, under the leadership of James R. Scapa, highlighted financial growth with a 38.3% year-over-year increase in adjusted EBITDA for Q4 2023, reaching $53.6 million and pointing toward a consistent growth trajectory fueled by computational intelligence solutions.
Parallelly, Ansys, Inc. has been forging significant partnerships, most notably with NVIDIA, to pioneer the next era of simulation technology powered by accelerated computing and generative artificial intelligence (AI). This collaboration, announced on March 19, 2024, aims at disrupting several cutting-edge technological domains including 6G communication systems, autonomous vehicle technologies, and the development of physics-based digital twins. The partnership is set to integrate Ansys's simulation solutions with NVIDIA's AI technologies, significantly reducing design cycles and enhancing product deliverability across varied industries.
Adding another dimension to Ansys's strategic initiatives is its extended collaboration with Oracle Red Bull Racing. This relationship leverages advanced simulation and data management tools to develop faster and more reliable Formula 1 racing cars. The successes from the 2023 racing season, where driver Max Verstappen led over 1000 laps, underscore the critical role of Ansys's technology in achieving remarkable reliability and performance.
Furthermore, Ansys's engagement within the automotive sector has been solidified through a partnership with Hyundai Motor Company, making Ansys the preferred supplier of structural simulation solutions. This collaboration emphasizes enhancing vehicle safety and passenger comfort, marking a significant acknowledgment of Ansys's leadership in the engineering simulation space.
The financial arena also reflects a positive outlook for Ansys, Inc. Over the past five years, investors have witnessed an 81% return on their investment, a commendable performance that surpasses average market returns. This financial journey, as reported on March 15, 2024, illustrates the potential benefits of investing in high-quality businesses like Ansys. The company has seen a compound annual growth rate (CAGR) of 2.9% in its earnings per share (EPS) over this period, indicating a healthy growth trajectory.
On the competitive front, the merger announcement between Synopsys and Ansys, revealed in late January and expected to close in the first half of 2025, speaks volumes about the evolving dynamics within the tech industry. This merger aims to create a powerhouse capable of addressing the challenges posed by increasingly complex AI systems, thereby opening new market opportunities and enhancing capabilities in simulation software.
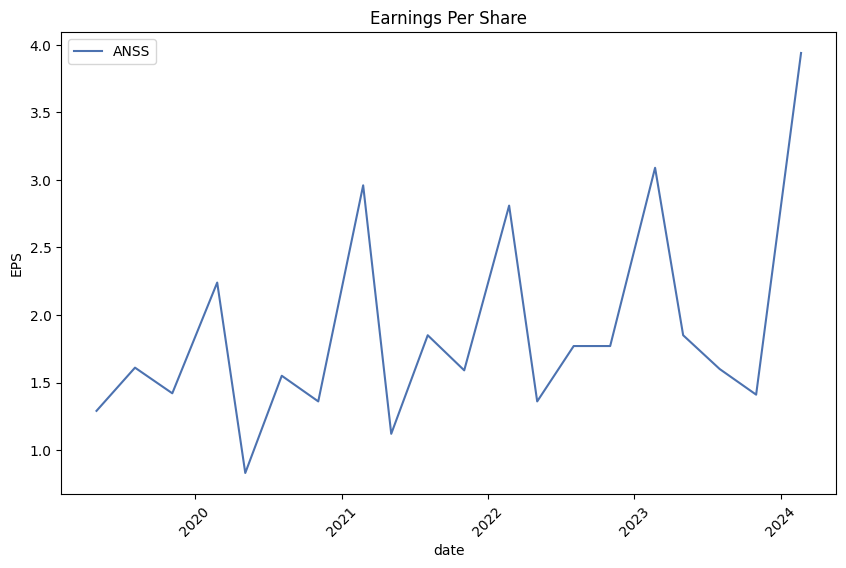
Ansys's recent fourth-quarter earnings for the year 2023 further solidify its financial health, with earnings per share standing at $3.94, surpassing expectations and marking a 27.5% improvement year-over-year. These results, coupled with a revenue increase to $2.27 billion, a 9.5% year-over-year increase, reflect a strong operational performance and strategic execution.
Despite not providing a financial outlook due to the pending acquisition by Synopsys, Ansys's leadership anticipates double-digit growth in ACV for 2024, underlining a forward-looking growth strategy focused on technological advancements and market expansion.
In summary, Ansys, Inc.'s strategic collaborations with NVIDIA and Oracle Red Bull Racing, along with its significant partnership with Hyundai Motor Company and the anticipated merger with Synopsys, underline its pivotal role in driving technological innovation in the engineering simulation software sector. Coupled with strong financial performance and an optimistic growth trajectory, Ansys stands well-poised to capitalize on its technological and market opportunities, signaling a promising future for its stakeholders.
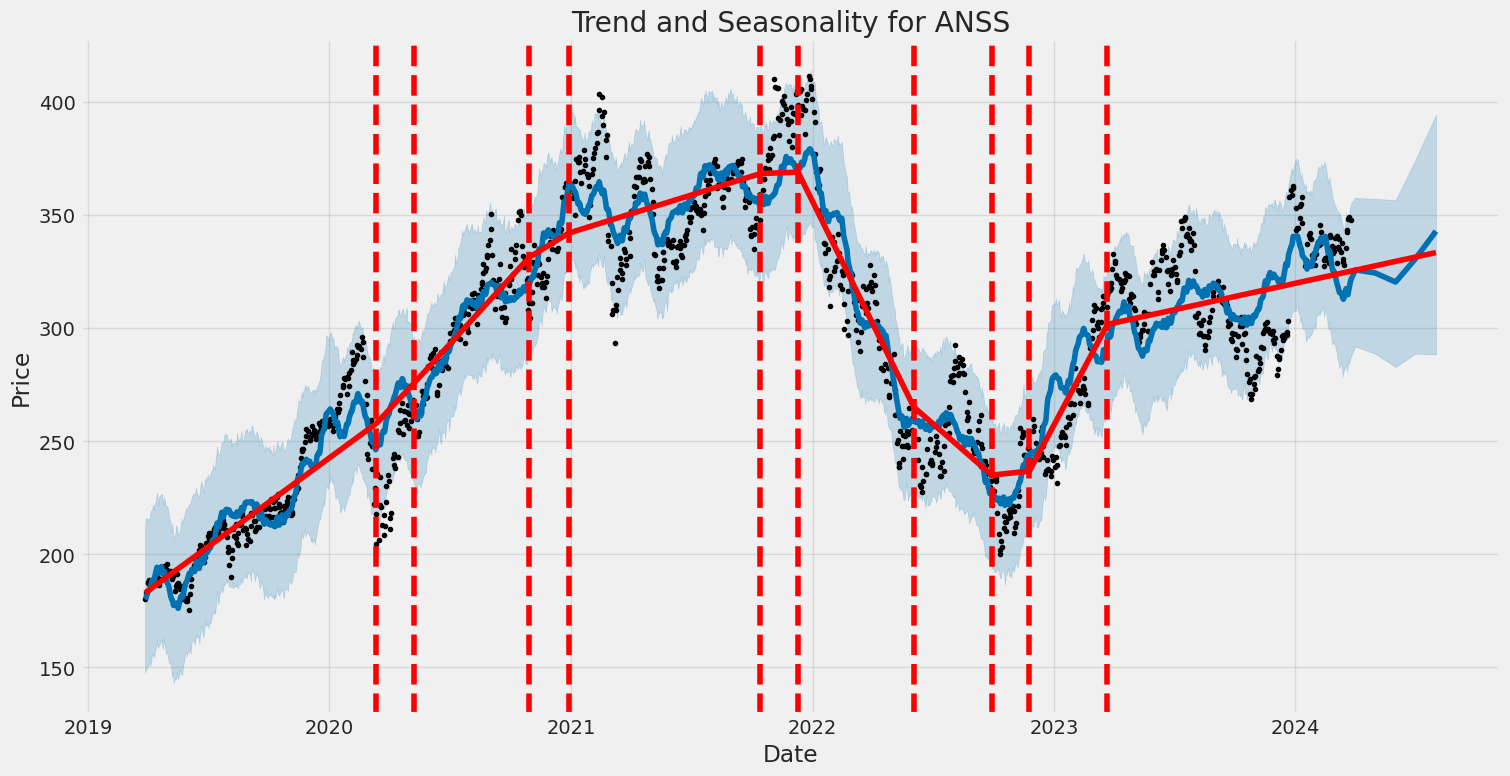
ANSYS, Inc. (ANSS) showcased a certain degree of volatility from March 28, 2019, to March 25, 2024, as revealed through the ARCH model analysis focused on its asset returns. Despite using a Zero Mean model indicating no assumed average change in returns over time, the model identified significant volatility through parameters such as omega and alpha[1], suggesting fluctuations in ANSS's returns. The model's results hint at potential unpredictability in ANSS's financial performance, with the omega coefficient indicating a base level of variance and the alpha[1] coefficient revealing the influence of past returns on current volatility.
| Statistic Name | Statistic Value |
| Omega | 3.7447 |
| Alpha[1] | 0.2944 |
The financial risk of a $10,000 investment in ANSYS, Inc. (ANSS) over a one-year period can be dissected using advanced analytical techniques, specifically volatility modeling and machine learning predictions. These methodologies offer a multifaceted understanding of the stock's behavior, emphasizing its price fluctuations and the potential for predicting future returns.
Volatility modeling plays a crucial role in understanding the inherent risk associated with the investment in ANSYS, Inc. This approach is adept at capturing the time-varying nature of the stock's volatility, a critical factor for investors who need to gauge the level of risk they are exposed to over time. The model does this by analyzing historical price data, allowing for the extraction of patterns that signify the stock's volatility dynamics. This information is paramount when assessing the investment's risk profile, as higher volatility typically indicates greater risk.
Complementing the insights gained from volatility modeling, machine learning predictions provide a forward-looking perspective on the stock's potential performance. Utilizing a sophisticated algorithm that learns from the stock's historical data, this approach makes informed predictions about ANSYS, Inc.'s future returns. The algorithm's ability to process vast amounts of data and identify complex, nonlinear relationships makes it an invaluable tool for investors aiming to forecast future market movements, thereby enhancing decision-making regarding the management of the investment.
The integration of these two analytical approaches culminates in the computation of the Value at Risk (VaR) for the $10,000 investment in ANSYS, Inc., at a 95% confidence interval. The calculated VaR of $317.65 is a statistical measure that represents the maximum expected loss over a specified time frame, under normal market conditions. This figure is pivotal for investors, as it quantifies the potential downside risk of the investment, providing a clear metric that reflects both the volatility and the forecasted return of the stock.
Through the conjunctive use of volatility modeling and machine learning predictions, investors are afforded a comprehensive view of the potential financial risks associated with investing in ANSYS, Inc. This analysis not only highlights the stock's volatility but also leverages predictive insights to gauge future performance. The calculated VaR serves as a critical benchmark for investors, encapsulating the essence of the investment's risk over a one-year horizon, thus facilitating informed risk management decisions.
Analyzing the options chain for ANSYS, Inc. (ANSS) with a target stock price set at 5% over the current price, we'll dive into determining the most profitable call options based on "the Greeks" - Delta, Gamma, Vega, Theta, and Rho - along with the factors like premium, days to expire, return on investment (ROI), and profit.
Before proceeding, it's essential to understand each Greek's role briefly. Delta measures the sensitivity of an option's theoretical value to a change in the price of the underlying asset. A Delta close to 1 indicates the option price moves almost in tandem with the stock price, making it more attractive for those expecting significant price movements. Gamma indicates the rate of change in Delta over time, adding insight into the stability of Delta's predications. Vega shows sensitivity to volatility, essential in predicting price changes, especially in turbulent markets. Theta represents the option's time decay, with a lower absolute value being preferable, minimizing value loss over time. Lastly, Rho gauges sensitivity to interest rate changes, generally a minor consideration for short-term options.
A standout in the analysis is the call option with a strike price of 280, expiring on April 19, 2024. This option showcases an impressive ROI of 1.871, high Delta (0.8916), moderate Gamma (0.00278), and significant Vega (16.57), positioning it as highly profitable, especially with a profit of 55.326. Its notable Delta suggests a strong alignment with the stock's price movement, while the moderate Gamma insinuates stability in this alignment over time. The high Vega value is advantageous in volatile markets, potentially increasing the option's value.
Another attractive option is the call with a strike of 320, expiring on April 19, 2024. It demonstrates robust profitability with an ROI of 1.7799, supported by a Delta of 0.7646 and the highest Gamma amongst our highlights (0.00680), indicating its Delta is likely to increase as the stock price rises. Additionally, with a Vega of 27.40, it's sensitive to changes in market volatility. The high ROI and considerable profit of 28.746 make it appealing for those forecasting an uptick in ANSS's volatility and price.
Conversely, looking at longer expirations, the option with a strike price of 290 expiring on December 20, 2024, shines for its significant ROI (0.9009) and a moderate profit of 35.496. Despite having a Delta of 1.0, indicating a one-to-one reaction to the stock price, and a negligible Gamma and Vega, highlighting its lesser sensitivity to volatility and the change in Delta, the substantial Rho suggests its valuation is considerably influenced by interest rate changes, a factor potentially impacting long-term options.
Finally, it's essential to consider options with different expiration dates to balance the portfolio's risk. For a more diversified strategy, one might mix short-term options, which are generally more sensitive to price movements and volatility, like the ones expiring in April 2024, with long-term options that provide stability and leverage different market conditions over time.
In summary, while the call option for ANSYS, Inc. (ANSS) with a strike price of 280 expiring in April 2024 presents a highly profitable short-term investment, diversifying with options like those expiring in December 2024 could hedge against volatility and changes in market conditions over time. High ROI, coupled with significant Delta and Vega values, delineates these options as most profitable, highlighting the importance of a strategic blend in selections by expiration and sensitivity metrics for optimizing returns on an options trading strategy.
Similar Companies in Software - Application:
Autodesk, Inc. (ADSK), ServiceNow, Inc. (NOW), Workday, Inc. (WDAY), Salesforce, Inc. (CRM), Roper Technologies, Inc. (ROP), Manhattan Associates, Inc. (MANH), Guidewire Software, Inc. (GWRE), Dayforce Inc. (CDAY), Tyler Technologies, Inc. (TYL), Paylocity Holding Corporation (PCTY), PTC Inc. (PTC), HubSpot, Inc. (HUBS), Datadog, Inc. (DDOG), Intuit Inc. (INTU), Aspen Technology, Inc. (AZPN), Dassault Systemes (DASTY), Siemens AG (SIEGY), Altair Engineering Inc. (ALTR)
https://finance.yahoo.com/news/q4-2023-altair-engineering-inc-143532035.html
https://finance.yahoo.com/news/oracle-red-bull-racing-ansys-140000833.html
https://finance.yahoo.com/m/fa7f8c84-d0d4-31d2-aca4-50bd6d000ea1/up-80%25-since-2023%2C-is-this.html
https://finance.yahoo.com/news/ansys-named-preferred-supplier-hyundai-140000404.html
https://finance.yahoo.com/news/investing-ansys-nasdaq-anss-five-111207881.html
https://finance.yahoo.com/news/ansys-nvidia-pioneer-next-era-220000287.html
https://finance.yahoo.com/news/ansys-anss-nvidia-partner-advance-154800411.html
https://finance.yahoo.com/news/ansys-anss-2-3-since-153040556.html
https://www.sec.gov/Archives/edgar/data/1013462/000101346223000055/anss-20230930.htm
Copyright © 2024 Tiny Computers (email@tinycomputers.io)
Report ID: w5f3JQ
Cost: $0.72187
https://reports.tinycomputers.io/ANSS/ANSS-2024-03-25.html Home