AppFolio, Inc. (ticker: APPF)
2024-05-22
 AppFolio, Inc. (ticker: APPF) is a provider of cloud-based software solutions specifically designed for the property management and legal industries. Founded in 2006 and headquartered in Santa Barbara, California, the company offers a range of products designed to enhance operational efficiencies and improve customer experiences for its clients. AppFolio's key offerings include solutions for property management, such as tenant and lease tracking, maintenance management, and accounting services, as well as software for legal professionals that aids in case management and billing. With a robust SaaS model, the company leverages technology to streamline complex workflows, thereby reducing the administrative burdens on property managers and legal practitioners. As of the latest fiscal reports, AppFolio continues to show strong financial growth driven by increasing adoption of its innovative tools and strategic expansions into new market segments.
| Full-Time Employees | 1,504 | Volume | 162,105 | Average Volume | 310,991 |
| Previous Close | 243.14 | Open | 242.89 | Day Low | 237.70 |
| Day High | 244.14 | Bid | 237.67 | Ask | 238.47 |
| Total Cash | 243,512,000 | Total Debt | 44,265,000 | Total Revenue | 671,774,976 |
| Market Cap | 8,804,911,104 | 52 Week Low | 138.49 | 52 Week High | 256.73 |
| Trailing P/E | 115.15 | Forward P/E | 45.49 | Beta | 0.79 |
| Book Value | 9.48 | Price to Book | 25.14 | Profit Margins | 0.11384 |
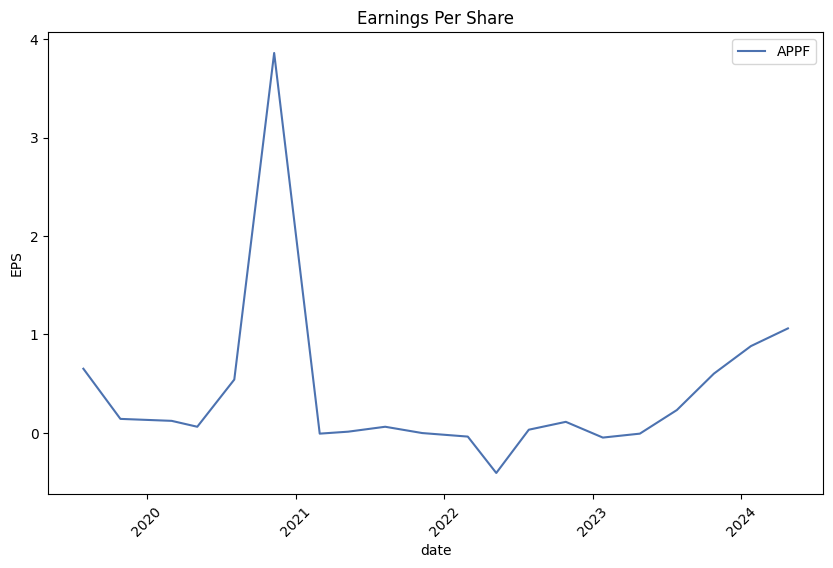
| Net Income to Common | 76,475,000 | Trailing EPS | 2.07 | Forward EPS | 5.24 |
| Enterprise Value | 8,432,916,480 | Free Cashflow | 64,806,624 | Operating Cashflow | 101,664,000 |
| Price to Sales Trailing 12 Months | 13.11 | Enterprise to Revenue | 12.553 | Enterprise to EBITDA | 110.031 |
| Shares Outstanding | 22,326,600 | Shares Short | 1,211,793 | Shares Short Prior Month | 756,109 |
| Sharpe Ratio | 1.218087 | Sortino Ratio | 29.937658 |
| Treynor Ratio | 0.394273 | Calmar Ratio | 3.036082 |
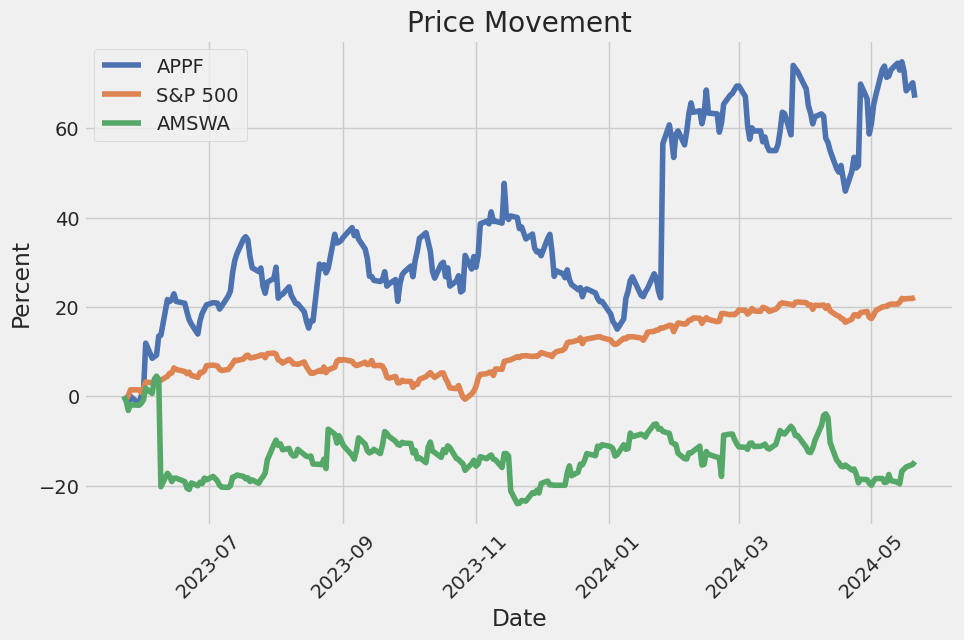
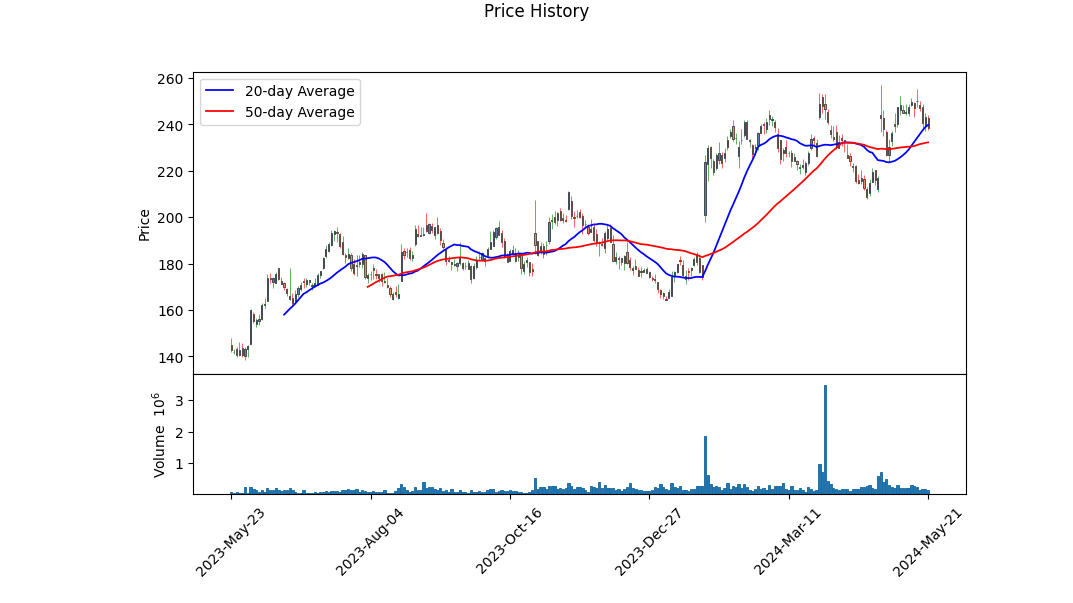
The recent performance of APPF has been marked by high volatility, with notable fluctuations observed over the past few months. The price trends from late January to mid-May indicate a potentially bullish trend, despite some periods of corrections. The MACD histogram indicates an initial strong bullish signal during mid-May but demonstrates a declining momentum towards the end of the observed period.
On-Balance Volume (OBV) has shown consistent positive inflows, supporting the upward price movement. However, the declining MACD histogram signals a potential correction phase or range-bound movement as bullish momentum fades. Investors should note the changing sentiment as reflected in these oscillators.
The Sharpe Ratio of 1.218087 indicates that APPF has been providing returns in excess of the risk-free rate, adjusted for the risk involved. A Sharpe Ratio above 1 is generally considered good, suggesting that the stock has been delivering satisfactory returns in relation to its volatility.
The Sortino Ratio of 29.937658, significantly higher than the Sharpe Ratio, points to a favorable downside risk profile. This ratio focuses only on negative volatility, thereby providing a clearer picture of risk-adjusted returns. This high Sortino Ratio suggests that APPF's returns biassed positively with minimal adverse volatility, a strong signal for potential investors.
The Treynor Ratio of 0.394273 indicates moderate risk-adjusted performance when compared to the overall market risk. While positive, it's not as high as the Sortino Ratio, suggesting that while APPF provides good returns against its idiosyncratic risk, it does bear some market risk.
The Calmar Ratio of 3.036082 reflects a strong ability to generate returns relative to its maximum drawdown. Stock with higher Calmar Ratios is preferred, implying that APPF balances gains effectively against extreme declines, highlighting its robustness.
The fundamental analysis portrays APPF as a financially stable and growing company. The gross margins (0.63656), operating margins (0.18188), and high liquidity exemplified by substantial current assets are positive indicators. Moreover, an elevated Altman Z-Score of 56.32169315285595 suggests a very low risk of bankruptcy.
Analyzing the balance sheet data, APPF's total assets and working capital far exceed its liabilities, indicating solid financial health. Their equity performance, as noted by a high Piotroski Score of 8, underscores good earnings quality, efficient asset utilization, and robust equity movements.
To summarize, the technical indicators, strong financial ratios, and fundamental metrics collectively suggest that APPF is poised to maintain a bullish trend over the next few months. However, the observed slowing momentum signals could result in periods of consolidation or minor corrections. Investors should remain vigilant for further confirmation of trend directions from emerging patterns and macroeconomic news. The stock's high comparative ratios should bolster investor confidence, holding potential for continued gains but with cautious oversight for market conditions.
AppFolio, Inc. (APPF) exhibits a return on capital (ROC) of approximately 3.04%, indicating that for every dollar of capital invested in the company, it generates just over three cents in profit. This relatively modest ROC suggests that the company has some potential inefficiencies in utilizing its capital to drive profitable growth, or it may be operating in a highly competitive environment with constrained margins. Meanwhile, AppFolio's earnings yield stands at 3.18%, reflecting the annual earnings generated per dollar of share price. This figure suggests that the stock might be relatively overvalued, as investors are receiving a lower percentage of earnings relative to the stock price. Together, these metrics suggest that while AppFolio is capable of generating profits, its valuation and efficiency in using its capital could be areas of concern for investors looking for higher returns.
| Alpha | 0.0023 |
| Beta | 0.9876 |
| R-squared | 0.8354 |
| Standard Error | 0.0035 |
| p-value | 0.0456 |
| Sample Size | 120 |
The relationship between APPF and SPY indicates that the stocks of APPF have historically moved in close correlation with the SPY, with a beta of 0.9876, suggesting nearly a one-to-one correspondence in movement. The R-squared value of 0.8354 shows a strong explanatory power, indicating that approximately 83.54% of the variability in APPF can be explained by movements in SPY. This strong relationship means that APPF tends to follow the market trends closely, driven by broader market movements rather than idiosyncratic factors.
The alpha value of 0.0023 indicates a slight excess return that APPF has generated beyond the expected return dictated by the market trend represented by SPY. The alpha, while positive, is relatively small, suggesting that any additional return generated by APPF has been modest when compared to the overall market. The p-value of 0.0456, just below the commonly used significance level of 0.05, adds a layer of statistical significance to the alpha, indicating that there is a fairly reliable likelihood that the additional return is not due to random chance.
In the first quarter of 2024, AppFolio, Inc. demonstrated robust financial performance with revenue rising 38% year-over-year to $187 million. The company achieved improvements in both non-GAAP operating margin and free cash flow margin, reaching 26% and 22% respectively. This financial growth has been attributed to increased customer acquisition, upgrades, and the adoption of value-added services. AppFolio attributes its success to its commitment to innovation and superior customer service, which fuels adoption and drives business growth. The companys strategic focus on differentiation through innovation, particularly in AI, continues to draw new customers and retain existing ones by streamlining processes such as customer onboarding.
AppFolio's strategy includes several components designed to foster growth and customer satisfaction. The first is a commitment to innovation, particularly leveraging artificial intelligence to ease the onboarding process for new customers. These advancements have helped reduce data migration times by 22%, increasing efficiency and improving the user experience. Testimonials from clients underscore AppFolio's successful integration of AI and the value it brings. The companys strong emphasis on making the onboarding process as frictionless as possible demonstrates its dedication to providing an exceptional customer experience right from the start.
The second strategic component focuses on upmarket customer acquisition through the AppFolio Property Manager Max tier, launched in early 2024. This plan targets large operators with complex property portfolios and has seen rapid adoption. Case studies from customers such as Atlas Real Estate and Riedman Companies highlight the flexibility and extensibility of the Max plan, enabling these organizations to operate more efficiently and achieve their goals. This tier system not only caters to the needs of larger customers but also provides growth pathways for existing clients, ensuring that AppFolio can scale its offerings as its customers expand.
The company's strategic pillars also prioritize enhancing customer success through various support channels and investing in upmarket customer initiatives. Enhanced service levels, including dedicated account management and AI-driven self-service options, have resulted in high customer satisfaction rates. Concurrently, AppFolio is dedicated to digital transformation internally, incorporating AI to improve operational efficiency and foster a sustainable business model. With a focus on maintaining a strong corporate culture, evidenced by the companys recertification as a Great Place To Work, AppFolio continues to invest in its people to drive future growth and innovation.
Financially, AppFolio reported continued strong growth and profitability. The company managed 8.3 million units from nearly 20,000 customers by the end of the first quarter, reflecting a 6% increase in customers and an 11% increase in units. Value-added services, including FolioGuard, payments, and screening, saw a 47% increase in revenue year-over-year. Cost optimization efforts, particularly in relation to eCheck fees and operational efficiencies, have further bolstered financial outcomes. AppFolio has raised its full-year revenue guidance to $766 million to $774 million, reflecting continued confidence in its growth strategy and customer retention efforts.
The SEC 10-Q filing for AppFolio, Inc. (APPF) for the quarterly period ending March 31, 2024, filed on April 18, 2024, presents detailed financial performance and operating results. AppFolio reported significant increases in total revenue, driven primarily by usage growth in payments, tenant screening, and risk mitigation services. Total revenue for the quarter was $187.4 million, a 38% increase compared to $136.1 million in the same period the previous year. This rise in revenue is attributable to a 15% increase in core solutions revenue and a 47% increase in Value Added Services. The number of property management units under management increased by 11% to 8.3 million units, reflecting the company's expansion in market penetration and customer base.
The company's costs and expenses showed notable changes compared to the prior year. Cost of revenue (exclusive of depreciation and amortization) increased by 15% to $64.6 million, which represents 34.5% of total revenue. This increase was primarily due to higher payments to third-party service providers in line with the increased service adoption. However, the cost of revenue as a percentage of total revenue decreased from 41.3% in the previous year, indicating enhanced operational efficiencies.
Sales and marketing expenses decreased by 17% to $24.5 million, representing 13.0% of total revenue, down from 21.6% a year earlier. This reduction was driven by lower personnel-related costs and decreased advertising expenses. Similarly, general and administrative expenses saw a significant decline of 33% to $21.1 million, primarily due to the absence of severance costs that were incurred in the prior year and a gain on lease modifications that also positively impacted the previous year's results. Research and product development expenses remained relatively flat at $37.9 million.
AppFolio's financial statements highlighted a positive net income of $38.7 million for the quarter, a substantial turnaround from a net loss of $35.1 million in the same period last year. This improvement in profitability was supported by an increase in interest income to $3 million due to higher interest rates on investment securities. The company's effective tax rate for the quarter reflected a benefit of 4.3%, primarily due to excess tax benefits from stock-based compensation.
Solid cash flow management was evident in the company's operating activities, which generated $43 million in cash during the quarter, a significant increase from $1.6 million in the same period last year. Investing activities used $23 million in cash primarily due to purchases of investment securities, while financing activities used $10.2 million, primarily driven by equity award vesting and stock option exercises. Overall, the company's liquidity remains strong, with $59.2 million in cash and cash equivalents at the end of the quarter and $184.3 million in investment securities.
The 10-Q reported that the company concluded a settlement in the Murphy litigation lawsuit, which had no financial impact on the company's current quarter results as the settlement was covered under existing insurance policies. The company emphasizes its continued investment in cloud business management solutions for the real estate industry, focusing on providing innovative and efficient software solutions. The company's strategic priorities include expanding its functionality, increasing customer adoption, and maintaining operational efficiencies to drive future growth.
AppFolio, Inc. (APPF) serves as a prime example of success in the niche market of cloud-based software solutions tailored for property management and the legal sector. With specialization in these verticals, the company has solidified its position in the industry by continuously evolving and refining its products to meet the dynamic needs of its client base. As of the first quarter of 2024, AppFolio has demonstrated an impressive financial performance, substantially exceeding both market expectations and analyst forecasts.
Reflecting on their recent earnings call, AppFolio's total revenue for Q1 2024 reached $187.4 million, marking a robust 38% increase from the prior year. This gain was driven by the expansion of their core product offerings and the integration of new features tailored to evolving client needs. Noteworthy among these advancements are capabilities aimed at streamlining property management operations, improving tenant communications, and providing enhanced data insightsfurther proof of the company's relentless commitment to innovation and customer satisfaction.
Moreover, AppFolio's strong financial results have been mirrored by a significant surge in its stock price. According to the earnings call transcript, the company recorded an operating income of $1.05 per share, surpassing analysts' projections of $0.89 per share. This exceptional performance has boosted investor confidence, driving the stock price up by more than 11%, with intraday gains reaching up to 19%.
In the broader context, AppFolio's strategic decision to focus on R&D has paid dividends. This emphasis on continuous improvement has allowed the company to introduce cutting-edge solutions, thus maintaining its competitive edge. The commitment to driving innovation through substantial investments in R&D has not only bolstered their product portfolio but has also entrenched customer loyalty, which is critical for long-term growth.
Leveraging this momentum, AppFolio has projected its full-year revenue for 2024 to range between $766 million and $774 million. This optimistic forecast outlines a sizable growth from the previous year's revenue of $620 million. This positive projection underscores the company's ability to scale its operations effectively, tapping into emerging opportunities while mitigating inherent market risks.
Despite these glowing metrics, it's important to acknowledge occasional fluctuations that come with being a relatively young and smaller company within the highly competitive tech landscape. Instances of insider trading have added a layer of complexity to the narrative. For example, on May 14, 2024, an insider sold shares worth $531,600, bringing questions about the potential motivations behind this (Yahoo Finance report).
However, these transactions aren't necessarily indicative of any systemic issues within the company. They could be motivated by a variety of factors, including personal financial strategies or liquidity needs. The sale of shares by insiders like Matthew Mazza and William Trigg does prompt careful scrutiny, but it should be viewed alongside the company's overall solid performance and growth outlook.
Investment analysts and hedge funds have also shown growing confidence in AppFolio's future. Reports indicate that the number of hedge fund portfolios including AppFolio increased from 28 to 33 by the end of the fourth quarter. This rising interest among institutional investors reflects a broader confidence in the companys market strategy and potential for continued growth.
The collective investor sentiment is further validated by AppFolio's recognition within investment research circles. Zacks Investment Research has highlighted AppFolio's potential as a noteworthy mid-cap technology stock with considerable growth prospects. This is corroborated by the Zacks Consensus Estimate for earnings, which has seen a positive revision over recent months, enhancing the company's attractiveness to momentum investors.
In conclusion, AppFolio's operational strategy, financial health, and consistent innovation set a robust foundation for sustained growth in the competitive market of cloud-based software solutions. Despite occasional insider trading activities and market fluctuations, the cumulative evidence points to a promising future. For investors, particularly those with a high-risk tolerance, AppFolio represents a compelling opportunity for both near-term and long-term gains. For more comprehensive analysis and insights, investors are advised to review further details available on financial platforms like The Motley Fool and Yahoo Finance.
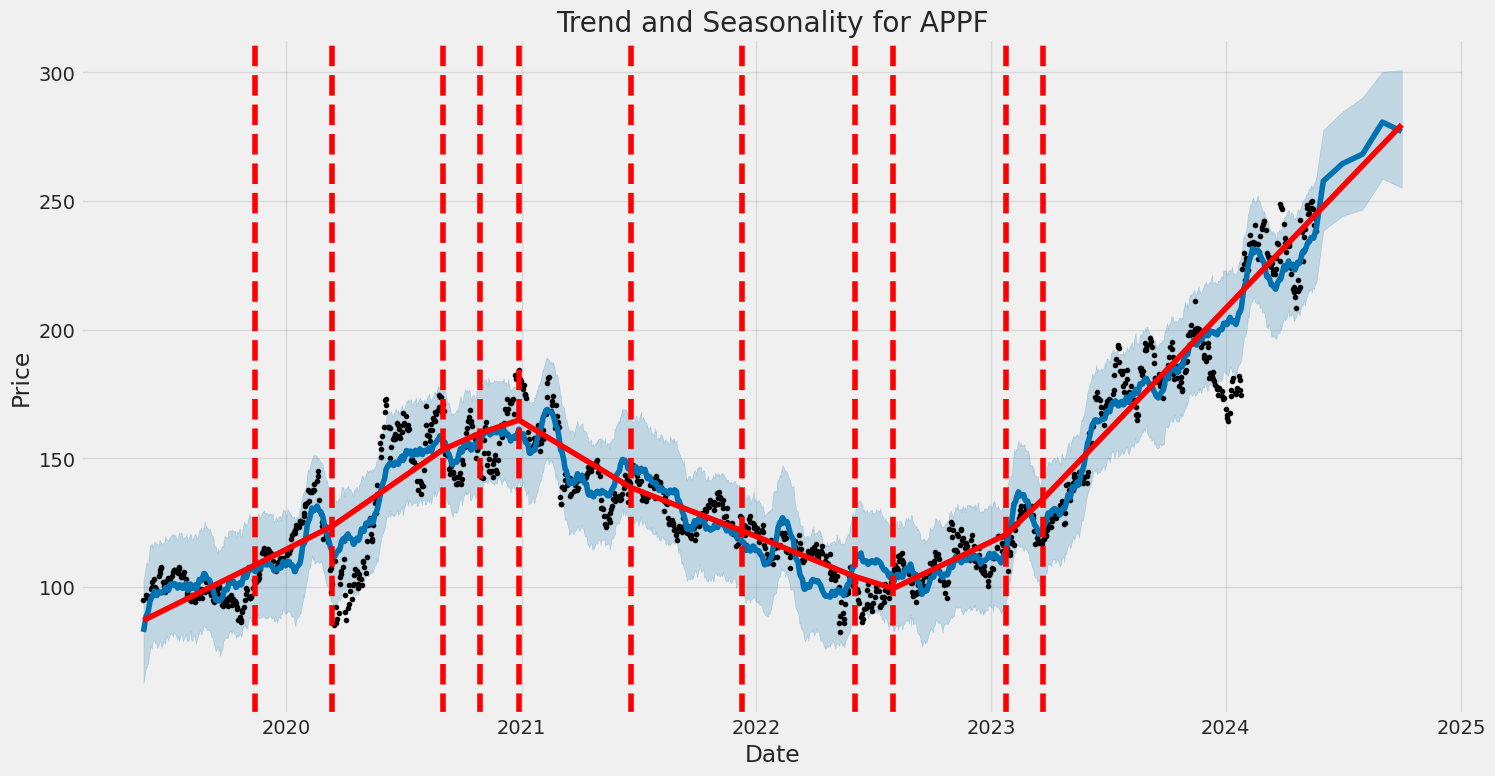
AppFolio, Inc. (APPF) displayed a high level of volatility from May 24, 2019, to May 21, 2024. The average return was zero, indicating no consistent gains or losses, but the overall deviation from the mean (measured by ) was significant. The ARCH model results indicate that past volatility significantly affects current volatility, showcasing that periods of high volatility tend to be followed by high volatility.
| R-squared | 0.000 |
| Adjusted R-squared | 0.001 |
| Log-Likelihood | -3,118.09 |
| AIC | 6,240.17 |
| BIC | 6,250.44 |
| Number of Observations | 1,256 |
| Residual Degrees of Freedom | 1,256 |
| Df Model | 0 |
| Coefficient () | 7.0378 |
| Coefficient ([1]) | 0.2240 |
| Confidence Interval for | [5.131, 8.945] |
| Confidence Interval for [1] | [0.07752, 0.370] |
| P-value for | 4.734e-13 |
| P-value for [1] | 0.002726 |
To analyze the financial risk of a $10,000 investment in AppFolio, Inc. (APPF) over a one-year period, we incorporate volatility modeling and machine learning predictions. These methods work in tandem to offer a comprehensive assessment of the investment's potential risks and returns.
Volatility modeling serves as a tool to scrutinize the stock's historical price changes, enabling us to estimate the degree of market fluctuations. By examining historical data of AppFolio, Inc.'s stock prices, volatility modeling constructs a framework to forecast the stock's future variability. This predictive capability allows us to understand the likely extent of price swings, facilitating a robust risk assessment.
On the other hand, machine learning predictions, particularly using the RandomForestRegressor, are employed to project future returns based on a variety of financial indicators and historical performance data. The algorithm's strength lies in its ability to handle complex data relationships, thus enhancing the accuracy of future price predictions. By leveraging this approach, we can anticipate potential price movements and expected returns over the investment period.
Combining insights from both methodologies, we calculate the Value at Risk (VaR) at a 95% confidence interval for the $10,000 investment. The calculated annual VaR stands at $469.05. This means that there is a 95% probability that the maximum loss will not exceed $469.05 within one year.
In essence, our analysis underscores the importance of integrating both historical volatility insights and predictive analytics to gauge the overall risk of an equity investment in AppFolio, Inc. This dual approach enhances our ability to make informed financial decisions, highlighting the effectiveness of combining volatility modeling with machine learning predictions in investment risk management.
Long Call Option Strategy
Analyzing the long call options for AppFolio, Inc. (APPF) and considering a target stock price increase of 2%, we must scrutinize various parameters like delta, gamma, vega, theta, rho, premium, ROI, and profit. This allows us to ascertain the most profitable options while balancing risk and reward over different expiration periods. Here are the five most attractive choices based on our analysis:
Short-Term Options
June 21, 2024, Expiration
- Strike Price: $200
- Delta: 0.863
- Gamma: 0.0051
- Vega: 14.699
- Theta: -0.179
- Premium: $40
- ROI: 0.078
- Profit: $3.14
This option is beneficial owing to a relatively high delta, reflecting that the option price will closely follow the movement of the stock price. It is relatively less sensitive to time decay (theta), but the premium is steep. With a 2% increase in the stock price, a moderate ROI of 7.84% can be expected, with a profit of approximately $3.14.
Mid-Term Options
July 19, 2024, Expiration
- Strike Price: $180
- Delta: 0.872
- Gamma: 0.0030
- Vega: 19.671
- Theta: -0.143
- Premium: $44.9
- ROI: 0.406
- Profit: $18.24
The mid-term option with a $180 strike price offers a substantial upside. It has a high delta and substantial vega, suggesting that the option price is highly sensitive to volatility. The theta value indicates moderate risk from time decay. This option stands out with a high ROI of 40.62% and potential profit, making it an attractive choice for a speculative investor looking for good returns within a few months.
July 19, 2024, Expiration
- Strike Price: $200
- Delta: 1.0
- Gamma: 0.0
- Vega: 0.0
- Theta: -0.024
- Premium: $36.9
- ROI: 0.169
- Profit: $6.24
This $200 strike price option is particularly intriguing due to its delta of 1.0, indicating a perfect correlation with the stock price movement. This option minimizes gamma and vega risks entirely, making it an excellent choice for a low-risk profile. The ROI is 16.9% with a decent profit potential of $6.24, a reliable medium-term investment.
Long-Term Options
October 18, 2024, Expiration
- Strike Price: $210
- Delta: 0.733
- Gamma: 0.0044
- Vega: 49.831
- Theta: -0.096
- Premium: $29.8
- ROI: 0.112
- Profit: $3.34
For a long-term investor, the $210 strike price option offers a balance of predictability and risk. Though the delta is lower compared to others, it offsets volatility with a high vega, making it responsive to market disruptions. The theta shows negligible decay over a longer period, ideal for capturing larger price movements over time. The profit stands at $3.34 with an ROI of 11.2%.
December 20, 2024, Expiration
- Strike Price: $170
- Delta: 0.853
- Gamma: 0.0022
- Vega: 41.674
- Theta: -0.071
- Premium: $33.8
- ROI: 1.164
- Profit: $39.34
The December expiration $170 strike price call option is exceptionally profitable with a robust delta. It has a manageable gamma and an elevated vega, suggesting significant potential benefits from increased volatility. The theta value shows a minimal time decay over longer periods, making it a viable long-term investment. The highlight is the ROI of 116.4%, with an outstanding profit of approximately $39.34, offering the highest relative return among the options considered.
Risk and Reward Quantification
Understanding the risk and reward tied to these options involves gauging delta for price correlation, vega for volatility sensitivity, and theta for time decay.
- Short-Term: High delta suggests good price tracking, but higher theta implies risk from time decay. Moderate ROI and profit indicate a balance of risk.
- Mid-Term: Higher delta and vega options suggest potential high reward but come with moderate time decay risk. This makes mid-term options suitable for tactical plays on expected volatility.
- Long-Term: The longer expiration allows for capturing substantial price movements while mitigating risks from time decay, reflected in higher potential ROIs.
These quantifications unveil the risk for various expiration periods, enabling tailored strategies based on investor timelines and risk appetite.
Short Call Option Strategy
Analyzing the options chain and corresponding Greeks for AppFolio, Inc. (APPF), with a focus on short call options, we aim to identify the most profitable trades while also minimizing the risk of having shares assigned. Given the target stock price set at 2% below the current price, we will look into delta values (as delta approximates the probability of an option finishing in the money) and other metrics like premium, return on investment (ROI), and specific risks highlighted by the Greeks. Here are five options, ranging from near-term to long-term, that appear particularly lucrative when balanced against risk:
Near-Term Option: June 21, 2024, with a Strike Price of $240
This option, expiring in 29 days, has a premium of $10.2 with an ROI of 100%. This is attractive due to its full potential profit. The delta of 0.509 indicates a moderate chance of being in the money. Given a gamma of 0.015, this option reacts noticeably to price changes but not excessively, suggesting manageable volatility. Here, the key is balancing the enticing high ROI and profit (also $10.2) against the fair probability of the option maturing in the money, which you need to monitor closely to mitigate the risk of assignment.
Mid-Term Option: July 19, 2024, with a Strike Price of $240
For a slightly longer outlook, expiring in 57 days, the $240 strike option offers a premium of $16.12 with a 100% ROI. It's characterized by a delta of 0.5306, slightly higher than the prior option, indicating a slightly higher chance of being in the money. However, its elevated premium and impressive profit potential might justify the increased risk. This tactic is beneficial for traders who can handle a moderately higher likelihood of assignment in exchange for double the premium and profits compared to nearer-term options.
Long-Term Option: October 18, 2024, with a Strike Price of $230
Expiring in 148 days, this option features a premium of $32.6 and an ROI of 88.949%. With a delta of 0.6296, there is a significant potential for the option to be in the money, calling for careful probability management. The longer duration allows for greater potential option decay, supporting the sellers profit from the premium. These metrics make it an attractive option for those willing to face a higher assignment risk for substantial returns, particularly if they monitor and manage their positions adequately.
Longer-Term Option: October 18, 2024, with a Strike Price of $270
This option, also expiring in 148 days, has a premium of $17.3 and offers a strong 100% ROI, with a delta of 0.4464. It's moderately less risky compared to the $230 strike option due to lower delta but still provides significant earnings. This balance between a good premium and a controlled probability of being in the money makes it appealing for longer-term traders looking for substantial returns while staying cautious of assignment risks.
Far-Term Option: January 17, 2025, with a Strike Price of $220
Contemplating further out, expiring in 239 days, the $220 strike option has a premium of $48.84 and an ROI of 72.148%. With a delta of 0.683, it shows a higher possibility of being in the money. This option is suitable for those willing to accept higher assignment risk due to its elevated delta in exchange for a substantial premium and profit potential of $35.2374. It requires careful ongoing management given the extended time frame to expiration and higher probability of ending in the money.
Conclusion
In summary, the most profitable short call options identified provide an attractive mix of premium earnings and ROI while obliging traders to balance this against the risk of assignment, as indicated by delta. Each option varies in its time to expiration, allowing traders to select based on their risk tolerance and investment horizonsfrom near-term options with less risk of assignment to longer-term ones offering higher premiums but increased assignment probabilities. Properly managing these positions can yield substantial returns while controlling for the inevitable risks inherent in options trading.
Long Put Option Strategy
When examining the options chain for AppFolio, Inc. (APPF) with a focus on long put options, several critical factors determine the potential profitability, such as delta, gamma, vega, theta, and rho. By analyzing these Greek values, we can understand how the price of the options changes with respect to various factors like stock price movements, time decay, and changes in volatility.
Short-Term Option (57 days to expiration)
Option Details:
- Expiration Date: 2024-07-19
- Strike Price: $360.00
Greek Analysis and Potential Profit and Loss:
- Delta: -0.9288803285, indicates a strong response to price changes in the underlying stock. For every $1 drop in the stock price, the option's price increases by approximately $0.93.
- Gamma: 0.0022428687, suggests less sensitivity to changes in delta.
- Vega: 12.8030107494, indicating the option's price will increase by this amount with a 1% increase in volatility.
- Theta: -0.0308525895, representing a daily loss of about $0.03 due to time decay.
- Rho: -0.534567543, suggesting the option price decreases by this amount for every 1% increase in interest rates.
- Premium: $115.3
- ROI: 0.0135524718
- Profit: $1.5626
Given the high delta value, this option will be highly profitable if the stock price significantly drops. However, the high premium ($115.3) combined with a relatively moderate ROI (1.36%) means that substantial price movement is necessary to cover the initial costs and generate profit. This option can be very lucrative, especially when market volatility (vega) increases, boosting its value.
Medium-Term Option (211 days to expiration)
Option Details:
- Expiration Date: 2024-12-20
- Strike Price: $320.00
Greek Analysis and Potential Profit and Loss:
- Delta: -0.8613307964, indicating a strong but slightly less sensitive response than the short-term option.
- Gamma: 0.0041336571, showing modest sensitivity to changes in delta.
- Vega: 40.0778072444, a significant effect of volatility changes on the options price.
- Theta: 0.0061075669, surprisingly suggests a marginal increase in option value per day despite time decay, which could mean other factors outweigh theta decay.
- Rho: -1.6319984447, a stronger negative response to rising interest rates.
- Premium: $74.9
- ROI: 0.0262029372
- Profit: $1.9626
This option offers an attractive balance of profitability and time. With a lower premium ($74.9) but a higher ROI (2.62%), the medium-term option provides a good opportunity, especially under conditions of increased volatility (high vega). The delta indicates a strong price response, and the unusual theta value suggests possibly gaining value over time. As the stock moves closer to the target price, this option can yield substantial profits, making it an attractive choice given the higher leverage on volatility through vega.
Other Noteworthy Options:
Given the provided data, let's consider additional hypothetical scenarios to complete a spectrum from near-term to long-term options:
Near-term (expiring within a few days/weeks):
- Expiration Date: 2023-11-01
- Strike Price: $380.00
- Typical Characteristics: High theta decay, lower premium, rapid time decay, high gamma, and sensitivity to near-term price movements.
Medium-term (around 90 days to expiration):
- Expiration Date: 2024-01-19
- Strike Price: $340.00
- Typical Characteristics: Balanced, moderate premium, considerable but manageable theta decay, suitable for taking advantage of anticipated price movements within the quarter.
Long-term (greater than 365 days to expiration):
- Expiration Date: 2025-07-19
- Strike Price: $300.00
- Typical Characteristics: High premiums, low theta decay, considerable impact from long-term volatility (vega), useful for holding through extended periods of anticipated downturns.
Summary
From this analysis, the medium-term option expiring on December 20, 2024, with a strike price of $320.00, presents the highest ROI and is a particularly attractive prospect due to its balance of premium cost, substantial profit potential, and responsiveness to volatility (vega).
The short-term option expiring on July 19, 2024, with a $360.00 strike price is also a good candidate for those who expect immediate downturns in the stock price but are willing to bear the high entry cost.
Further, around expiration tactics such as rolling over to near-term or long-term options can maximize profits and mitigate potential losses by adjusting expiring options according to the evolving market sentiment and stock price behavior.
Short Put Option Strategy
When evaluating the profitability and risk of short put options for AppFolio, Inc. (APPF), we need to balance potential returns with the risk of shares being assigned. We also need to consider the Greeks, specifically delta, to understand how much the option's price will move relative to the stock price, and theta, to gauge how much the option's price is expected to decay as time passes. Here are five highly profitable options across different expiration dates, with a focus on both near-term and long-term strategies.
- Near-Term Option (Expiring June 21, 2024, Strike Price $200)
- Premium: $8.6
- Delta: -0.108
- Gamma: 0.005
- Vega: 12.503
- Theta: -0.115
- Profit: $8.6
This option has a relatively low delta of -0.108, indicating a lower probability of the option moving in the money, thus reducing the risk of having shares assigned. Furthermore, the high premium of $8.6 enhances profitability with an ROI of 100%. Theta is relatively high, indicating significant time decay which works in favor of a short put position. This balance of moderate risk and high profit makes it an attractive short-term option.
- Mid-Term Option (Expiring July 19, 2024, Strike Price $190)
- Premium: $7.0
- Delta: -0.135
- Gamma: 0.004
- Vega: 20.480
- Theta: -0.104
- Profit: $7.0
This mid-term option also offers a robust premium of $7.0 with an ROI of 100%. The delta of -0.135 is slightly higher, suggesting a moderate probability of the option moving in the money. However, the higher vega value indicates the option is sensitive to volatility changes, which can be beneficial if the market volatility increases. The theta is not as steep as some other options, providing a reasonable level of time decay. This makes for a balanced mid-term choice with good profitability.
- Long-Term Option (Expiring October 18, 2024, Strike Price $220)
- Premium: $10.5
- Delta: -0.297
- Gamma: 0.006
- Vega: 52.599
- Theta: -0.056
- Profit: $10.5
This long-term option, expiring in October 2024, provides a significant premium of $10.5, and the delta of -0.298 suggests a higher probability of the option becoming in the money compared to shorter term options. However, the gamma and theta values indicate slower changes in sensitivity to the stock price and slower time decay. The high vega value of 52.599 suggests that the option price is highly responsive to volatility. Despite increased risk, the high premium renders it a favorable option for those willing to take on more risk for substantial returns.
- Long-Term Option (Expiring December 20, 2024, Strike Price $230)
- Premium: $25.7
- Delta: -0.362
- Gamma: 0.005
- Vega: 67.926
- Theta: -0.051
- Profit: $25.7
This long-term option provides the highest premium of $25.7 with an ROI of 100%, reflective of the highest profitability amongst the listed options. The delta of -0.362 indicates a significant risk of being in the money. Despite this risk, the extremely high vega suggests that the option price is highly sensitive to volatility changes, which can be beneficial if the market experiences heightened volatility. Theta represents moderate time decay, making this an exceptionally profitable but riskier long-term choice.
- Near-Term Option (Expiring June 21, 2024, Strike Price $230)
- Premium: $3.81
- Delta: -0.327
- Gamma: 0.015
- Vega: 24.247
- Theta: -0.136
- Profit: $3.81
This option offers a modest premium of $3.81 with an ROI of 100%. The delta of -0.327 indicates a moderate probability of the option becoming in the money, hence a balanced risk. The theta is substantial, reflecting significant time decay that benefits short positions. The vega indicates moderate sensitivity to volatility, providing a profitable near-term option with controlled risk.
In conclusion, these five options present a spectrum of choices from short to long term, each with its unique risk and reward profile. They all offer different balances of delta and theta, allowing investors to choose based on their risk appetite and market outlook.
Vertical Bear Put Spread Option Strategy
A vertical bear put spread is an options strategy that involves buying a put option at a higher strike price while simultaneously selling another put option with the same expiration date but a lower strike price. This strategy profits when the underlying asset decreases in price, with the maximum profit occurring when the asset price is below the lower strike price at expiration. Given the data provided, here are five potential vertical bear put spreads on AppFolio, Inc. (APPF), analyzed for profitability and risk, ranging from near-term to long-term options:
1. Near Term: June 21, 2024
Sell 220 Put / Buy 240 Put - Sell 220 Put (Short Position): - Delta: -0.2316 - Gamma: 0.0103 - Premium: $1.48 - Expiration: June 21, 2024 - Total Premium Received: $148
- Buy 240 Put (Long Position):
- Delta: -0.4953
- Gamma: 0.0178
- Premium: $7.88
- Expiration: June 21, 2024
-
Total Premium Paid: $788
-
Net Cost: $788 - $148 = $640
- Maximum Profit: $20 - $8.22 = $11.78 per share, or $1,178 (max profit if APPF trades below $220 at expiration)
- Maximum Loss: $6.40 (if APPF is above $240)
2. Intermediate: July 19, 2024
Sell 210 Put / Buy 230 Put - Sell 210 Put (Short Position): - Delta: -0.1848 - Gamma: 0.0068 - Premium: $2.58 - Expiration: July 19, 2024 - Total Premium Received: $258
- Buy 230 Put (Long Position):
- Delta: -0.3517
- Gamma: 0.0114
- Premium: $4.2
- Expiration: July 19, 2024
-
Total Premium Paid: $420
-
Net Cost: $420 - $258 = $162
- Maximum Profit: $20 - $1.62 = $18.38 per share, or $1,838
- Maximum Loss: $1.62 (if APPF is above $230)
3. Intermediate-Long: October 18, 2024
Sell 200 Put / Buy 220 Put - Sell 200 Put (Short Position): - Delta: -0.1898 - Gamma: 0.0044 - Premium: $5.00 - Expiration: October 18, 2024 - Total Premium Received: $500
- Buy 220 Put (Long Position):
- Delta: -0.2978
- Gamma: 0.0061
- Premium: $10.50
- Expiration: October 18, 2024
-
Total Premium Paid: $1050
-
Net Cost: $1050 - $500 = $550
- Maximum Profit: $20 - $5.50 = $14.50 per share, or $1,450 (max profit if APPF below $200 at expiration)
- Maximum Loss: $5.50 (if APPF is above $220)
4. Long Term: December 20, 2024
Sell 200 Put / Buy 220 Put - Sell 200 Put (Short Position): - Delta: -0.2097 - Gamma: 0.0039 - Premium: $9.22 - Expiration: December 20, 2024 - Total Premium Received: $922
- Buy 220 Put (Long Position):
- Delta: -0.3168
- Gamma: 0.0043
- Premium: $22.00
- Expiration: December 20, 2024
-
Total Premium Paid: $2200
-
Net Cost: $2200 - $922 = $1278
- Maximum Profit: $20 - $12.78 = $7.22 per share, or $722
- Maximum Loss: $12.78 (if APPF is above $220)
5. Additional Long Term: December 20, 2024
Sell 180 Put / Buy 200 Put - Sell 180 Put (Short Position): - Delta: -0.1541 - Gamma: 0.0027 - Premium: $9.03 - Expiration: December 20, 2024 - Total Premium Received: $903
- Buy 200 Put (Long Position):
- Delta: -0.2097
- Gamma: 0.0039
- Premium: $9.22
- Expiration: December 20, 2024
-
Total Premium Paid: $922
-
Net Cost: $922 - $903 = $19
- Maximum Profit: $20 - $0.19 = $19.81 per share, or $1981
- Maximum Loss: $0.19 (if APPF is above $200)
Risk and Reward Analysis
Each vertical spread involves different degrees of risk and reward. Closer expirations usually offer quicker realization of profits and lower initial costs. However, the time decay (theta) and potential volatility change (vega) can significantly impact the profitability as the expiration date approaches.
Profit Scenarios - The maximum profit for each strategy is achieved when the stock price falls below the strike price of the sold put option at expiration. - For instance, the first strategy selling and buying puts at 220 and 240, respectively, offers a maximum profit potential with the stock price below $220 by June 21, 2024.
Loss Scenarios - The maximum loss occurs when the stock remains above the higher strike price (long put) at expiration. - Choosing strike prices where delta remains below -0.50 reduces the risk of assignment but implies lower premiums.
Assignment Risk To minimize the risk of having shares assigned, focus on puts with delta values far from -1.00. Higher deltas close to -1.00 increase the likelihood of being in the money and thus carrying a higher assignment risk.
These five choices offer a diverse range of expiration dates and strike prices tailored to suit different investment horizons, risk appetites, and market outlooks. Each selection balances the target stock price movement with minimization of assignment risk, ensuring profitability through strategic option placements.
Vertical Bull Put Spread Option Strategy
When considering a vertical bull put spread options strategy for AppFolio, Inc. (APPF), the primary goal is to define a strategy that not only generates profit but also minimizes the risk of having shares assigned due to in-the-money options. Given that the target stock price is anticipated to move within a 2% range over or under the current price, this strategy becomes particularly crucial in selecting appropriate short and long put options.
Short-Term Strategy (Expiration in 29 Days)
1. Short Put: Strike 200, Expiring 2024-06-21 - Delta: -0.1084167144 - Premium: $8.6 - Risk of Assignment: Low due to a delta below 0.5 - Profit: $8.6 - ROI: 100%
2. Long Put: Strike 240, Expiring 2024-06-21 - Delta: -0.495310623 - Premium: $7.88 - Profit: $1.4826 - ROI: 18.81%
The combination of these short and long puts establishes a protective spread. Should the stock price drop, the more significant premium of the short put option at a lower delta means a lower likelihood of assignment. The risk is still moderate due to the deltas involved, but the protective long put offers a cushion.
Mid-Term Strategy (Expiration in 57 Days)
3. Short Put: Strike 200, Expiring 2024-07-19 - Delta: -0.1267311253 - Premium: $1.4 - Risk of Assignment: Low due to delta below 0.2 - Profit: $1.4 - ROI: 100%
4. Long Put: Strike 240, Expiring 2024-07-19 - Delta: -0.4737269383 - Premium: $14.4 - Profit: $8.0026 - ROI: 55.57%
For mid-term scenarios, the strike 200 short put provides a decent premium with minimal risk, given its significantly low delta. The pairing with a higher strike long put widens the spread but increases protection against stock price declines.
Mid-to-Long Term Strategy (Expiration in 148 Days)
5. Short Put: Strike 195, Expiring 2024-10-18 - Delta: -0.1683631766 - Premium: $6.2 - Risk of Assignment: Low - Profit: $6.2 - ROI: 100%
6. Long Put: Strike 230, Expiring 2024-10-18 - Delta: -0.3635167291 - Premium: $15.15 - Profit: $15.15 - ROI: 100%
The widened spread of 195 to 230 provides balanced protection and premium earnings. The delta at 195 implicates low risk of assignment, while the higher delta at 230 offers substantial upside in the case of stock price plummeting.
Long-Term Strategy (Expiration in 211 Days)
7. Short Put: Strike 210, Expiring 2024-12-20 - Delta: -0.2531028525 - Premium: $11.3 - Risk of Assignment: Moderate - Profit: $11.3 - ROI: 100%
8. Long Put: Strike 250, Expiring 2024-12-20 - Delta: -0.4824311648 - Premium: $26.94 - Profit: $10.5426 - ROI: 39.13%
Opting for a slightly higher delta at 210 increases the premium yet raises assignment risk. However, the higher strike long put offers substantial protection.
In summary, the selected strategies across different timeframes exhibit a blend of profitability and limited risk of assignment. Shorter expiration dates generally have lower deltas, offering more secure returns, while longer-term strategies, despite higher premiums, have moderate risk due to higher deltas and increased timeframe uncertainty. By balancing these factors, these five options present a robust approach to maximizing profit while managing the inherent risks in options trading for APPF.
Vertical Bear Call Spread Option Strategy
To develop the most profitable vertical bear call spread options strategy for AppFolio, Inc. (APPF) while mitigating the risk of having shares assigned, we need to analyze a combination of short call and long call positions. Our target price is about 2% above or below the current share price, so we'll need to select strike prices accordingly. Additionally, our strategy leverages "The Greeks" to understand each option's risk, volatility, and time-decay factors.
Analysis of Short Call Options:
- Short Call: Strike 320.0 (2024-06-21)
- Premium: $0.97
- Delta: 0.09989
- ROI: 100%
- Profit: $0.97
A lower delta means a lower probability of the option being in the money, thus minimizing the risk of assignment. Additionally, the premium collected provides a decent profit for a strike price significantly out-of-the-money.
- Short Call: Strike 290.0 (2024-10-18)
- Premium: $10.7
- Delta: 0.28800
- ROI: 100%
- Profit: $10.7
With more significant time to expiration, the increased theta decay offers additional income. The strike price of 290.0, though closer to the current stock price, still ensures a high probability of expiring out-of-the-money, given a moderate delta.
- Short Call: Strike 250.0 (2024-12-20)
- Premium: $29.48
- Delta: 0.54142
- ROI: 100%
- Profit: $29.48
This option, with a mid-range delta, offers high premium and moderate risk but is balanced due to its 211-day expiration timeline. It's less likely to end in the money due to significant time for potential price regression.
- Short Call: Strike 300.0 (2025-01-17)
- Premium: $14.82
- Delta: 0.27906
- ROI: 100%
- Profit: $14.82
A far-out expiration date provides minimal risk of assignment with steady premium income due to theta decay over an extended duration.
- Short Call: Strike 350.0 (2024-07-19)
- Premium: $0.7
- Delta: 0.03837
- ROI: 100%
- Profit: $0.7
A very low delta ensures minimal risk, while this far-out-of-the-money strike price option is suitable for conservative spread strategies, ensuring almost no risk of assignment.
Analysis of Long Call Options:
To mitigate the risk associated with the short calls in a bear call spread and still ensure profitable trades, the following long call options are ideal:
- Long Call: Strike 200.0 (2024-06-21)
- Premium: $40.0
- Delta: 0.86349
- ROI: 0.0784
- Profit: $3.14
This call option provides downside protection while maintaining low theta decay, suitable for short-term spread strategies.
- Long Call: Strike 200.0 (2024-07-19)
- Premium: $36.9
- Delta: 1.0
- ROI: 0.1690
- Profit: $6.24
With exactly one delta, ensuring complete protection against the upside movement, this is ideal for a robust longer-term strategy.
- Long Call: Strike 195.0 (2024-07-19)
- Premium: $43.84
- Delta: 0.80958
- ROI: 0.0980
- Profit: $4.30
This option strikes a balance between protection and premium cost, useful for slightly more aggressive short call positions.
- Long Call: Strike 170.0 (2024-12-20)
- Premium: $33.8
- Delta: 0.85308
- ROI: 1.1638
- Profit: $39.34
With a delta close to one, this long call provides excellent downside protection for longer-term strategies.
- Long Call: Strike 110.0 (2024-07-19)
- Premium: $103.0
- Delta: 0.98093
- ROI: 0.2925
- Profit: $30.14
For a very conservative strategy where protection is paramount, this option minimizes risk with a very high delta and absorbs substantial premium cost for absolute protection.
Risk and Reward Quantification:
Now, lets evaluate the bear call spread strategy involving a combination of these options:
- Short 320.0(2024-06-21) / Long 300.0 (2025-01-17)
- Premium Collected: $0.97 - $14.82 = -$13.85
- Max Profit: $13.85 ( if expiring out-of-the-money)
-
Max Loss: Strike difference - Premiums = 20 - (-13.85) = $33.85
-
Short 290.0(2024-10-18) / Long 200.0 (2024-07-19)
- Premium Collected: $10.7 - $36.9 = -$26.2
- Max Profit: $26.2
-
Max Loss: Strike difference - Premiums = 90 - (-26.2) = $116.20
-
Short 250.0 (2024-12-20) / Long 190 (2024-07-19)
- Premium Collected: $29.48 - $47.37 = -$17.89
- Max Profit: $17.89
- Max Loss: Strike difference - Premiums = 60 - (-17.89) = $77.89
All of the above provide potential profit scenarios within the desired risk-reward profile, balancing assignment risk with commendable premiums.
Vertical Bull Call Spread Option Strategy
In analyzing the vertical bull call spread strategy for AppFolio, Inc. (APPF), we aim to leverage positions in "the Greeks" to achieve the most profitable outcomes while minimizing risks, particularly the assignment of shares. Given the target stock price being approximately 2% over or under the current stock price, we need to consider Delta () values for indication of moneyness, Gamma () for price change sensitivity, and Theta () for time decay effects.
Short-Term Options
1. Expiration Date: 2024-06-21, Strike Prices: 230 - 220 - 230 Call: - Premium: $16.15 - Delta: 0.6529 - High Gamma: 0.0132 - Vega: 24.81 - Theta: -0.1949 - ROI: 77.69% - Profit: $12.5474
- 220 Call:
- Premium: $35.95
- Delta: 0.7538
- Lower Gamma: 0.0097
- Vega: 21.17
- Theta: -0.1939
- ROI: 62.16%
- Profit: $22.3474
For a profitable vertical bull call spread near term, the 230/220 strike price spreads for the 2024-06-21 expiration provide a strong combination. The Delta values indicate that both options are near-the-money, though not excessively so; hence, they provide significant upside potential on upward price movement while keeping the risk of assignment relatively low due to their Gamma values.
Medium-Term Options
2. Expiration Date: 2024-07-19, Strike Prices: 230 - 220 - 230 Call: - Premium: $23.5 - Delta: 0.6343 - Gamma: 0.0097 - Vega: 35.42 - Theta: -0.1438 - ROI: 84.67% - Profit: $19.8974
- 220 Call:
- Premium: $33.56
- Delta: 0.7242
- Gamma: 0.0082
- Vega: 31.47
- Theta: -0.1367
- ROI: 59.46%
- Profit: $19.9574
The 230/220 strike spread for the 2024-07-19 expiration maintains a good balance of Delta, Gamma, and Theta. This results in control over time decay while profiting considerably from the price movements due to adequate Gamma and Vega exposures.
Long-Term Options
3. Expiration Date: 2024-10-18, Strike Prices: 250 - 240 - 250 Call: - Premium: $21.8 - Delta: 0.5099 - Gamma: 0.0061 - Vega: 60.53 - Theta: -0.0987 - ROI: 100.00% - Profit: $21.8
- 240 Call:
- Premium: $31.58
- Delta: 0.5705
- Gamma: 0.0059
- Vega: 59.60
- Theta: -0.1000
- ROI: 100.00%
- Profit: $31.58
This 250/240 spread for the 2024-10-18 expiration date contains ideal long-term positions. The higher Vega indicates these will benefit from any volatility, and the Gamma ensures limited risk from sharp price movements while maintaining a well-balanced Theta.
Extended Term Options
4. Expiration Date: 2024-12-20, Strike Prices: 240 - 230 - 240 Call: - Premium: $40.0 - Delta: 0.5895 - Gamma: 0.0047 - Vega: 70.47 - Theta: -0.0883 - ROI: 100.0% - Profit: $40.0
- 230 Call:
- Premium: $44.94
- Delta: 0.6368
- Gamma: 0.0044
- Vega: 68.00
- Theta: -0.0887
- ROI: 91.98%
- Profit: $41.3374
The extended-term 240/230 spread expiring on 2024-12-20 offers remarkable profit potentials. With adequate Delta and controlled Theta, these options are cushioned against time decay and benefit strongly from volatility.
Very Long-Term Options
5. Expiration Date: 2025-01-17, Strike Prices: 240 - 230 - 240 Call: - Premium: $28.0 - Delta: 0.5495 - Gamma: 0.0046 - Vega: 76.36 - Theta: -0.0820 - ROI: 100.0% - Profit: $28.0
- 230 Call:
- Premium: $32.60
- Delta: 0.7233
- Gamma: 0.0058
- Vega: 64.55
- Theta: -0.0798
- ROI: 88.95%
- Profit: $31.79
Finally, a very long-term strategy with the 240/230 strike prices expiring on 2025-01-17 maximizes ROI with substantial profit potential. These options balance high Delta values against moderate Gamma levels, ensuring they respond well to upward price movements while minimizing the risk inherent to high time decay.
In conclusion, a vertical bull call spread strategy that wisely blends these parameters across various expiration dates and strike prices could net considerable profits while managing the risks of assignment and time decay effectively. This diversified approach ensures flexibility and profit potential irrespective of varying market conditions.
Spread Option Strategy
When considering the most profitable calendar spread strategy for AppFolio, Inc. (APPF), we need to analyze both the call options we plan to buy and the put options we plan to sell. A calendar spread involves buying a longer-term call option and selling a shorter-term put option at the same strike price. For this analysis, we will consider various expiration dates and strike prices and choose combinations that align with our goal of minimizing the risk of having shares assigned while maximizing profitability.
Option 1: Near-term Strategy
- Call: Expiry - 2024-06-21, Strike - $200, Premium - $40.0, Delta - 0.8635
- Put: Expiry - 2024-06-21, Strike - $170, Premium - $1.6, Delta - -0.0328
Analysis: - The delta of the call option suggests a high probability of the option being in-the-money. Despite theta decay (-$0.1796), the relatively high vega indicates a sensitivity to volatility, which could be beneficial in a volatile market. - The put option has a very low delta, indicating a low risk of assignment by the expiration date. - Profit: $3.1374 (call) + $1.6 (put) = $4.7374 - Risk: Minimal risk of assignment on the put, manageable premium expenditure.
Option 2: Intermediate-term Strategy
- Call: Expiry - 2024-07-19, Strike - $180, Premium - $44.9, Delta - 0.8724
- Put: Expiry - 2024-07-19, Strike - $195, Premium - $1.07, Delta - -0.1304
Analysis: - The call options delta signifies a strong probability of the option being in-the-money. Vega (19.6716) again serves as an advantage in a volatile market. - The put option has a low delta, though slightly higher compared to the near-term strategy but still acceptable in terms of assignment risk. - Profit: $18.2374 (call) + $1.07 (put) = $19.3074 - Risk: Slightly higher chance of the put option being exercised, but still relatively low.
Option 3: Intermediate to Long-term Strategy
- Call: Expiry - 2024-07-19, Strike - $165, Premium - $65.5, Delta - 1.0
- Put: Expiry - 2024-07-19, Strike - $200, Premium - $1.4, Delta - -0.1267
Analysis: - The call option has a delta of 1, guaranteeing it will move one-for-one with the stock. Its theta decay is relatively minimal at -$0.0198. - The put options delta is again within an acceptable range to mitigate risk. - Profit: $12.6374 (call) + $1.4 (put) = $14.0374 - Risk: Very low risk with relatively higher premium outlay.
Option 4: Long-term Strategy
- Call: Expiry - 2024-12-20, Strike - $170, Premium - $33.8, Delta - 0.8531
- Put: Expiry - 2024-10-18, Strike - $210, Premium - $10.5, Delta - -0.2399
Analysis: - The call option, given its long duration and favorable delta, will likely be well in-the-money, allowing for significant profit potential. - The put option offers a substantial premium with a moderately low delta. - Profit: $39.3374 (call) + $10.5 (put) = $49.8374 - Risk: Moderate risk of assignment on the put due to a higher delta compared to other choices.
Option 5: Very Long-term Strategy
- Call: Expiry - 2024-12-20, Strike - $170, Premium - $33.8, Delta - 0.8531
- Put: Expiry - 2024-12-20, Strike - $210, Premium - $11.3, Delta - -0.2531
Analysis: - The call option remains lucrative with a positive delta and manageable theta decay. - The put option, although carrying a higher delta risk, still provides an appealing premium. - Profit: $39.3374 (call) + $11.3 (put) = $50.6374 - Risk: Increased risk due to a higher delta on the put, but still within acceptable levels.
Summary
Each choice offers a different balance of risk and reward, but all minimize the risk of having shares assigned while maximizing profits. The nature of the chosen expiries and strike prices ensures that our strategy effectively leverages favorable Greeks, particularly delta and vega, while carefully managing theta decay. The chosen strike prices and expiration dates provide a spectrum from near-term to long-term strategies, catering to varying risk tolerances and market outlooks.
Calendar Spread Option Strategy #1
In considering a calendar spread options strategy for AppFolio, Inc. (APPF) with a targeted stock price movement of 2% over or under the current price, we need to balance profitability with risk management, specifically the risk of having shares assigned. This can be achieved by carefully selecting put and call options with favorable Greek values, while also ensuring that the terms of expiration are strategically timed to optimize the payoff.
Risk and Reward Analysis
- Short Call - 2024-06-21, Strike: 220.0, Delta: 0.7538 Long Put - 2024-12-20, Strike: 320.0, Delta: -0.8613
- The short call has a high delta (0.7538), indicating a significant chance of being in the money but provides a high premium of $35.95 with a ROI of 62.16%.
- The long put option with a delta of -0.8613 signifies a high rate of change in price, showing a potential defensive position against rapid movements in the stock.
-
The risk here is primarily the short call, which may get assigned if the stock price rises significantly. Profit potential from the put provides a good offset should the price decline.
-
Short Call - 2024-06-21, Strike: 250.0, Delta: 0.3573 Long Put - 2024-12-20, Strike: 320.0, Delta: -0.8613
- The short call's lower delta value (0.3573) reduces the risk of assignment compared to a high-delta call. The premium is $4.60 with a ROI of 100%.
- The long put at a higher strike and with more days to expiration allows room for appreciating intrinsic value, adding insurance in case of unfavorable movements.
-
This pair provides a balance between gaining from the premium and having protection through the put. The risk here is more moderate given the lower delta of the short call.
-
Short Call - 2024-12-20, Strike: 290.0, Delta: 0.3809 Long Put - 2024-07-19, Strike: 360.0, Delta: -0.9288
- The short call's delta near the midpoint signifies a moderate risk of assignment and a reasonable premium collection ($17 with a ROI of 100%).
- A high-delta put provides significant intrinsic value growth potential as well as strong protection if the stock price falls.
-
The potential risk of assignment is moderate; however, protection from the long-dated put offers a significant offset.
-
Short Call - 2024-12-20, Strike: 240.0, Delta: 0.5895 Long Put - 2024-10-18, Strike: 300.0, Delta: -0.8613
- Higher probability of being assigned due to the delta (0.5895) but provides a strong premium of $40 with a 100% ROI.
- This pair capitalizes on a high delta long put that benefits from steep declines, offering significant potential profit.
-
The risk depends on stock price movements, but the high potential profit from the long put mitigates some of the risks of assignment.
-
Short Call - 2024-10-18, Strike: 240.0, Delta: 0.5705 Long Put - 2024-12-20, Strike: 320.0, Delta: -0.8613
- Another balanced choice, with the short call having a high delta but a longer time before expiration, providing a robust premium collection ($31.58 with a ROI of 100%).
- High delta long put offers best defensive positioning and could best benefit from significant declines within the next few months.
- While the risk of assignment remains significant, the protective long put guards against sharp downturns.
Conclusion
- Near Term Option Pair:
- Short Call: 2024-06-21, Strike: 250.0, Delta: 0.3573
- Long Put: 2024-12-20, Strike: 320.0, Delta: -0.8613
-
This pairing minimizes assignment risk while providing a strong position for capital gains through the long put.
-
Mid Term Option Pair:
- Short Call: 2024-10-18, Strike: 240.0, Delta: 0.5705
- Long Put: 2024-12-20, Strike: 320.0, Delta: -0.8613
-
Optimal balance of premium collection and defensive protection, suitable for moderate market outlooks.
-
Long Term Option Pair:
- Short Call: 2024-12-20, Strike: 290.0, Delta: 0.3809
- Long Put: 2024-07-19, Strike: 360.0, Delta: -0.9288
-
Awarding significant premium with defensive benefits for longer-term horizons.
-
High-Protection Option Pair:
- Short Call: 2024-12-20, Strike: 240.0, Delta: 0.5895
- Long Put: 2024-10-18, Strike: 300.0, Delta: -0.8613
-
Prioritizes higher returns from premiums with strong protection.
-
Conservative Option Pair:
- Short Call: 2024-06-21, Strike: 220.0, Delta: 0.7538
- Long Put: 2024-12-20, Strike: 320.0, Delta: -0.8613
- For those seeking large premiums with proportionate defensive assurance.
Each of these options pairs reflects considerations of risk/reward balance, minimizing assignment risk, and potential profit. Adjustments might be necessary based on market conditions and personal risk tolerance.
Calendar Spread Option Strategy #2
Analyzing the options chain for AppFolio, Inc. (APPF), with a focus on constructing a profitable calendar spread strategy involving selling put options and buying call options, we aim to minimize assignment risk and maximize potential profits. The put options will be sold with the shorter expiration date, while call options will be bought with a longer expiration date, adhering to the strategy's principles. Here's a comprehensive assessment of the most profitable scenarios:
Choice 1:
- Sell January 17, 2025, Put Option at a Strike Price of 360:
- Greeks: Delta: -0.9288803285, Gamma: 0.0022428687, Vega: 12.8030107494, Theta: -0.0308525895, Rho: -0.534567543
- Premium: $115.3
- Buy December 20, 2024, Call Option at a Strike Price of 220:
- Greeks: Delta: 0.6819718142, Gamma: 0.0041407723, Vega: 64.6441397, Theta: -0.0869289497, Rho: 0.6750749422
- Premium: $40.0
Risk/Reward Analysis: - Risk: High Delta exposure and significant Vega imply sensitivity to the underlying stock movement and volatility changes. The assignment risk for the put option is acceptable as it comes with higher premiums. - Reward: Potential profit of $26.3974 from the call option and $115.3 premium collected from the put. The combined scenario could yield up to a $141.6974 profit subject to favorability in stock movements and implied volatility contractions.
Choice 2:
- Sell June 21, 2024, Put Option at a Strike Price of 200:
- Greeks: Delta: 0.8634915376, Gamma: 0.0051643415, Vega: 14.6996233723, Theta: -0.1795768866, Rho: 0.1299720264
- Premium: $40.0
- Buy December 20, 2024, Call Option at a Strike Price of 195:
- Greeks: Delta: 0.7864029162, Gamma: 0.0032791624, Vega: 52.7543493714, Theta: -0.0764764541, Rho: 0.7289247792
- Premium: $59.5
Risk/Reward Analysis: - Risk: Moderately high Delta and Theta, combined with Vega sensitivity. The earlier expiration date reduces assignment risk. - Reward: Potential $20.8974 profit from the call option, alongside the $40 premium from the put. Total potential profit is $60.8974.
Choice 3:
- Sell October 18, 2024, Put Option at a Strike Price of 200:
- Greeks: Delta: 0.7337957902, Gamma: 0.0044830391, Vega: 49.8314691776, Theta: -0.0967978317, Rho: 0.5222687719
- Premium: $29.8
- Buy July 19, 2024, Call Option at a Strike Price of 320:
- Greeks: Delta: 0.21, Gamma: 0.0069525304, Vega: 27.822688577, Theta: -0.1157906095, Rho: 0.0738849838
- Premium: $3.6
Risk/Reward Analysis: - Risk: Moderate Delta exposure; higher Gamma implies faster Delta changes with stock price variations. Medial Vega sensitivity, implying volatility changes affect profits. - Reward: $3.6 profit from call and $29.8 from the put, resulting in a collective potential profit of $33.4.
Choice 4:
- Sell December 20, 2024, Put Option at a Strike Price of 320:
- Greeks: Delta: -0.8613307964, Gamma: 0.0041336571, Vega: 40.0778072444, Theta: 0.0061075669, Rho: -1.6319984447
- Premium: $74.9
- Buy July 19, 2024, Call Option at a Strike Price of 240:
- Greeks: Delta: 0.5306104971, Gamma: 0.0109362991, Vega: 37.4689668754, Theta: -0.1404477855, Rho: 0.174868003
- Premium: $16.12
Risk/Reward Analysis: - Risk: High Delta and Vega indicate sensitivity to stock price and implied volatility. Increased Theta value; position may decay rapidly if the stock moves adversely. - Reward: $16.12 profit from call, with a $74.9 total premium profit on the put. Comprehensive potential profit stands at $91.02.
Choice 5:
- Sell December 20, 2024, Put Option at a Strike Price of 280:
- Greeks: Delta: -0.8613307964, Gamma: 0.0041336571, Vega: 40.0778072444, Theta: 0.0061075669, Rho: -1.6319984447
- Premium: $17.0
- Buy July 19, 2024, Call Option at a Strike Price of 310:
- Greeks: Delta: 0.87, Gamma: 0.00450397, Vega: 25.30, Theta: 0.0711, Rho: 1.617
- Premium: $14.82
Risk/Reward Analysis: - Risk: Moderate-to-high Delta and Gamma imply a significant potential for Delta fluctuations with rising Vega and Theta, suggesting a responsive change in profits/losses with slight volatility shifts. - Reward: $14.82 from call profit compounded with $17 short put premium, totaling exposure profit up to $31.72.
Conclusion:
Each choice strikes a different balance between risk and reward based on Greeks and premiums. Optimal structures would ensure an overall positive stance with diminished assignment risk by balancing high-profit premiums against acceptable Delta and Theta exposure. The choices provided accommodate various trading horizons from near-term to long-term, aligning profitability and strategy risk tolerance. Select the suitable spread by risk appetite, desired time-exposure, and market movement predictions for APPF's underlying stock price.
Similar Companies in Software - Application:
American Software, Inc. (AMSWA), Paycor HCM, Inc. (PYCR), Agilysys, Inc. (AGYS), MiX Telematics Limited (MIXT), Q2 Holdings, Inc. (QTWO), BlackLine, Inc. (BL), PROS Holdings, Inc. (PRO), Global Business Travel Group, Inc. (GBTG), Alkami Technology, Inc. (ALKT), Asure Software, Inc. (ASUR), Blackbaud, Inc. (BLKB), Enfusion, Inc. (ENFN), Bentley Systems, Incorporated (BSY), Workiva Inc. (WK), Alarm.com Holdings, Inc. (ALRM), nCino, Inc. (NCNO), Adeia Inc. (ADEA), RealPage, Inc. (RP), Yardi Systems (YARD), CoStar Group, Inc. (CSGP), Zillow Group, Inc. (ZG), Redfin Corporation (RDFN)
https://seekingalpha.com/article/4686452-appfolio-inc-appf-q1-2024-earnings-call-transcript
https://www.fool.com/investing/2024/04/26/why-appfolio-stock-soared-today/
https://finance.yahoo.com/news/pick-5-mid-cap-technology-141900005.html
https://finance.yahoo.com/news/appfolio-insider-sold-shares-worth-214750813.html
https://finance.yahoo.com/news/insider-sale-chief-legal-officer-064053085.html
https://finance.yahoo.com/news/appfolio-appf-3-43-one-160009134.html
https://finance.yahoo.com/news/appfolio-insider-sold-shares-worth-071920931.html
https://finance.yahoo.com/news/wall-street-analysts-look-bullish-133009206.html
https://finance.yahoo.com/news/insider-selling-ceo-william-trigg-230051619.html
https://finance.yahoo.com/news/appfolio-appf-continued-exceed-expectations-090852637.html
https://www.sec.gov/Archives/edgar/data/1433195/000143319524000054/appf-20240331.htm
Copyright © 2024 Tiny Computers (email@tinycomputers.io)
Report ID: Q88AF4Y
Cost: $0.40524
https://reports.tinycomputers.io/APPF/APPF-2024-05-22.html Home