Ardmore Shipping Corporation (ticker: ASC)
2024-02-12
 Ardmore Shipping Corporation, operating under the ticker ASC, is a noteworthy entity in the global maritime sector, particularly specialized in the transportation of petroleum products and chemicals. Established with a focus on offering flexible and efficient services, Ardmore operates a fleet of medium-range (MR) tankers, which are pivotal in international trade routes, serving both major oil companies and chemical producers. The corporation's strategic emphasis on maintaining a modern, eco-friendly fleet not only aligns with global environmental standards but also ensures operational efficiency and cost-effectiveness, which are critical in the competitive shipping industry. Financially, ASC is known for its robust balance sheet, prudent management strategy, and a commitment to returning value to shareholders, making it a potentially compelling consideration for investors interested in the maritime shipping sector. The significance of Ardmore Shipping Corporation within the industry is underscored by its adaptability to market dynamics, commitment to sustainability, and its role in the global supply chain, positioning it as a key player amidst the evolving demands of international trade and environmental compliance.
| Full Time Employees | 56 | Previous Close | 15.95 | Open | 15.92 |
| Day Low | 15.81 | Day High | 16.03 | Dividend Rate | 1.15 |
| Dividend Yield | 0.0719 | Payout Ratio | 0.292 | Beta | 0.407 |
| Trailing PE | 4.72 | Forward PE | 5.39 | Volume | 605,019 |
| Average Volume | 708,616 | Average Volume 10 days | 758,860 | Bid | 15.95 |
| Ask | 16.2 | Bid Size | 1,000 | Ask Size | 900 |
| Market Cap | 660,780,800 | Fifty Two Week Low | 11.59 | Fifty Two Week High | 19.41 |
| Price To Sales Trailing 12 Months | 1.54 | Fifty Day Average | 14.909 | Two Hundred Day Average | 13.4124 |
| Trailing Annual Dividend Rate | 1.15 | Trailing Annual Dividend Yield | 0.0721 | Currency | USD |
| Enterprise Value | 749,769,024 | Profit Margins | 0.334 | Float Shares | 34,979,840 |
| Shares Outstanding | 41,298,800 | Shares Short | 1,107,864 | Held Percent Insiders | 0.15289 |
| Held Percent Institutions | 0.63534 | Short Ratio | 1.43 | Short Percent of Float | 0.0268 |
| Book Value | 12.519 | Price To Book | 1.278 | Net Income To Common | 140,335,008 |
| Trailing EPS | 3.39 | Forward EPS | 2.97 | Total Cash | 50,760,000 |
| Total Cash Per Share | 1.229 | EBITDA | 184,471,008 | Total Debt | 102,702,000 |
| Quick Ratio | 2.385 | Current Ratio | 2.896 | Total Revenue | 429,929,984 |
| Debt To Equity | 18.535 | Revenue Per Share | 10.496 | Return On Assets | 0.13912 |
| Return On Equity | 0.28535 | Free Cashflow | 128,738,000 | Operating Cashflow | 201,607,008 |
| Revenue Growth | -0.39 | Gross Margins | 0.4869 | EBITDA Margins | 0.4291 |
| Sharpe Ratio | 0.19613562343967486 | Sortino Ratio | 3.009273961591773 |
| Treynor Ratio | 0.10064480324015247 | Calmar Ratio | 0.12177189826241461 |
Analyzing the recent technical indicators, fundamentals, and balance sheet data for ASC, it becomes clear that the companys stock showcases an intriguing investment prospect with varied indicators suggesting bullish trends while acknowledging inherent risks.
The technical analysis, particularly the noteworthy ascent seen in the OBV (On Balance Volume) from 0.06815 to 0.57146 million in a span of few months, depicts a robust buying pressure surpassing any selling momentum. While initially, the MACD (Moving Average Convergence Divergence) histogram values were not provided, towards the end of the observed period, a shift from positive 0.013366 to negative -0.080646 was recorded. Although this might hint at potential short-term bearish momentum, it is paramount to analyze this in conjunction with other metrics and company fundamentals.
The Sharpe, Sortino, Treynor, and Calmar ratios provide a multifaceted view on the risk-adjusted performance of the company's stock. A Sharpe Ratio of approximately 0.196 implies that the investment offers a modest return above the risk-free rate for every unit of volatility risk assumed by the investor, indicating an acceptable but not outstanding performance. Meanwhile, the Sortino Ratio at 3.009 mirrors a more favorable scenario for risk-adjusted returns, mainly because this metric focuses solely on downside, rather than overall volatility. The Treynor and Calmar ratios, though offering lower values than the Sortino, still suggest positive risk-adjusted returns, with Calmar providing a reassuring outlook on return stability in relation to maximum drawdowns experienced.
Delving into the company's fundamentals and balance sheet underscores a solid business structure. Substantial Gross (48.691%), EBITDA (42.907%), and Operating (27.586%) margins exhibit healthy profitability levels. Moreover, a robust cash flow and a strong balance sheet with notable working capital signal operational efficiency and financial resilience. The Altman Z-Score of 4.6148 and a Piotroski Score of 7 further affirm financial stability and low bankruptcy risk.
The earnings estimate trajectory anticipates EPS growth, from average estimates for the current year significantly rising to the next (2024). Analyst expectations, indicating an EPS increase, coupled with a 42.64% estimated five-year growth rate, provides a bullish outlook on the companys potential for sustained growth and profitability.
ASCs stock movement in the coming months will likely benefit from these fundamentals, while the technical indicators, despite the recent MACD bearish signal, suggest a broader positive sentiment when viewed through OBV's increase indicating buying interest. The blend of improving analyst sentiment, favorable growth estimates, and solid risk-adjusted performance metrics foregrounds an optimistic view. However, investors should remain vigilant of macroeconomic factors and market conditions that could affect stock performance.
In summation, the comprehensive evaluation reveals that ASC's stock is poised for potential appreciation influenced by solid fundamentals, strong financial health, and effectively managed operational capabilities. The observed data suggests a bullish outlook in the medium to long term, albeit with a customary caution applied to short-term volatility and external market pressures.
In our analysis of Ardmore Shipping Corporation (ASC), we've applied the principles outlined in "The Little Book That Still Beats the Market" to evaluate the company's financial health and investment potential. A critical look at ASC's return on capital (ROC) reveals a remarkable figure of 23.84%. This high ROC indicates that Ardmore Shipping Corporation is efficiently utilizing its capital to generate profits, which is a strong indicator of the company's operational efficiency and potential for long-term growth. Additionally, the earnings yield for ASC stands at 22.69%, an exceptionally high value that signifies the company's ability to generate earnings relative to its share price. This high earnings yield suggests that ASC is undervalued at its current market price, making it an attractive investment opportunity. Together, these metrics underscore Ardmore Shipping Corporation's strong financial performance and potential for delivering substantial returns to investors.
In examining Ardmore Shipping Corporation (ASC) through the lens of Benjamin Graham's value investing criteria, we find a mixed assessment when comparing the company's key financial metrics to Graham's principles. Let's delve into how ASC measures up against each criterion:
-
Price-to-Earnings (P/E) Ratio: Ardmore Shipping Corporation has a P/E ratio of 20.25. Graham typically sought companies with low P/E ratios that were lower than the overall market or their industry peers. Since the industry P/E ratio was not provided, we cannot directly compare ASC's P/E ratio to its peers. However, a P/E ratio of around 20.25 lies on the higher end of what Graham might consider acceptable, preferring P/E ratios in the lower range to indicate undervaluation. This might raise concerns about whether ASC is currently trading at a price that offers a sufficient margin of safety, which is a core tenet of Graham's philosophy.
-
Price-to-Book (P/B) Ratio: The P/B ratio for ASC stands at 0.91. This is a favorable metric according to Graham's criteria, as he often looked for stocks trading below their book value (a P/B ratio of less than 1). This suggests that ASC could potentially offer a margin of safety for investors, as its market price is less than its book value, indicating potential undervaluation.
-
Debt-to-Equity Ratio: ASC's debt-to-equity ratio is 0.36, which aligns well with Graham's preference for companies with low levels of debt. A lower debt-to-equity ratio implies lower financial risk, suggesting that ASC has a relatively conservative capital structure which Graham would view favorably.
-
Current and Quick Ratios: Both the current and quick ratios for ASC are 2.98, indicating excellent short-term financial health. This surpasses Graham's criteria for financial stability, as it demonstrates ASC's ability to cover its short-term liabilities more than twice over with its short-term assets. This level of liquidity is a positive sign of financial prudence.
-
Earnings Growth: While specific figures detailing ASC's earnings growth over the years were not provided, Grahams methodology emphasizes the importance of consistent earnings growth as a sign of a company's stable and potentially undervalued nature. Investors would need to assess ASC's track record of earnings growth to fully evaluate its performance against Grahams criteria in this area.
In summary, Ardmore Shipping Corporation demonstrates promising signs of meeting Benjamin Graham's investment criteria in several areas, notably through its favorable P/B ratio, conservative debt-to-equity ratio, and excellent liquidity as evidenced by its current and quick ratios. However, the P/E ratio suggests that the stock might not currently offer the margin of safety Graham would typically advocate for. Therefore, while ASC exhibits several characteristics of a stable and potentially undervalued company, investors following Graham's methods should conduct a comprehensive analysis, including earnings growth trends and industry comparisons, to make an informed investment decision regarding Ardmore Shipping Corporation.Analyzing Financial Statements
In evaluating the financial health and potential investment value of Ardmore Shipping Corp (ASC) through the years from 2015 to 2022, our report focuses on analyzing key elements of the company's financial statements: the balance sheet, income statement, and cash flow statements. This analysis seeks to illuminate trends, strengths, and weaknesses in the company's fiscal positioning, providing insights into its stability, profitability, and growth potential.
-
Revenue Growth:
- Ardmore Shipping Corp has seen fluctuations in its revenue over the analyzed period. A significant revenue spike observed in 2016 ($17,498,550) was followed by a notable decline the following year. However, the company managed to substantially increase its net income by the end of 2015 ($31,954,965), showcasing potential volatility in earnings against the backdrop of industry and global economic factors.
-
Asset Management:
- The companys assets saw a notable increase from $778,197,608 in 2015 to $883,642,723 by the end of 2016, emphasizing growth in property, plant, and equipment - a critical indicator of investment in future capacity. However, the value attached to vessels held for sale also underscores a strategic reconfiguration of operational assets.
-
Liabilities and Equity:
- Although total liabilities increased, signifying higher borrowings, the equity changes reveal strategic maneuvers in share repurchases and dividends, impacting stockholder equity. These decisions reflect on the balance between leveraging for growth and returning value to shareholders.
-
Cash Flow Consideration:
- Cash flow activities throughout the period highlight significant investments in acquiring machinery and equipment and repayment of long-term debt, emphasizing the company's focus on augmenting operational capacity while managing debt obligations. Operating cash flows exhibited stability, indicating adept operational management to sustain liquidity.
-
Expenses Management:
- Operating expenses, including vessel operating expenses and depreciation, account for a substantial portion of the revenue, underscoring the capital-intensive nature of the shipping industry. The company's ability to manage these expenses directly correlates with its profitability margins.
-
Debt and Solvency:
- Long-term debt management reflects the companys strategy to finance growth while maintaining solvency. The evolving debt structure, marked by both increases and strategic repayments, points to a dynamic approach to leveraging and solvency management.
-
Profitability and Income:
- The companys earnings before taxes and net income over the years highlight its ability to navigate the operational and financial challenges peculiar to the shipping industry. The remarkable net income recovery in 2015, despite revenues not being exceptionally high, indicates efficient cost management and operational efficiency.
Conclusion: Ardmore Shipping Corp's financial trajectory from 2015 to 2022 illustrates a company positioning itself for sustainable growth amidst industry volatility. Its strategic asset management, coupled with an acute focus on balancing growth investments with shareholder return, presents a nuanced picture of its financial health. Future investment considerations should weigh the potential for revenue growth against the backdrop of industry cyclicality, asset reconfigurations, and the companys agility in managing operational costs and debt.Based on Benjamin Graham's principles from "The Intelligent Investor," analyzing a company's dividend record is pivotal in assessing its suitability for investment. Graham emphasized the importance of a company having a consistent history of paying dividends as it reflects stability and a commitment to returning value to shareholders.
Considering the provided dividend history for the symbol 'ASC', the company has demonstrated a consistent pattern of dividend payouts extending from 2013 through to the latest entry in 2023. The dividend amounts, while varying, show an overall trend of maintenance or increase over time, which is a positive indicator under Graham's investing philosophy. Specifically, dividends have been paid out consistently across years, with noticeable adjustments in the dividend amounts:
- An initial lower dividend in 2013, with a payout of $0.066.
- Variation in dividend amounts across the years, with a notable increase, for example, from $0.1 in early 2014 up to $0.45 in February 2023.
- Following the lowest point listed in 2013, there has been an overall upward movement in the dividend amounts, despite some fluctuations.
This track record suggests a company that has not only committed to returning profits to its shareholders but has also grown or maintained its ability to do so in different market conditions over a decade. This is indicative of the financial health and operational stability that Graham valued.
To investors following Graham's principles, these signs may warrant further investigation into the company's fundamentals, valuing not only its ability to pay dividends but also its financial health, earnings stability, and growth prospects to ensure it aligns with the criteria of a prudent investment.
| Statistic Name | Statistic Value |
| Alpha | 0.1075 |
| Beta | 0.9185 |
| R-squared | 0.103 |
| Adjusted R-squared | 0.102 |
| F-statistic | 143.4 |
| Prob (F-statistic) | 2.25e-31 |
| No. Observations | 1,256 |
| AIC | 6,770 |
| BIC | 6,780 |
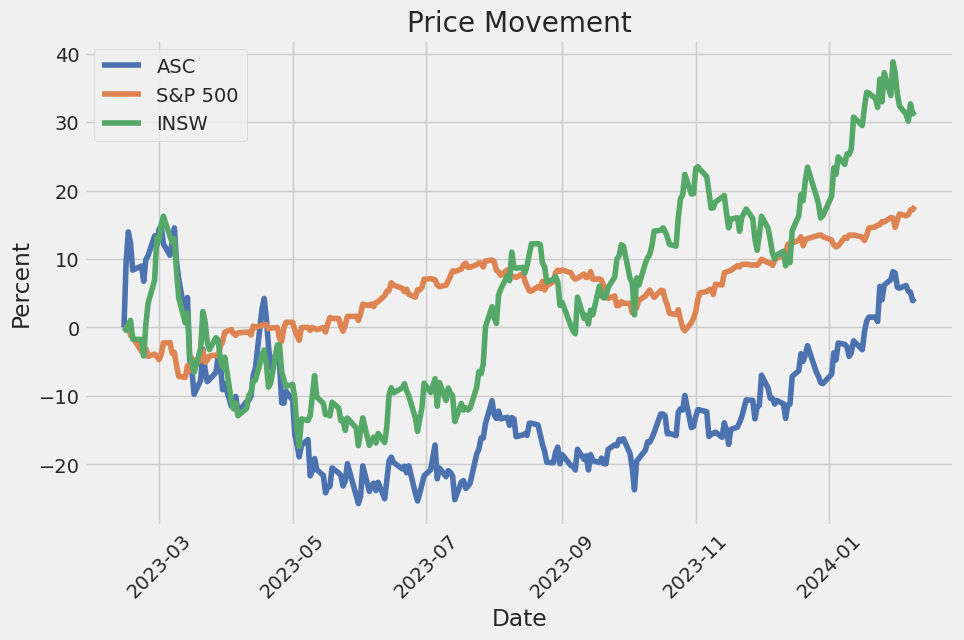
In the analysis of the relationship between ASC (presumed to be a specific security or stock) and SPY (which represents the entire market, commonly tracked through the S&P 500 index), a linear regression model reveals significant insights. The model indicates a positive relationship between ASC and SPY, as indicated by the positive beta coefficient (0.9185), suggesting that ASC generally moves in the same direction as the market but with less volatility. This is consistent with the concept that stocks with a beta less than 1 are less volatile than the market. However, the R-squared value of 0.103 implies that only a small portion of ASC's movements can be explained by movements in the SPY, indicating other factors are at play in ASC's price movements that are not captured by this model.
The alpha value of 0.1075 suggests that ASC has a theoretical return of 10.75% above the return predicted by the linear relationship with SPY, after adjusting for the market's movements. In financial terms, alpha represents the excess return of a security relative to the return of the benchmark index. A positive alpha is often seen as an indicator that the security is outperforming the market, after taking into account its inherent risk (as measured by beta). However, it is also critical to consider the confidence intervals and the statistical significance of the alpha. In this case, the p-value for alpha is 0.288, which suggests that the alpha is not statistically significant at common confidence levels, indicating caution should be taken when interpreting this as evidence of superior performance.
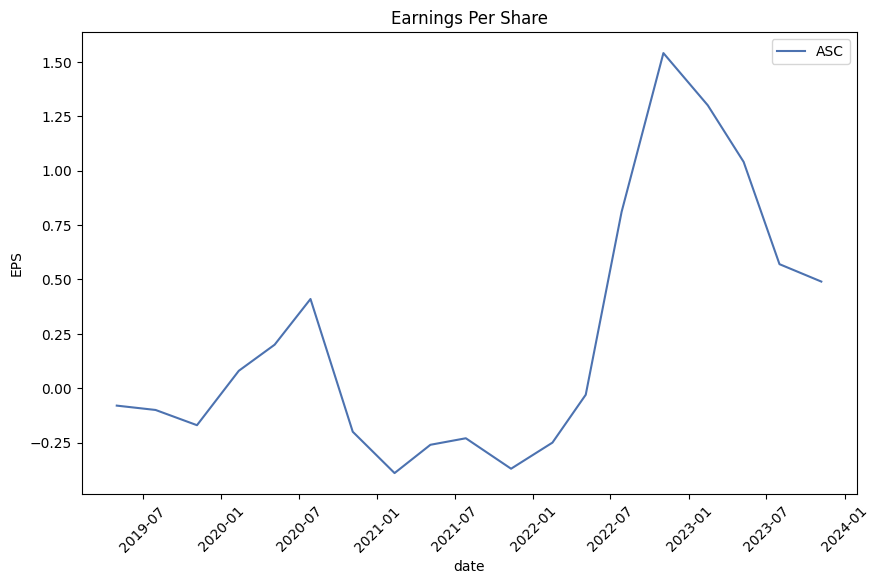
Ardmore Shipping Corporation (ASC) held its Third Quarter 2023 Earnings Conference Call, announcing strong performances and financial results. CEO Anthony Gurnee and CFO Bart Kelleher led the discussions, emphasizing the company's robust adjusted earnings of $20.3 million or $0.49 per share. This performance was attributed to the strengthening markets for product and chemical tankers, with significant contributions from MR tankers and chemical tankers which saw daily earnings increase in the third and into the fourth quarter. Gurnee highlighted the companys strategic positioning at a market inflection point, benefitting from broad strength across the tanker sectors, and the execution of its capital allocation policy including a quarterly cash dividend of $0.16 per share.
The company detailed the implications of external factors such as the EU refined products embargo and the persistent low global refined product inventory levels, both of which have bolstered the demand for tanker transport services. As the winter season draws near, weather-related delays and restrictions are expected to further buoy the market. With refinery maintenance levels predicted to decline, Ardmore anticipates an increase in product tanker demand. The presentation underscored the positive market outlook, buoyed by reduced Panama Canal transits and the upcoming EU Emissions Trading System implementation, poised to sustain high Tanker Charter Equivalent (TCE) rates.
Ardmore's strategic initiatives include investing in energy-saving devices and optimizing its fleet's performance to enhance cash flow while reducing carbon emissions. The company's long-term capital allocation policy remains focused on fleet maintenance, low leverage, disciplined growth evaluation, and shareholder capital return. The strong financial position enables simultaneous pursuit of these objectives, with the potential for higher earnings and dividends in the coming quarters. Ardmore attributes its financial strength to effective cost management and a competitive breakeven level, positioning the company well for capitalizing on market opportunities.
In conclusion, Gurnee summarized the optimistic outlook for Ardmore Shipping, emphasizing the sustained high TCE rates bolstered by near-term market drivers and the wide gap between tanker supply and demand expected to support the market for the next few years. Ardmore's investment in fleet improvement and carbon emission reduction, alongside its strong balance sheet and low breakeven point, underscore the company's strategic positioning for growth and profitability amid an evolving market landscape. The Q&A session underscored Ardmore's commitment to value-focused decisions regarding fleet expansion and enhancements, with a keen eye on the evolving market conditions and new building prices.
Ardmore Shipping Corporation stands at a crossroads in its financial narrative as it navigates through the volatile waters of the global shipping industry. As a player in the marine transportation of chemical and crude oil products, Ardmore's position is significantly influenced by a myriad of factors, including geopolitical tensions, shifts in global trade dynamics, and evolving environmental regulations. This comprehensive examination seeks to unravel the layers of Ardmore's operational and financial health, strategic positioning, and future outlook against the backdrop of an industry prone to abrupt changes.
With a fleet of 22 vessels, Ardmore has carved out a niche in the transportation of petroleum products and chemicals worldwide. The appeal of Ardmore to investors is multifaceted, highlighted by its commitment to delivering a strong dividend yield, approximately 7% annually, a testament to its financial strategies aimed at maximizing shareholder value. Despite experiencing a reduction in revenue and net income as highlighted in its third-quarter earnings report, the company's agility in surmounting industry hurdles remains evident. This includes navigation through the geopolitical strife affecting shipping lanes, especially around the Red Sea, which, while presenting challenges, also opens avenues for revenue enhancement through potential increases in spot prices amid heightened shipping costs.
The global shipping crisis, intensified by the actions of Iran-backed Houthi rebels, underscores a crucial aspect of Ardmore's operating environment. The disruption in shipping routes and the consequent diversions significantly impact operational costs and logistics. However, Ardmore's response to these challenges, including opting for longer routes that, albeit more costly, prioritize crew safety and cargo integrity, reveals a strategic approach that balances immediate financial impacts with long-term operational sustainability and corporate responsibility.
Ardmore's upcoming 2024 Investor Day presents an invaluable opportunity for the company to elaborate on its strategies amidst these turbulent times. Slated for February, this event is poised to offer profound insights into Ardmore's navigation through the global product and chemical tanker markets. Key discussions will likely encompass supply and demand dynamics, the impact of geopolitical and environmental factors on trade routes, and the company's financial performance. This gathering is anticipated to not just affirm Ardmore's resilience but also expound on its strategic foresight aimed at exploiting emergent market opportunities.
Institutional investors' substantial stake in Ardmore further accentuates its market credibility and investor appeal. With a majority shareholding, these investors' outlook and decisions significantly influence Ardmore's strategic direction and financial stability. The balanced distribution of shares among top shareholders like Dimensional Fund Advisors LP, BlackRock, Inc., and Scorpio Tankers Inc., fosters a governance dynamic conducive to collaborative strategizing and decision-making.
The backdrop of Ardmore's anticipated financial performance for the fourth quarter of 2023 and beyond remains cautiously optimistic, notwithstanding the expected declines in earnings and revenue. Adjustments in earnings estimates and forward-looking statements regarding Ardmore's financial health suggest a prevailing sentiment that, while acknowledging the challenges, leans toward a future recuperation in financial performance. This outlook is bolstered by Ardmore's historical performance of consistently surpassing Zacks Consensus Estimates in previous quarters, showcasing an inherent operational efficiency that could mitigate the impacts of current and future hurdles.
Furthermore, Ardmore's involvement in the evolving narrative of the transportation-shipping industry, particularly in comparison to peers like Scorpio Tankers, draws a broader picture of sectorial challenges and opportunities. The anticipation surrounding financial reports from both companies provides a comparative basis for assessing the health and strategic positioning within the wider industry. The speculation over earnings weaves into a larger discourse on the resilience and adaptability of shipping companies amidst fluctuating oil prices, geopolitical pressures, and global demand dynamics.
In conclusion, Ardmore Shipping Corporation's journey through the fluctuating tides of the global shipping industry encapsulates a story of resilience, strategic foresight, and a balanced approach to stakeholder value maximization. As the company prepares to share its latest financial outcomes and strategic directions, the market watches closely, recognizing Ardmore's role as not just a participant but as a potential leader in shaping the future trajectory of the marine transportation sector.
Ardmore Shipping Corporation (ASC) has experienced significant volatility from February 13, 2019, to February 9, 2024. The volatility is quantitatively captured in the ARCH model, which highlights the unpredictability of ASC's asset returns. Key features indicating this volatility include a high coefficient for omega, suggesting large baseline volatility, and a significant alpha[1] value, indicating that past volatility contributes notably to future volatility.
| Statistic Name | Statistic Value |
|---|---|
| Log-Likelihood | -3422.03 |
| AIC | 6848.05 |
| BIC | 6858.32 |
| omega | 11.6258 |
| alpha[1] | 0.1761 |
To analyze the financial risk associated with a $10,000 investment in Ardmore Shipping Corporation (ASC) over a one-year period, an integration of volatility modeling and machine learning predictions is employed. This approach not only captures the inherent stock volatility but also leverages historic data patterns to predict future returns, offering a robust assessment of the investment's risk profile.
Volatility modeling is pivotal in understanding the fluctuating nature of Ardmore Shipping Corporation's stock. By analyzing past price movements and market variations, this model identifies the rate at which the stock's price varies over time, giving investors insight into the level of uncertainty or risk associated with the stock. In this context, the model is particularly useful for quantifying the stock's volatility, which in turn is crucial for calculating the Value at Risk (VaR). This measure informs investors about the potential loss in value of their stock portfolio over a specified period, given normal market conditions, thereby providing an estimate of the extent of potential financial loss.
On the other hand, machine learning predictions are utilized to forecast future returns of ASC based on historical data. By analyzing patterns in the stock's past performance, machine learning algorithms can make informed predictions about its future behavior. Specifically, the utilization of a predictive model that is adept at handling nonlinear and complex relationships within the data allows for the generation of future return forecasts with a high degree of accuracy. This predictive power is essential for understanding potential future gains or losses, thereby complementing the volatility analysis for a comprehensive risk assessment.
The calculated annual Value at Risk (VaR) for a $10,000 investment in ASC, at a 95% confidence interval, stands at $409.63. This figure signifies that, under normal market conditions, there is only a 5% chance that the investment will decrease in value by more than $409.63 over a one-year period. This VaR calculation, derived from the integrated approach of volatility modeling and machine learning predictions, provides investors with a quantifiable metric for assessing the financial risk of their investment. By understanding the potential downside risk, investors can make more informed decisions about whether to proceed with the investment based on their risk appetite and financial goals.
In essence, the combined use of volatility modeling and machine learning predictions offers a nuanced view of the potential risks associated with investing in Ardmore Shipping Corporation. By capturing both the stock's historical volatility and leveraging predictive analytics to forecast future returns, this approach provides a multifaceted understanding of the investment's risk profile. Through the calculated VaR, investors are equipped with a valuable measure of the expected maximum loss at a specified confidence level, underscoring the effectiveness of this integrated method in assessing financial risk in equity investment.
Given the information provided in the options chain for Ardmore Shipping Corporation (ASC) and aiming for a target stock price that is 5% over the current stock price, let's zero in on the call options that might prove to be the most profitable. When analyzing options for profitability, we should consider a combination of factors, including the Greeks (Delta, Gamma, Vega, Theta, and Rho), premiums, return on investment (ROI), and potential profit. For this analysis, I'll focus on options with favorable deltas (which measure how much an option's price is expected to move for every $1 movement in the underlying stock), high ROI, positive profits, and which are impacted minimally by time decay (theta).
An intriguing option to consider is the one with a strike price of $15.0, expiring on February 16, 2024. This option has a delta of 0.8899, indicating a strong sensitivity to the stock price movement, a relatively low theta of -0.0254, implying it suffers less from time decay compared to others, and an impressive ROI of 68.22% with a profit of $0.73. Despite its shorter time to expiration, its gamma of 0.2189 suggests high potential for delta to increase if ASC's stock price moves towards our target, meaning profitability could significantly improve in a favorable market move.
Another option catching the eye is the call with a strike of $7.5, expiring on April 19, 2024. It boasts an exceptionally high delta of 0.9871, indicating it moves almost one-to-one with the stock itself, a fantastic trait for predicting profitability. With practically no gamma, vega, or negative theta, its price is less sensitive to volatility and time decay, making it a solid choice for those bullish on ASC in the near term. It offers a 55% ROI and $3.3 in profit, marking it as potentially very lucrative.
For longer-term investors, the option with a strike price of $10.0, expiring on July 19, 2024, is also worth mentioning. It features a delta of 0.8545, suggesting a strong connection to the stock's price movements, along with a considerable vega of 2.0196, making it more sensitive to changes in implied volatility a double-edged sword, but potentially profitable if expected volatility increases. With an ROI of approximately 7.94% and a profit of $0.5, it's less immediately profitable than some shorter-term options, but its longer expiry gives the stock more time to exceed our target price, potentially increasing the return.
In summary, options with short-term expirations like the $15.0 strike price option expiring in February 2024 present high-risk, high-reward scenarios due to their sensitivity to price movements and significant ROI. Meanwhile, options like the $7.5 strike expiring in April 2024 stand out for their perfect delta and minimal decay, offering stable growth potential with a significant profit margin. Lastly, for those looking at more extended horizons, the $10.0 strike option expiring in July 2024 balances movement sensitivity and time, giving the stock ample opportunity to grow beyond our target, albeit with a somewhat lower immediate ROI but with potential for substantial growth in a seemingly stable environment.
Similar Companies in Oil & Gas Midstream:
International Seaways, Inc. (INSW), Scorpio Tankers Inc. (STNG), Dorian LPG Ltd. (LPG), Euronav NV (EURN), Teekay Tankers Ltd. (TNK), Tsakos Energy Navigation Ltd. (TNP), Frontline Ltd. (FRO), DHT Holdings, Inc. (DHT)
https://finance.yahoo.com/news/3-best-small-cap-stocks-182003494.html
https://finance.yahoo.com/news/ardmore-shipping-asc-stock-moves-225017895.html
https://finance.yahoo.com/news/ardmore-shipping-announces-2024-investor-211500098.html
https://finance.yahoo.com/news/ardmore-shipping-corporation-nyse-asc-180531491.html
https://finance.yahoo.com/news/earnings-preview-ardmore-shipping-asc-150032892.html
https://finance.yahoo.com/news/ardmore-shipping-asc-stock-slides-225013755.html
https://finance.yahoo.com/news/scorpio-tankers-stng-expected-beat-150035434.html
https://finance.yahoo.com/news/whats-store-ardmore-shipping-asc-111300731.html
Copyright © 2024 Tiny Computers (email@tinycomputers.io)
Report ID: n4q9f6
Cost: $0.50578
https://reports.tinycomputers.io/ASC/ASC-2024-02-12.html Home