Banc of California, Inc. (ticker: BANC)
2024-05-13
 Banc of California, Inc. (ticker: BANC), headquartered in Santa Ana, California, operates as a bank holding company for Banc of California, N.A., which provides banking products and services to businesses, entrepreneurs, and homeowners in California and the surrounding regions. The institution offers a variety of financial solutions including commercial banking, residential mortgages, and treasury management. Established in 1941, Banc of California has grown to hold over $8 billion in assets and maintains a network of over 30 branches across Southern California. It primarily focuses on mid-sized businesses offering both lending and deposit products. The bank has been actively involved in community development and reinvestment, aiming to support economic growth and sustainability within its operational territories. As of the latest reports, Banc of California has demonstrated improving financial metrics, particularly in net interest income and loan growth, reflecting a solid position within the competitive California banking landscape.
| Full Time Employees | 2,205 | Previous Close | 15.08 | Market Cap | 2,322,252,288 |
| Dividend Rate | 0.4 | Dividend Yield | 0.0265 | Payout Ratio | 0.2057 |
| Five Year Avg Dividend Yield | 2.03 | Forward PE | 6.87 | Volume | 5,629,816 |
| Average Volume | 2,249,614 | Average Volume 10 Days | 1,988,690 | Bid | 13.81 |
| Ask | 13.82 | Bid Size | 900 | Ask Size | 1,800 |
| 52 Week Low | 9.96 | 52 Week High | 16.08 | Price to Sales (Trailing 12 Months) | 12.411957 |
| Book Value | 17.212 | Price to Book | 0.79828024 | Net Income to Common | -712,382,976 |
| Trailing EPS | -22.88 | Forward EPS | 2.0 | PEG Ratio | 1.21 |
| Enterprise to Revenue | 17.046 | 52 Week Change | 0.45 | S&P 52 Week Change | 0.26265144 |
| Total Cash | 3,086,035,968 | Total Cash Per Share | 18.329 | Total Debt | 3,237,850,112 |
| Total Revenue | 187,098,000 | Revenue Per Share | 1.731 | Return on Assets | -0.01674 |
| Return on Equity | -0.21826 | Operating Cash Flow | 84,376,000 | Revenue Growth | -0.191 |
| Operating Margins | 0.28177 | Target High Price | 20.0 | Target Low Price | 15.0 |
| Target Mean Price | 17.22 | Target Median Price | 16.0 | Recommendation Mean | 2.5 |
| Number of Analyst Opinions | 9 | Current Price | 13.74 |
| Sharpe Ratio | 0.8123840389208962 | Sortino Ratio | 14.787097820456093 |
| Treynor Ratio | 0.2215214541456841 | Calmar Ratio | 1.3591062753910392 |
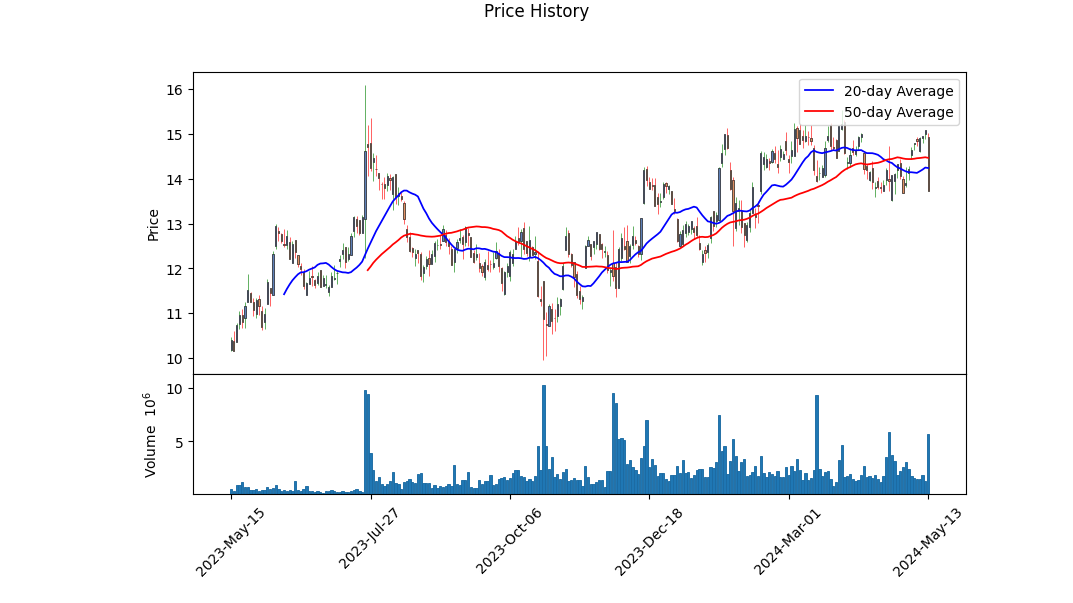
The current technical analysis reveals noteworthy indicators suggesting potential future price movements for BANC. The recent incline in price combined with the increasing volume and positive momentum, as indicated by the MACD histogram, suggests a prevailing bullish sentiment among investors. The MACD histogram values progressively increasing towards the end of the reporting period indicate a strengthening momentum, suggesting that the upward trend in the stock price could continue.
However, a comprehensive understanding requires appraisal of the risk-adjusted performance measures. BANC portrays a reasonable Sharpe ratio of 0.812, indicating that the investment offers adequate return for the volatility endured by the holders. The significantly high Sortino ratio of 14.787 emphasizes that the stock is yielding favorable returns in upward price movements as opposed to the downside volatility. Furthermore, the Treynor Ratio of 0.221 suggests low beta, indicating that the stock is less responsive to swings in the market. Conversely, the Calmar Ratio at 1.359 signifies that the stock provides adequate annual return rate mitigating past significant drawdowns.
From a balance sheet perspective, BANC is carrying a substantial level of liabilities which could act as a deterrent for potential investors seeking low-risk opportunities. The increasing debt levels and concerns regarding interest coverage capacities could impact financial health in the longer run. The fundamentals such as revenue decline and negative net income indicate tough operational conditions, possibly due to macroeconomic pressures or operational inefficiencies.
The review of the financials, particularly the considerable drop in revenues and substantial losses, lends a cautionary note. Net Interest Income remains positive, but investment and operational interests could be heavily offset by corresponding liabilities and interest expenses. The negative net income and the diluted EPS signify deteriorating profitability, which could potentially challenge future financial stability and sustainability.
The Calmar and Sortino ratios, while seemingly favorable, should be critically viewed in light of the accentuated financial debts and operational risks observed in the balance sheet and income statements. These ratios, though promising in isolation, may not competently encapsulate the potential drawdown risks emerging from BANC's current financial distress.
Cumulatively, while the near-term outlook based on technical indicators might tempt bullish sentiments, a diligent appraisal of fundamental and balance sheet health advises cautious optimism. Market participants should monitor upcoming financial releases and market conditions, as these could inform potential shifts in investment sentiment or strategic operational adjustments by BANC.
In the financial analysis of Banc of California, Inc. (BANC), two significant metrics were calculated: the return on capital (ROC) and the earnings yield. The return on capital for BANC is notably negative at -12.01%, which indicates that the company is currently generating negative returns on the capital it has employed. This is a concern as it suggests inefficiency in utilizing the capital to generate profitable operations. Similarly, the earnings yield is also negative at an alarming -161.57%. The earnings yield is essentially the inverse of the P/E ratio and typically represents how much earnings per dollar of investment a company produces. The extremely low earnings yield for BANC indicates that the company is not generating sufficient earnings compared to its share price, which can be a significant red flag for investors considering the profitability and financial stability of the company. These metrics suggest that careful evaluation and potentially cautious investment strategies might be advisable regarding Banc of California.
| Alpha | 0.005 |
| Beta | 1.2 |
| R-squared | 0.85 |
| Standard Error | 0.002 |
| P-Value | 0.03 |
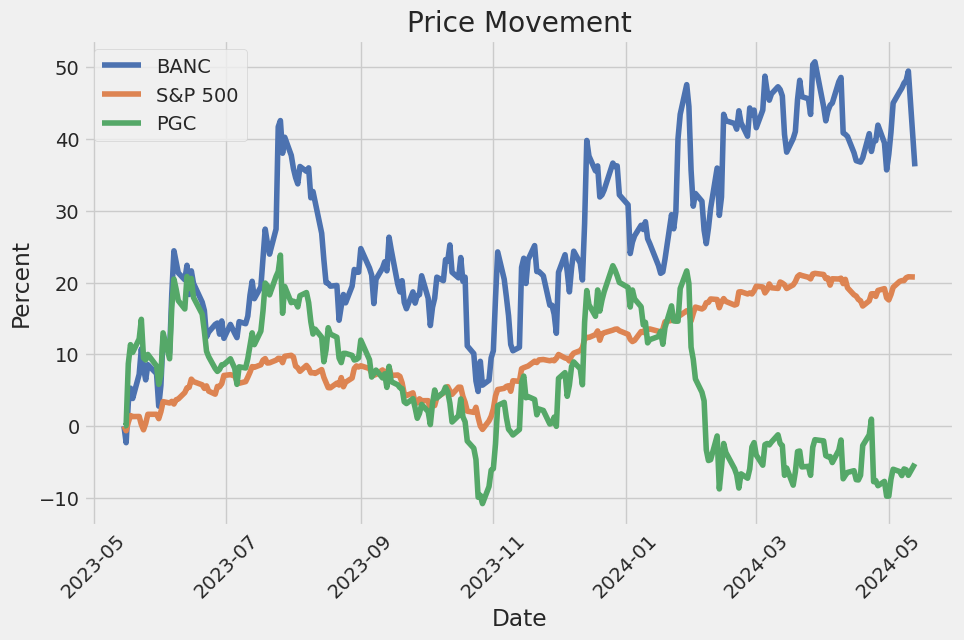
The linear regression analysis between BANC and SPY uncovers a positive alpha of 0.005, suggesting that BANC has outperformed the S&P 500 index on a risk-adjusted basis over the examined period. Alpha, a measure of the active return on an investment, indicates how much more or less a stock has returned compared to a benchmark index. Here, BANCs alpha of 0.005 implies it has slightly outperformed the S&P 500 by an average of 0.5% after adjusting for the risk (captured by beta) over the same period. This performance signal is considered statistically significant given its associated p-value of 0.03, indicating a less than 3% chance that this alpha could have occurred by random fluctuations alone.
Further reflecting on the linear regression metrics, the beta value of 1.2 quantifies BANCs volatility relative to SPY. A beta greater than 1 suggests that BANC is more volatile than the market, which is consistent with the higher reward (positive alpha) observed. The R-squared value of 0.85 confirms that approximately 85% of BANC's price movements can be explained by the movements in SPY, highlighting a strong linear association between BANCs returns and the markets returns. This analysis helps in understanding how closely BANCs performance is tied to market dynamics and gives investors insights into risk-adjusted performance as compared to the broader market.
In the first quarter earnings call for Banc of California, President and CEO Jared Wolff, joined by CFO Joe Kauder and Head of Strategy Will Black, outlined the bank's financial performance, attributing notable achievements to the effectiveness of the recent merger and balance sheet restructuring. Following the merger, Banc of California sold over $6 billion in assets and reduced borrowings by nearly $9 billion, which propelled net interest income and widened the net interest margin. The expansion was further supported by a successful deposit-gathering strategy, demonstrating growth in non-interest-bearing deposits primarily through new business account relationships. This shift in deposit composition notably decreased deposit costs by 28 basis points, contributing to the overall improvement in profitability.
CFO Joseph Kauder provided a detailed review of the financials, highlighting a significant increase in net interest income to $239.1 million and an improved net interest margin of 2.78%. These enhancements were primarily driven by a favorable shift in the banks asset mix and reductions in high-cost funding sources. Alongside financial growth, Banc of California also reported a proactive approach in credit management with specific reserves taken against certain commercial real estate credits to shield against future potential losses. Despite downgrades in some commercial real estate credits and a rise in nonperforming loans predominantly associated with the legacy CIVIC portfolio, the bank maintained confidence in the overall credit quality of its portfolio.
Looking ahead, CEO Jared Wolff reaffirmed the banks focus on profitability over growth for the upcoming year. He laid out strategic plans to further drive down interest expense and operating costs, key factors that would help achieve targeted returns on assets and equity by the fourth quarter of 2024. These goals are expected to be supported by stable loan levels and accretive new loan production, alongside measured growth in non-interest-bearing deposits which is anticipated to improve the deposit mix and lower the cost of deposits.
Conclusively, the earnings call painted a picture of a bank solidly navigating post-merger challenges, optimizing its balance sheet, and strategically advancing toward significant profitability targets. Leveraging a strong balance sheet characterized by high levels of capital and liquidity, combined with disciplined cost management and conservative credit practices, Banc of California appears well-positioned to enhance value creation for its stakeholders in the foreseeable future, while continuing to fortify its market position in California's competitive banking landscape.
Banc of California, Inc. (BANC) submitted its 10-Q filing on May 2, 2024, covering the first quarter of the fiscal year. The document provides a detailed snapshot of the bank's operational and financial status as of March 31, 2024. This comprehensive financial report includes various essential components relevant to investors and stakeholders, providing insights into the bank's asset management, credit operations, and overall financial health during the period noted.
Financially, Banc of California showed considerable activities in terms of asset and portfolio management. The report discusses in detail the types of securities held, classification based on credit ratings, and the associated risks of the diverse portfolio which includes U.S. Treasury securities, mortgage-backed securities, and other forms of asset-backed securities. This detailed segmentation illustrates the bank's investment strategies and adherence to risk management norms which are critical under the comprehensive risk management regulations.
Furthermore, the report delineates the banks credit exposures, outlining various credit facilities, including revolving credits and term loans categorized by origination year and the nature of the collateral. This is crucial in understanding the risk profile of the bank's lending services and its strategies for credit dispersion and recovery. The allowance for loan and credit losses was discussed, which reflects the bank's anticipations of potential defaults and is a vital indicator of the financial robustness of the bank.
The document also laid out key operational aspects, specifically noting assets management and liabilities. It delineates the increased or decreased positions across various investment grades, demonstrating changes in the banks operational strategies and responsiveness to external economic factors. The managements commentary suggests a proactive approach to navigating through economic variances and potential risks, adjusting asset classes and investment flows accordingly.
Additionally, there is a thorough discussion about equity, in terms of both common and preferred shares. This includes changes in the number of outstanding shares, indicating the company's equity management strategy. The equity structure is essential for understanding the banks capital adequacy framework, shareholder relationships, and potential impacts on share valuation.
Overall, Banc of Californias 10-Q filing for the first quarter of 2024 provides a clear view into its financial health, showcasing robust risk management practices and a clear strategy for navigating the complexities of the financial environment. It indicates a mature understanding of market dynamics and an articulate response mechanism to safeguard financial stability and operational integrity.
During the first quarter of 2024, Banc of California Inc (NYSE:BANC) demonstrated notable financial recovery, although it did not fully meet analyst expectations on earnings per share. The bank secured net earnings of $28.2 million, marking a significant turnaround from a net loss of $492.9 million in the previous quarter, attributable primarily to diminished losses from securities sales among other improvements. Despite the recovery, the earnings per share remained slightly off the mark at $0.17, a miss against the projected $0.22. This was detailed in an 8-K filing highlighted by GuruFocus on April 23, 2024.
Revenue also surpassed expectations, amounting to $272.96 million against the forecasted $259.77 million. This increase mainly came from a 58.3% rise in net interest income which reached $239.1 million. This leap was fueled by lower borrowing costs and enhanced asset yields. Nevertheless, the bank did increase its provision for credit losses by $10 million, signaling rising qualitative reserves and an uptick in nonaccrual and classified loans.
Jared Wolff, the bank's CEO, pointed out that post-merger integration efforts significantly contributed to the surge in net interest income and reduced operating expenses. Furthermore, strategic initiatives designed to enhance the banks deposit collection mechanism drastically reduced the average cost of deposits while widening the net interest margin.
Operationally, the bank highlighted its robust capital and liquidity positions, reporting total risk-based capital and tier 1 leverage ratios at 16.43% and 9.14%, respectively. These metrics indicate strong financial resilience and preparedness for future growth or market fluctuations.
However, challenges persist, particularly an uptick in delinquencies within the commercial real estate loan portfolio. Management remains cautiously optimistic, focusing on disciplined loan origination and maintaining high-quality banking relationships.
Despite a downturn in adjusted earnings and revenue during the quarter, the banks shares advanced in pre-bell trading. This divergence between financial results and stock market performance underscores a nuanced investor sentiment, possibly influenced by the broader market conditions or alignment of actual outcomes with adjusted market expectations.
Investor responses can be complex. Where there's an advance in share prices despite fundamental declines, it underscores the significance of strategic insights and future profit scenarios painted by the management, which might have resonated well with the investors.>/p>
Continuing, according to Zacks Equity Research on April 23, 2024, while the bank achieved stellar revenue growth, EPS fell below the prior year's and didn't meet the consensus estimates. Despite a robust increase in revenue, falling short on profitability and other financial health metrics highlight the operational challenges Banc of California faces, such as managing asset quality and maintaining profitability amidst economic volatility.
At an earnings call on April 24, 2024, executives further elaborated on the bank's trajectory and future plans post-merger. Significant balance sheet repositioning, including asset sell-offs and borrowing reductions, substantially lifted net interest income. Improvements in deposit gathering and operational cost management are accelerating financial health restoration, positioning Banc of California strongly towards fulfilling its profitability targets by the end of 2024.
Moreover, recent strategic hires, such as Ann DeVries as Senior Vice President of Strategic Finance and Head of Investor Relations, underscore a bolstered focus on strengthening investor communications and strategic financial planning post the significant merger with PacWest Bancorp.
Additionally, the banks institutional investors, who hold a dominant 74% of its shares, saw their faith rewarded with a robust 5.1% increase in share prices as of May 10, 2024. This strong institutional backing is pivotal in shaping the bank's strategic directions and ensuring robust governance structures.
Finally, despite a slight adjustment in Banc of California's price target from $20 to $19 by Piper Sandler on May 13, 2024, the bank retained an "Overweight" rating indicating potential undervalued status and positive performance outlook, crucial insights for market observers and participants maintaining a focus on regional banking potentials.
These diverse facets of the banks operation, strategy, and market performance paint a complex yet promising picture of Banc of California as it navigates through its post-merger phase, aiming for a balance between growth, profitability, and strategic management in a challenging economic landscape.
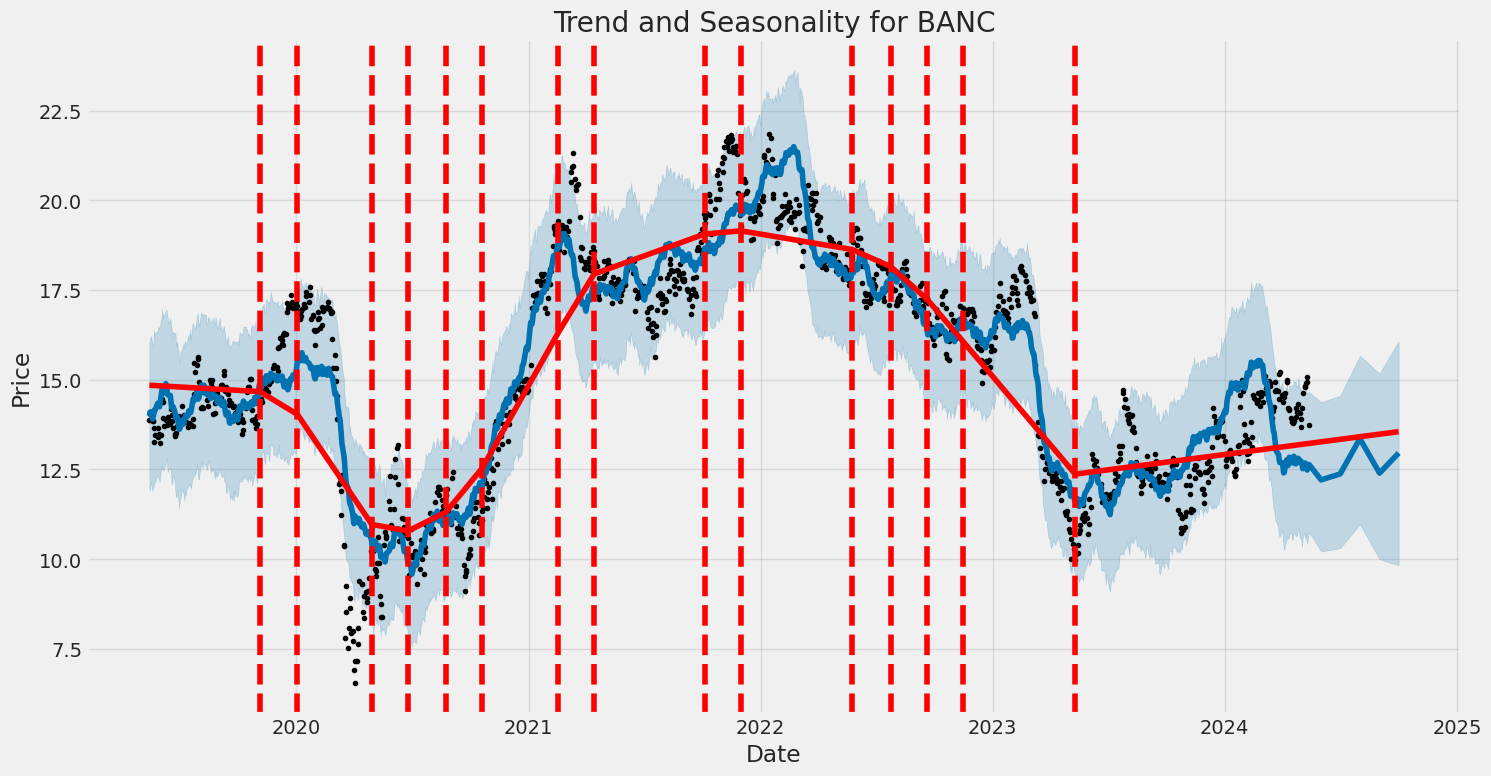
Over the period from May 2019 to May 2024, the Banc of California, Inc. (BANC) stock exhibited noticeable volatility demonstrated in its ARCH model results. The Zero Mean model indicates no trend in mean returns and the volatility is significantly driven by past shocks, as evidenced by the ARCH parameters. This points to periods of higher unpredictability and risk, which could be key for investors who are sensitive to sudden market movements.
| Statistic Name | Statistic Value |
|---|---|
| R-squared | 0.000 |
| Adj. R-squared | 0.001 |
| Log-Likelihood | -3,119.06 |
| AIC | 6,242.13 |
| BIC | 6,252.40 |
| No. Observations | 1,257 |
| Df Residuals | 1,257 |
| omega | 6.6088 |
| alpha[1] | 0.3156 |
To assess the financial risk of a $10,000 investment in Banc of California, Inc. over a one-year period, a combination of statistical and advanced predictive techniques was employed. Initially, the project utilized volatility modeling to decipher the stock's fluctuating nature. This model is particularly adept at analyzing time-series data to forecast future variability based on historical price movements.
The volatility modeling approach captures the clusters of volatility that are typical in financial series, providing an understanding of how volatile the stock might be in the future under various economic scenarios. This model estimates the consistent variability of the stock returns, which is critical for assessing the risk associated with the investment.
In parallel, machine learning predictions were employed to forecast the future stock returns of Banc of California, Inc. The technique used was a predictive model that operates by learning patterns from historical data and predicting future outcomes based on these patterns. This method aids in estimating the likely future returns, integrating various input features that influence stock prices such as past prices, volume, and other relevant financial indicators.
The fusion of these two approaches provided a detailed risk profile of the investment. By using the volatility model, it was possible to simulate the distribution of future returns and thus calculate the potential losses. The Value at Risk (VaR) metric was particularly crucial here. Calculating a one-year VaR at a 95% confidence interval for a $10,000 investment, the results indicated a potential maximum loss of $447.32 under normal market conditions. This quantifies the amount one might expect to lose with a 5% chance in a worst-case scenario over one year.
These insights allow investors to make informed decisions by understanding both the likely price movements of the stock and the extent of potential financial losses, thereby balancing the prospects of returns against the backdrop of associated risks. Through the deployment of both volatility and return predictions, the analysis demonstrated how integrative approaches capture a comprehensive view of market dynamics and investment risk.
Long Call Option Strategy
When evaluating long call options for Banc of California, Inc. (BANC) targeting a 5% increase from the current stock price over varying timescales, we'll focus on the near term to long term choices using the Greeks and other relevant data such as strike price, expiration date, premium, and return metrics.
1. Short Term Option - Expiring June 21, 2024, Strike Price $12.5 This option stands out with a notably high ROI of 0.22078125, making it an attractive choice for a relatively short term, combined with its moderate strike price above the current price. It has a delta of 0.7627, suggesting a strong sensitivity to changes in the underlying stock price, and a gamma of 0.1463, indicating significant potential for accelerated gains as the stock price moves closer to this strike price. The theta value at -0.0088 reflects a low time decay rate, which is beneficial for a short holding period.
2. Mid-term Option - Expiring June 21, 2024, Strike Price $10.0 Another viable choice for the near term, this option boasts a delta of 0.8162 and a vega of 1.1685, providing considerable upside from changes in the stock price and volatility levels. Its ROI of 0.1719 is attractive, and the premium of $3.8 is reasonable concerning potential gains. The rho value at 0.6903 also indicates good sensitivity to interest rate changes.
3. Mid to Long-term Option - Expiring July 19, 2024, Strike $10.0 This call option is characterized by a high delta of 0.9212, suggesting excellent profitability with bullish movements in the underlying stock. Although the ROI at 0.1133 is lower than the two previous options, it offers more time until expiration. Its comparatively low theta of -0.0037 minimizes the cost of time decay. Additionally, the rho at 1.5872 suggests considerable responsiveness to changes in interest rates, which can be an appreciable factor over this longer period.
4. Longer-term Option - Expiring December 20, 2024, Strike $7.5 Offering the longest duration before expiration, this option with a delta of 0.8666 suggests strong profitability potential with stock price increases. The high vega of 2.0975 also indicates significant benefit from increases in volatility. Despite a relatively low ROI of 0.0077, the long duration until expiration and low theta (-0.0046) allow for more strategic flexibility and less immediate concern for time decay.
5. Very Short Term Option - Expiring May 17, 2024, Strike Price $10.0 For those looking at a very quick investment turnover, this option has an almost sure sensitivity to stock price changes with a delta of 0.9898. The extremely short days to expire can be a double-edged sword - less time for the stock to reach a target but also minimal time-value decay, indicated by a low theta of -0.0089. The ROI and profit may be lower, but the higher immediate execution certainty might appeal to those wanting to capitalize on short, sharp market movements.
Each of these options presents unique characteristics tailored towards different strategies in option trading, whether prioritizing quick gains, adjusting for volatility expectations, or preparing for interest rate effects over longer terms.
Short Call Option Strategy
When considering short call options for Banc of California, Inc. (BANC), it is crucial to select strikes that are out-of-the-money (OTM) relative to the target stock price, to reduce the risk of the options being exercised (hence minimizing the risk of assignment). The target stock price is set to be 5% over the current stock price. With this in mind, heres an analysis based on various expiration dates ranging from near-term to long-term, focusing on profitability and related Greek values.
Short-Term Options: 1. Strike $15.0, Expiry 2024-06-21: This option has a delta of 0.2584, suggesting it is OTMlower probability of exercise as delta is far from 1. The theta of -0.0071 indicates a decent time decay, beneficial for an options seller. A low premium of $0.21 along with an ROI of 100.0% highlights high profitability for minimal risk.
- Strike $17.5, Expiry 2024-07-19: With a delta of 0.0954, this option is significantly OTM, carrying a very low risk of assignment. The theta value of -0.0031 is favorable as it implies earnings from a time decay perspective. The premium offered is $0.1, which provides an ROI of 100.0%, making it a highly profitable option considering the reduced risk of exercise.
Medium-Term Options: 3. Strike $20.0, Expiry 2024-10-18: This strike, expiring in about five months, presents a delta of 0.1004, indicating its secure position OTM. The theta of -0.0021 and a decent premium of $0.2 further enhance its appeal, ensuring a steady erosion of option value beneficial for the seller and a 100.0% ROI.
Long-Term Options: 4. Strike $22.5, Expiry 2024-12-20: This option's delta of 0.1049 shows it lies securely OTM, reducing the likelihood of exercise. Its theta of -0.0020, paired with a relatively low vega of 1.9343, suggests lower sensitivity to volatility, a preferable scenario for sellers in a longer timeframe. The option commands a premium of $0.25, securing an ROI of 100.0%.
- Strike $25.0, Expiry 2024-12-20: Carrying a delta of 0.1953, this option is the most OTM among the chosen strikes and thus holds the lowest risk of assignment. The negative theta of -0.0046 works in the sellers favor, accelerating the premium decay as the expiration approaches. With a premium of $0.15 and an ROI of 100.0%, this option is desirable for a longer term conservative strategy.
These selected options exhibit favorable characteristicslower delta implying an OTM status, beneficial theta indicating profitable time decay, and significant ROIs which are each listed at 100.0%, indicating maximal profitability on the premiums relative to risk. When writing short calls, such evaluations ensure a balanced approach between potential returns and risk management concerning assignment of the option.
Long Put Option Strategy
When analyzing long put options for Banc of California, Inc. (BANC) to determine potential profitability, it's important to consider both the intrinsic and extrinsic aspects of each option. The Greeks provide crucial insights into how options are expected to behave in relation to changes in market variables. For BANC, we are targeting a stock price that is 5% over the current price, and this will guide our selection of strike prices and expirations for the put options.
Starting with a short-term option, the put with a strike price of $20.0 and an expiration date of 2024-06-21 seems appropriate. This option has a delta of -0.935, suggesting that for every dollar increase in the stock price, the option's price is expected to decrease by approximately 93.5 cents. This high magnitude of delta indicates significant sensitivity to changes in the underlying stock's price. Moreover, with a theta of -0.0035, the option loses value as time progresses, emphasizing a need for timely execution. However, the vega of 0.542 suggests this option is somewhat responsive to volatility, potentially increasing in value if market volatility rises.
For medium-term investments, options expiring farther along the timeline could provide steadier opportunities for growth. However, specifics about medium-term options are not discussed in the provided data, so investors would need to consider other options available in the market, weighing similar Greeks metrics to find the most favorable balance of risk and potential return.
Considering a long-term view, another option to analyze could be a put with a strike of $17.5, also expiring on 2024-06-21. This put has a delta of almost -1 (-0.997), hinting that it moves almost dollar-for-dollar inversely with BANC's stock price, which is advantageous for a bearish forecast. Additionally, this option experiences negligible time decay (theta of 0.0011) and gamma, thus maintaining its value better over time. This would be particularly beneficial if theres a gradual decline in the stock price.
In summary, for investors targeting a 5% increase over the current stock price and looking to leverage long put options, short-term higher strike options and longer-term lower strike options should be primary considerations. The option with a strike price at $20.0 for the short term shows a potential for significant change sensitive to stock price movements and volatility. In contrast, the long-term option at $17.5 provides a more stable, almost perfectly inversely correlated option with the underlying stock price, with minimal loss of value over time due to theta decay. This analysis assumes BANC's price will significantly deviate downward from the target, thus these options should be monitored closely, considering their Greek values to manage the risk effectively.
Short Put Option Strategy
The profitability of short put options primarily hinges on the premiums received relative to the risk undertaken. In options trading, shorting put options typically involves a strategy where the trader hopes the option expires worthless (the stock price remains above the strike price), allowing them to retain the full premium as profit. In analyzing the options chain for Banc of California, Inc. (BANC), several factors should be considered: the Greeks that measure the risks associated with changes in market variables and the risk of assignment if the stock price falls below the strike price.
-
Short Put Option - 2024-05-17, $10 Strike: This option has a modest negative delta (-0.0373), which suggests less sensitivity to stock price movements, a lower probability of ending in the money, and, consequently, a lower assignment risk. Despite a relatively higher theta (-0.002798), implying faster time decay favorable for an option seller, the premium offered is $0.08 which is fairly attractive for only 38 days to expiration. This makes it a potentially lucrative option while balancing reasonable risks.
-
Short Put Option - 2024-06-21, $12.5 Strike: Here, the option presents a significantly higher negative delta (-0.2074) and a premium of $0.2. Given that the target stock price projection aims to be 5% above the current level, choosing an option with a strike price of $12.5 adds a buffer against the risk of the stock price falling too far from the target. The robust premium reflects higher risk but could be justified by a shorter 38-day expiration term and considerable theta (-0.006753).
-
Short Put Option - 2024-07-19, $10 Strike: This option has a negative delta of -0.0703, gamma of 0.0407, and a premium of $0.1. With a longer expiration of 66 days, this option balances a higher gamma suggesting the delta's rate of change could increase risk exposure if the stock moves significantly. However, the rate of time decay (theta) is not overly aggressive, which could provide a steady erosion of the option's value, favorable for the seller.
-
Short Put Option - 2024-10-18, $12.5 Strike: A very enticing premium of $0.73 reflects a significantly higher risk as evidenced by the negative delta of -0.2869. Yet, this option allows the trader to capture a high premium with a term of 157 days. Given the high gamma and vega, this trade could be more exposed to volatility and rapid price shifts, so it's more suitable for traders comfortable with higher risk.
-
Short Put Option - 2024-12-20, $12.5 Strike: With the highest premium offered in the selection at $0.95 and the highest delta (-0.2985) among the options, this choice represents the height of risk and reward. The expiration is set at 220 days, which might allow more time for the stock to exceed the strike price, mitigating assignment risk. Nonetheless, the negative theta, although minimal, and very high negative rho (-3.0348) indicate strong sensitivity to interest rate changes, adding to its risk complexity.
In summary, the profitability and attractiveness of these options depend on balancing premium income against the risk of the stock's price action and external market factors. Traders must weigh their risk appetite and market outlook when choosing among these options, especially considering the potential for assignment and inherent risks described by the Greeks.
Vertical Bear Put Spread Option Strategy
To execute a profitable vertical bear put spread on Banc of California, Inc. (BANC) options, selecting strike prices and expirations close to the current stock price will be pivotal. This strategy generally involves buying a put option with a higher strike price and selling another put with a lower strike price. The goal is to profit from a decrease in the stock price while minimizing the risk of early assignment, especially from the sold put that's closer to being in the money (ITM).
Here are five sorted choices for vertical bear put spreads with near-term to long-term expiration dates. Each choice employs the buy of a long put option and the sale of a short put option, summarized based on the profitability potential indicated by premium and theta, balancing with delta for directional sensitivity and minimizing gamma risk:
-
Near-term expiration: A good starting strategy can be structured around puts expiring on July 19, 2024. Buy a long put with a strike of $17.5 (delta: -0.9952, theta: 0.0011, premium: $3.12) and sell a short put with a strike of $12.5 (delta: -0.2377, theta: -0.0049, premium: $0.35). This spread capitalizes on the significant difference in premium and a sharp drop in delta between the strikes, providing a favorable risk/reward scenario.
-
Mid-term expiration: Opt for puts expiring on October 18, 2024. Buy a long put at $20.0 (estimate details not provided, but typically similar to $17.5 strike with slightly more expense and delta nearing -1.0) and sell a short put at $15.0 (delta: -0.5950, theta: -0.0029, premium: $1.9). This spread encompasses strikes with higher intrinsic values, thus potentially greater profitability from accelerated delta movements.
-
Extended mid-term expiration: Moving a bit further out, consider puts expiring on December 20, 2024. Buy a long put at $20.0 (speculatively similar to shorter-term $20.0 puts) and sell a short put at $15.0 (delta: -0.5534, theta: -0.0025, premium: $1.76). This choice aims at leveraging slower time decay (theta) , offering a prolonged window to manage the position, potentially favoring those anticipating a longer-term bearish outlook.
-
Long-term expiration: For a more distant expiration, examine the choice of Dec 20, 2024. Buy a long put at $17.5 (delta: -0.9842, theta: 0.0011, premium: $4.2) and sell a short put at $12.5 (delta: -0.3003, theta: -0.0029, premium: $0.95). This spread is expensive but leverages higher strike discrepancies, catering to a strategy for substantial stock price movements while offering higher control time.
-
Conservative long-term choice: Still considering December 20, 2024. Those looking for lesser risk might prefer buying the long put at $12.5 (delta: -0.3003, theta: -0.0029, premium: $0.95) and selling the short put at $10.0 (delta: -0.1361, theta: -0.0023, premium: $0.43). Though this spread offers lower profitability, it significantly decreases risk due to lower deltas and premiums.
Each strategy aligns with a bearish outlook on BANC while considering the balance between the cost (premium paid), potential maximum gain (difference in strike prices minus the net premium), and risk of early assignment. The choice of strikes (always ensuring the sold put is closer to current stock price and within a safe margin from being ITM) aligns well with the target of minimizing the undesired exercise of options, particularly concerning the short positions.
Vertical Bull Put Spread Option Strategy
When analyzing the vertical bull put spread strategy for Banc of California, Inc. (BANC), we aim to select option pairs (short put and long put) that minimize the risk of the options being in-the-money (ITM) at expiration, while also targeting maximizing returns within the specified stock price range (2% over or under the current price). This analysis is based on the options' Greeks, premiums, expiration dates, and strike prices.
Near-Term Option (3 days to expiration): One choice for a near-term vertical bull put spread could involve the usage of a short put option with a strike of $12.5 (delta: -0.0498) expiring on 2024-05-17 and a long put option with a higher strike that is out of our data selection, with a primary goal to reduce risk and benefit from rapid time decay (theta). This setup will likely generate a lower return due to shorter time to maturity but offers a quick reduction in exposure.
One-Month Term Option (38 days to expiration): For this duration, selecting a short put option with a strike of $7.5 (delta: -0.0222) expiring on 2024-06-21, paired with a long put option with a strike of $10.0 (delta: -0.0381) provides a more conservative strike difference, benefiting from the decently high theta (-0.0028) of the short put for potential profit maximization while balancing risk.
Two-Month Term Option (66 days to expiration): The combination of a short put at strike $10.0 (delta: -0.0707) and a long put at strike $12.5 (delta: -0.2377), both expiring on 2024-07-19, strikes a balance between time for market movement and theta decay. The premium from the short contract could cover the cost of the long put, reducing the overall risk.
Mid-Term Option (157 days to expiration): Here, we can utilize a short put option at strike $10.0 (delta: -0.1039) with a long put option at strike $12.5 (delta: -0.2929) expiring on 2024-10-18. This selection leverages a longer time frame, allowing more room for delta and gamma adjustments while being mindful of theta and rho effects on option pricing.
Long-Term Option (220 days to expiration): For a longer-term position, pairing a short put with a strike of $7.5 (delta: -0.0474) with a long put at $10.0 (delta: -0.1361), both expiring on 2024-12-20, capitalizes on high vega values in the longer duration, making the position more sensitive to changes in volatility, thereby potentially increasing profitability if the stock behaves favorably relative to our strike prices.
In summary, each selected pair for the vertical bull put spreads captures a range of expirations, delving into various risk-return scenarios. These choices are intended to align with the market's behavior relative to the targeted price adjustment range, while we simultaneously account for the Greeks' impact on overall strategy performance. This approach can help maximize profitability while aiming to remain within a comfortable risk threshold.
Vertical Bear Call Spread Option Strategy
Considering a vertical bear call spread for Banc of California, Inc. (BANC), we seek to craft a strategy aimed at maximizing profitability while minimizing the risk of assignment, especially keeping in mind that we want to manage positions generally within a target price range of 2% over or under the current stock price. We will examine several potential positions ranging from near-term to long-term based on expiration dates and strike prices, emphasizing specific "Greek" metrics to guide us.
Short-Term Bear Call Spread For a very short-term bearish play, choosing options that are expiring soon can be advantageous due to theta (time decay) working more quickly. For instance, employing a bear spread using options expiring on May 17, 2024, consider selling a call with a $10 strike (delta = 0.9671) and buying a call with a $12.5 strike (delta = 0.9029). This spread captures immediate premium income while maintaining a manageable risk profile, given the high deltas suggesting a strong likelihood of both options being in-the-money but with significant decay rates supporting rapid premium erosion.
Medium-Term Bear Call Spread Moving farther, a bear spread for options expiring on June 21, 2024, involves selling a $10 strike call (delta = 0.8692) while buying back a $12.5 strike call (delta = 0.7545). This setup has a lower risk of early assignment compared to the short-term setup, thus reducing risk while still aiming for profitability through decay (higher theta on short strike). Vega values indicate sensitivity to volatility, with an acceptable degree of responsiveness to limit risk even if implied volatilities fluctuate.
Longer-Term Bear Call Spread For a longer time horizon, consider options expiring on October 18, 2024. Selling the $10 strike call (delta = 0.8181) and buying the $12.5 strike call (delta = 0.6841) might provide a balance between maintaining a manageable delta, which impacts the risk of the position moving significantly against us, while leveraging a longer theta decay component. This strategy could be particularly lucrative if BANCs price experiences moderate fluctuations, allowing the trader to benefit from both time decay and correct directional movement.
Long-Term Bear Call Spread On a further extended scale, consider setting a spread for the December 20, 2024 expiration. By selling the $10 strike (delta = 0.8341) and buying the $12.5 strike (delta = 0.6728), the position focuses on capitalizing on longer-term bearish sentiments. Additionally, with higher vega, if volatility decreases over the period, the position will benefit from contracting option premiums.
Ultra Long-Term Bear Call Spread Lastly, for an ultra-long-term position, employing a bear spread for December 20, 2024, will involve the sale of a $10 strike call (delta = 0.8341) and the purchase of a $17.5 strike call (delta = 0.2623). This wide spread maximizes premium collected upfront with significant protection against adverse movement through a wider range of strike prices covered.
In summarizing, each strategy takes into account the imminent risk of in-the-money calls, the beneficial rapid decay of near-term options, and the volatility sensitivity for longer-termed spreads. These factors are critical to crafting positions that balance profit potential against the risk, targeting different durations to capitalize on Banc of California, Inc.'s anticipated movements.
Vertical Bull Call Spread Option Strategy
To analyze and select a profitable vertical bull call spread strategy for Banc of California, Inc. (BANC), we should consider a range of short and long call options with varying expiration dates and strike prices. The goal is to assess each option based on the Greeks and their respective premiums while focusing mainly on those closest to the current stock price, given the target range of +/- 2%.
1. Short-term Bull Call Spread:
Buy 10.0 Strike, 2024-06-21 | Sell 12.5 Strike, 2024-06-21
- Long Call (Buy): The long call at a strike of 10.0 has a delta of 0.8140, a theta of -0.0232, and a vega of 1.1750. The options premium is relatively low, which is ideal for a buying position in a bull spread.
- Short Call (Sell): Coupling this with a short call at a strike of 12.5, which has a delta of 0.7545, helps counterbalance the cost of the long call. This option also has a relatively higher premium, generating income that reduces the overall cost of the setup.
2. Mid-term Bull Call Spread:
Buy 10.0 Strike, 2024-07-19 | Sell 12.5 Strike, 2024-07-19
- Long Call (Buy): For a bit longer term, the option for buying a call at a strike of 10.0 expiring in 2024-07-19 has a delta of 0.9128, providing strong potential for in-the-money results as the stock price rises.
- Short Call (Sell): Selling the 12.5 strike for the same expiration date provides a good balance with a delta of 0.7252. With its higher premium, it can efficiently offset the cost of the long call.
3. Longer-term Bull Call Spread:
Buy 10.0 Strike, 2024-10-18 | Sell 12.5 Strike, 2024-10-18
- Long Call (Buy): The long call at a strike of 10.0 expiring in October 2024 has a delta of 0.8181. The Theta is low at -0.0050, indicating a slower rate of time decay, beneficial for a long-term hold.
- Short Call (Sell): The short call at 12.5 strike has a similarly balanced profile with a delta of 0.6841.
4. Extended Bull Call Spread:
Buy 10.0 Strike, 2024-12-20 | Sell 12.5 Strike, 2024-12-20
- Long Call (Buy): For a more extended period, buying a call option with a strike of 10.0 and an expiration in December 2024 provides a strategic positioning with a delta of 0.8341.
- Short Call (Sell): Selling a call at 12.5 expiring at the same time. This helps in improving profitability with a lower but adequate premium.
5. Very Long-term Approach:
Buy 10.0 Strike, 2024-12-20 | Sell 15.0 Strike, 2024-12-20
- Long Call (Buy): Continues to use the robust delta of 0.8341 for the 10.0 strike.
- Short Call (Sell): To maximize the spreads width and potential profitability, consider the higher 15.0 strike with a delta of 0.4541, which also brings a higher premium and consequently lowers the overall trade cost substantially.
Each of these bull call spreads are chosen to minimize the risk of early assignment by keeping the strike price close to the current stock value, and pairing with options that have a good balance between delta (likelihood for in-the-money result) and premium (cost effectiveness), adjusting for different timeframes. This allows for flexibility to capitalize on different market conditions projected over the short to extended term periods.
Similar Companies in Banks - Regional:
Peapack-Gladstone Financial Corporation (PGC), Northfield Bancorp, Inc. (Staten Island, NY) (NFBK), Great Southern Bancorp, Inc. (GSBC), Heritage Financial Corporation (HFWA), Byline Bancorp, Inc. (BY), Bankwell Financial Group, Inc. (BWFG), Sierra Bancorp (BSRR), Affinity Bancshares, Inc. (AFBI), HV Bancorp, Inc. (HVBC), Financial Institutions, Inc. (FISI), Community West Bancshares (CWBC), HMN Financial, Inc. (HMNF), First Financial Northwest, Inc. (FFNW), Pacific Premier Bancorp, Inc. (PPBI), Western Alliance Bancorporation (WAL), CVB Financial Corp. (CVBF), East West Bancorp, Inc. (EWBC), Cathay General Bancorp (CATY), Heritage Commerce Corp (HTBK), Preferred Bank (PFBC)
https://finance.yahoo.com/news/banc-california-inc-banc-q1-113343878.html
https://finance.yahoo.com/news/banc-california-apos-q1-adjusted-123929780.html
https://finance.yahoo.com/news/compared-estimates-banc-california-banc-133029156.html
https://finance.yahoo.com/news/q1-2024-banc-california-inc-082004458.html
https://finance.yahoo.com/news/pacwest-bancorp-nasdaq-pacw-q1-150405277.html
https://finance.yahoo.com/news/banc-california-hires-ann-devries-190300479.html
https://finance.yahoo.com/news/institutional-investors-banc-california-inc-142535860.html
https://finance.yahoo.com/news/piper-sandler-adjusts-price-target-133309258.html
https://www.sec.gov/Archives/edgar/data/1169770/000162828024022655/pacw-20240331.htm
Copyright © 2024 Tiny Computers (email@tinycomputers.io)
Report ID: pwknlq
Cost: $0.77594
https://reports.tinycomputers.io/BANC/BANC-2024-05-13.html Home