Bloomin' Brands, Inc. (ticker: BLMN)
2024-02-28
 Bloomin' Brands, Inc. (Ticker: BLMN) is a prominent player in the casual dining industry, owning and operating several well-known restaurant chains globally, including Outback Steakhouse, Carrabba's Italian Grill, Bonefish Grill, and Fleming's Prime Steakhouse & Wine Bar. Founded in 1988, headquartered in Tampa, Florida, the company has established a significant presence in the United States and has expanded its operations to numerous other countries. Bloomin' Brands has focused on delivering high-quality dining experiences, innovative menu offerings, and exceptional customer service to differentiate itself in a competitive market. Financially, BLMN has shown resilience and adaptability, navigating through various market challenges, including fluctuating commodity prices and changing consumer dining preferences. The company's strategic focus on expanding its digital and delivery capabilities has also played a critical role in adapting to the evolving landscape of the restaurant industry. Bloomin' Brands' commitment to operational excellence and strategic growth initiatives positions it uniquely to capitalize on market opportunities and drive shareholder value.
| Address | 2202 North West Shore Boulevard Suite 500 | City | Tampa | State | FL |
| Zip | 33607 | Country | United States | Phone | 813 282 1225 |
| Website | https://www.bloominbrands.com | Industry | Restaurants | Sector | Consumer Cyclical |
| CEO & Director Name | Mr. David J. Deno | CEO Age | 65 | CEO Total Pay | $1,901,599 |
| CFO Name | Mr. Christopher Adkins Meyer | CFO Age | 51 | CFO Total Pay | $849,933 |
| COO of Casual Dining Restaurants Name | Mr. Gregg D. Scarlett | COO Age | 61 | COO Total Pay | $1,172,430 |
| Previous Close | $27.87 | Open | $28.00 | Day Low | $26.66 |
| Day High | $28.03 | Volume | 1,791,341 | Market Cap | $2,356,131,840 |
| 52 Week Low | $22.03 | 52 Week High | $28.75 | Dividend Rate | $0.96 |
| Dividend Yield | 0.0344 | Payout Ratio | 0.375 | Beta | 2.03 |
| Volume | 1,791,341 | Average Volume | 1,212,885 | Market Cap | $2,356,131,840 |
| Shares Outstanding | 86,814,000 | Profit Margins | 0.05296 | EBITDA | $547,871,296 |
| Total Debt | $2,136,861,056 | Total Revenue | $4,671,470,080 | Net Income to Common | $247,386,000 |
| Trailing EPS | 2.56 | Forward EPS | 2.8 | Revenue Growth | 0.091 |
| Gross Margins | 0.17347 | EBITDA Margins | 0.11728 | Operating Margins | 0.07644 |
| Sharpe Ratio | 0.2414001576743043 | Sortino Ratio | 4.211224924163694 |
| Treynor Ratio | 0.07838415513492286 | Calmar Ratio | 0.33901142920996946 |
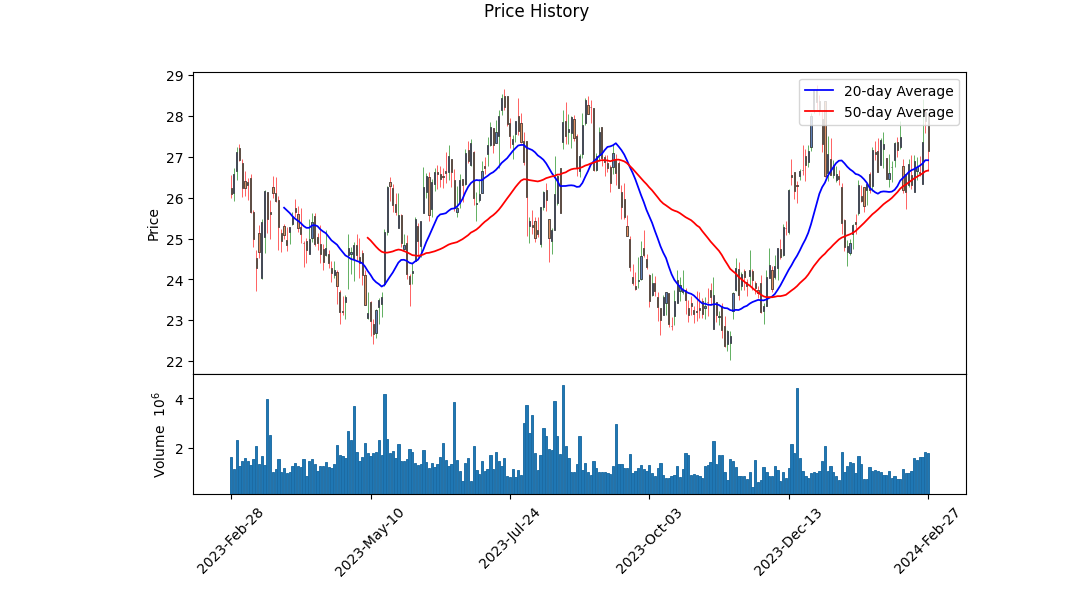
Analyzing the provided technical, fundamental, and financial data for BLMN reveals a comprehensive insight into the possible stock price movement in the coming months. The technical analysis data showcases a notable trend with the stock's open price increasing over the observed period, leading to a clear uptrend on the surface. Particularly, the movement from an opening price of $23.31 to a high of $28.17 indicates bullish market sentiment. However, the absence of MACD histogram values for a certain period hints at potential volatility or the establishment stage of the trend, making it crucial to monitor further development.
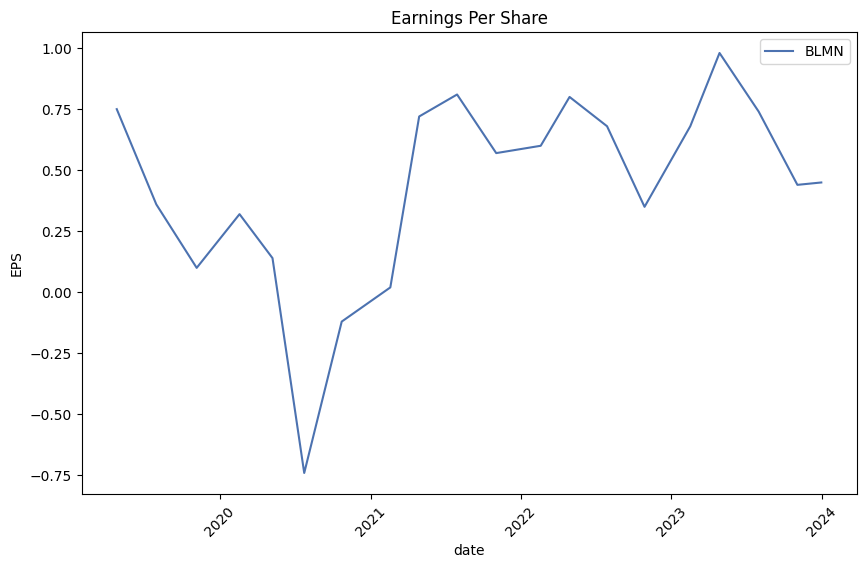
The fundamentals bolster this outlook with a robust set of numbers presenting a company in transition. Noteworthy is the earnings history, which has consistently beaten estimates, demonstrating strength in operational performance. Analyst expectations are optimistic, with a projection of earnings growth next year. This optimism is supported by a stable growth estimate for the next five years, albeit modest at 2.4%. Despite a current year downturn in earnings growth, analysts expect a rebound which aligns with the improving technical outlook.
On the balance sheet front, the net debt reduction reflects positively on the company's financial health, decreasing from $926.5 million to $748.557 million. This reduction in leverage coupled with substantial free cash flow growth from $51 million to $171.231 million illustrates a strengthening balance sheet and enhancing liquidity, vital indicators for future expansion and sustainability.
The ratifications of returns on investment, such as the Sharpe and Sortino ratios, depict moderate risk-adjusted returns. Despite this, the Calmar ratio indicates a commendable return compared to maximum drawdowns, suggesting resilience in downturns. Furthermore, the current stock's performance vis-a-vis its fundamentals places the company in a position to continue this uptrend, supported by improving financial health and operational efficiency.
Considering the amalgamation of improving fundamentals, a strengthening balance sheet, and positive technical signals bolstered by analyst optimism, it is plausible to foresee BLMN's stock maintaining its uptrend in the forthcoming months. Key indicators to watch would include maintaining or accelerating earnings growth, further debt reduction, and continued positive cash flow generation, which will provide additional substance to the stock's upward trajectory. Investors should, however, keep an eye on broader market dynamics and specific company news, which may influence stock performance.
| Statistic Name | Statistic Value |
| R-squared | 0.318 |
| Adj. R-squared | 0.318 |
| F-statistic | 585.1 |
| Prob (F-statistic) | 2.14e-106 |
| Log-Likelihood | -3151.7 |
| No. Observations | 1256 |
| AIC | 6307. |
| BIC | 6318. |
| Const | -0.0001 |
| Beta | 1.5408 |
| Alpha | -0.00013997572152178207 |
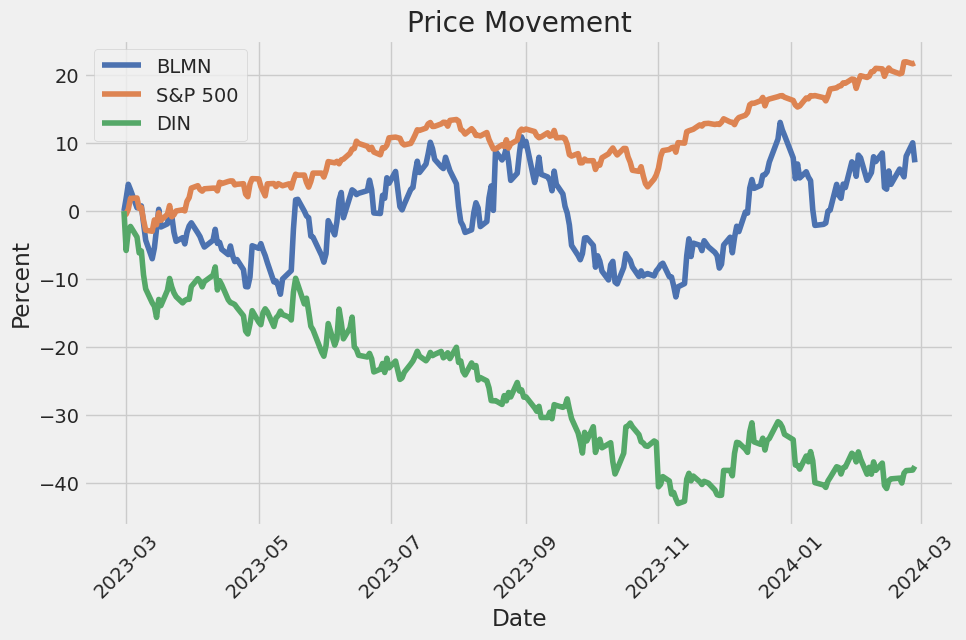
The analysis of the linear relationship between BLMN and SPY reveals a not-so-strong correlation as indicated by an R-squared value of 0.318. This implies that around 31.8% of the variability in BLMN can be explained by its relationship with SPY. The coefficient for SPY (beta) is 1.5408, suggesting that for every one-unit increase in SPY, BLMN is expected to increase by approximately 1.5408 units, holding other factors constant. However, this comes with an almost negligible alpha (intercept) of -0.00013997572152178207, indicating that when SPY is zero, BLMN is expected to have a minuscule decrease in value, almost approaching zero.
This relationship's statistical significance is supported by a very low Prob (F-statistic) value of 2.14e-106, suggesting that the model is highly unlikely to be an occurrence of random chance. Nonetheless, the presence of a small alpha value in this model indicates that BLMN's performance is not significantly independent of SPY's performance but rather closely tied. This becomes particularly noteworthy for investors looking at BLMN in relation to the overall market trends represented by SPY. The beta value underscores BLMNs responsiveness to the market, making it an essential factor for portfolio allocation decisions, especially for those aiming to balance or leverage market movements.
During the Bloomin' Brands Fiscal Fourth Quarter 2023 Earnings Conference Call, the management team, including CEO David Deno and CFO Chris Meyer, presented the company's financial performance and strategic priorities. Adjusted Q4 2023 diluted earnings per share were reported at $0.75, reflecting a 10% growth year-over-year. Despite a slight decline in U.S. comparable sales by 20 basis points, the company experienced sequential improvement from the third to the fourth quarter, ending the year with strong holiday season sales. Two standout performers, Carrabba's and the Brazilian operations, were highlighted for their exceptional sales and traffic growth, with new initiatives like Carrabba's Bistro contributing to their success.
The company outlined its strategic priorities for 2024, focusing on driving in-restaurant same-store sales growth, particularly for Outback Steakhouse, and enhancing the customer experience through investments in new restaurant openings, maintaining off-premises momentum, and becoming a more digitally-driven company. Outback's marketing strategy, including the "No Rules, Just Right" campaign and an increase in advertising spend, was discussed as key factors in improving brand positioning and driving traffic. Operational improvements, such as investments in server handhelds and new kitchen equipment, have led to significant customer service enhancements.
Bloomin' Brands addressed its development strategy, noting plans to open 40 to 45 new restaurants across its portfolio in 2024. This includes continuing efforts to refresh existing assets through remodels and relocations, which have historically resulted in outsized sales lifts. The closure of 41 underperforming locations was also announced, on which the company anticipates a positive impact on profitability, despite the removal of approximately $100 million in revenue.
Financial performance for the fourth quarter included total revenues of $1.19 billion, up 9% from the previous year, driven by various factors including a 53rd week of sales and favorable foreign exchange translation. The company foresees U.S. comparable restaurant sales to be flat to 2% for 2024, with an adjusted diluted earnings per share expectation between $2.51 and $2.66. Despite challenges such as commodity inflation, particularly for beef, and ongoing investments in operational and digital infrastructure, Bloomin' Brands remains committed to its strategic priorities and believes in its ability to drive growth and profitability moving forward.
Cash Flow Activities
Operating Activities For the thirty-nine weeks ended September 24, 2023, cash provided by operating activities amounted to $373.6 million, a notable increase from the $292.6 million recorded in the similar period of 2022. The rise in operating cash flow was largely a result of improved net income as well as adjustments for non-cash items like depreciation and amortization, provision for impaired assets and restaurant closings, and a series of changes in working capital components. This positive cash flow is essential for supporting the company's daily operations, expansion initiatives, and its ability to handle financial obligations.
Investing Activities During the thirty-nine weeks ended September 24, 2023, Bloomin Brands used $225.5 million in investing activities, mostly on capital expenditures for restaurant development and technology projects. This represents an increased outflow when compared to $121.5 million used in the same period of 2022, indicating a strategic investment in the business's growth and infrastructure. Such investments are crucial for sustaining competitive advantages and promoting long-term profitability.
Financing Activities Net cash used in financing activities for the thirty-nine weeks ended September 24, 2023, was $147.5 million, driven primarily by repayments of borrowings on revolving credit facilities and repurchase of common stock. Although these activities reflect a healthier balance sheet through debt reduction and share buyback programs which can enhance shareholder value, they also indicate a substantial use of cash resources that reduces the liquidity available for other purposes.
Leverage and Credit Facilities Bloomin Brands' financial structure during this period includes various credit facilities and convertible senior notes which influence the company's leverage and flexibility. Compliance with the covenants of these credit agreements, such as the senior secured credit facility and convertible senior notes, is essential for maintaining financial stability and operational freedom.
Cash Reserves and Repatriation The companys cash reserves, including the portion held by foreign affiliates, and its approach to the management and repatriation of international earnings, show strategic financial management. The availability of cash across jurisdictions supports Bloomin Brands' global operations and strategic investments while providing some insight into the company's tax strategy in response to changes in U.S. tax law.
Investor Return Programs The declaration of dividends and repurchase of shares demonstrate Bloomin Brands' commitment to returning value to shareholders. These activities are critical components of the companys capital allocation strategy, aiming to balance growth investments with direct investor returns, though they do consume financial resources that could be used for other strategic purposes.
Overall, Bloomin Brands' financial activities throughout the thirty-nine weeks ended September 24, 2023, encompass a range of operational, investment, and financing actions that reflect its strategic priorities, including growth investments, balance sheet management, and shareholder returns. The companys approach to managing cash flows and leveraging financial instruments plays a critical role in navigating the competitive restaurant industry landscape while aiming for sustainable growth and profitability.
Bloomin' Brands, Inc., encapsulated within the casual dining sector, graciously unfolds a narrative punctuated by strategic decisions, corporate maneuvers, and an overarching aim for fiscal solidity and growth. This multifaceted exploration navigates through the intricacies of financial reporting, strategic investments, and adjustments shaped against the terrain of the restaurant industry's competitive and economic pressures. With its portfolio boasting brands like Outback Steakhouse, the company's journey through fiscal 2023 into 2024 unveils aspects pivotal to understanding its market positioning and the potential pathways for shareholder value enhancement.
The involvement of Starboard Value LP marks a particularly salient chapter in the company's recent history. Known for advocating strategic realignments and operational efficiencies, Starboards entrance is portrayed as a harbinger of potential growth and profitability uplift. This collaboration aligns with a broader narrative of corporate reevaluation and restructuring, aiming at trimming inefficiencies and augmenting the consumer experience, thereby setting a foundation for sustainable competitive advantage and shareholder returns.
Financially, the year 2023 served as a litmus test for the effectiveness of implemented strategies and the resilience of Bloomin' Brands amidst market volatilities. Reporting a revenue upsurge of 9.1% in the fourth quarter, juxtaposed with a nuanced reduction in diluted EPS, paints a picture of a company at the intersection of growth and recalibration. The structural changes, including the "53rd week" adding a layer of peculiarity to fiscal 2023's narrative, and strategic closures reflect a heartfelt endeavor towards operational optimization.
Quarterly dividends, culminating in an annual yield that intriguingly positions Bloomin' Brands above the industry average, accentuate the companys commitment to returning value to shareholders. While the history of dividend payments narrates a tale of fluctuations, the current dividend gesture underscores confidence in the company's underlying financial health and its future cash flow prospects.
The outlining of fiscal 2024s road map, underpinned by forecasts of flat to 2% growth in U.S. comparable restaurant sales and a projected EPS that suggests prudent optimism, encapsulates Bloomin' Brands' strategy of navigating through inflationary headwinds and competitive encumbrances with a clear focus on growth and efficiency. The tactical emphasis on enhancing the in-restaurant experience, leveraging digital initiatives for outreach and operational efficacy, and strategic restaurant openings, signals a conscious endeavor to perpetuate growth and market relevance.
Moreover, the commitment to a $350 million share repurchase authorization alongside quarterly cash dividends not only fortifies the narrative of shareholder value prioritization but also signals a robust balance sheet and a strategic blueprint aimed at financial performance optimization.
Encumbered yet undeterred by the challenges of commodity inflation and the imperative of maintaining a cautious pricing strategy, particularly within the Outback Steakhouse brand, the leadership navigates with a defined clarity towards ameliorating the guest experience. This commitment, projected through planned capital expenditures and restaurant openings, reflects an integral belief in the brand's attractiveness and the viability of its growth trajectory amidst evolving market dynamics.
The sit-down dining segment, inherently marked by its competitive intensity, sees Bloomin' Brands grappling not only with peers but also with fast-casual and quick-service formats vying for consumer patronage. In this contested space, the company's strategic decisions, from closures to digital initiatives and market positioning maneuvers, underscore a delicate balance between growth, efficiency, and the quintessence of dining experience enhancement.
In essence, Bloomin' Brands stands at a pivotal juncture, where strategic foresight, operational adjustments, and financial stewardship converge to script the ensuing chapters of growth and market positioning. The narrative, rich with strategic interventions, financial recalibrations, and an overarching emphasis on guest experience and shareholder value, delineates a pathway where challenges and opportunities coexist, guiding the company's march into fiscal 2024 and beyond.
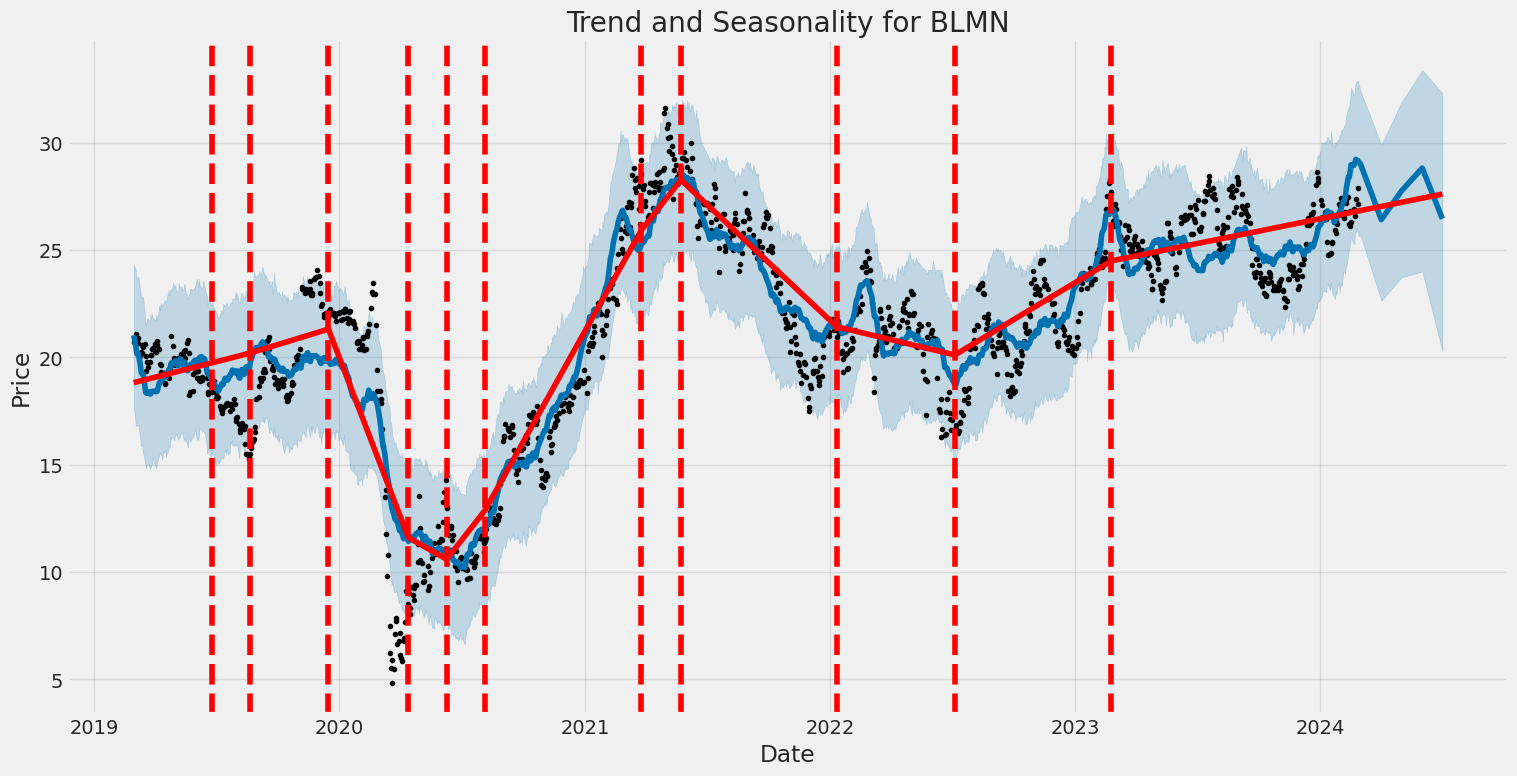
To summarize the volatility of Bloomin' Brands, Inc. (BLMN) between March 1, 2019, and February 27, 2024, we can say that the stock experienced significant fluctuations. The statistical analysis, specifically the ARCH model, indicates a high coefficient for volatility, suggesting that BLMN's stock price showed substantial variability during this period. This is further emphasized by the alpha coefficient, which measures the influence of past volatility on future volatility, being notably high. In simpler terms, BLMN's stock was not just volatile, but its volatility tended to influence future price movements significantly.
| Statistic Name | Statistic Value |
|---|---|
| Log-Likelihood | -3213.37 |
| AIC | 6430.74 |
| BIC | 6441.02 |
| No. Observations | 1256 |
| omega | 6.4301 |
| alpha[1] | 0.5601 |
To begin analyzing the financial risk associated with a $10,000 investment in Bloomin' Brands, Inc. (BLMN) over a one-year period, we employ a two-pronged approach that integrates volatility modeling and machine learning predictions. This allows for a multifaceted understanding of the stock's behavior, providing insights into both its historical volatility and the predictive future returns.
Volatility modeling, the first component of our analysis, is crucial for comprehending the inherent variability in Bloomin' Brands, Inc.'s stock price. By examining past price fluctuations, this method helps in estimating how widely the stock price might vary under normal trading conditions. It does so by capturing the persistent, dynamic nature of the stock's volatility, which is essential for assessing the level of risk an investor might face. In practical terms, it translates complex stock price movements into understandable risk metrics, offering a foundation upon which investment decisions can be grounded. Specifically, for Bloomin' Brands, Inc., this model gauges the degree to which the stock's returns deviate from their historical average, thereby forecasting potential price volatility over the upcoming year.
Machine learning predictions represent the second pillar of our analysis. We utilize an advanced algorithm that learns from historical data to predict future stock returns. The role of this strategy is to analyze vast datasets, identifying patterns that might elude traditional analysis methods. This predictive model, by employing historical price data and various market indicators, offers forecasts on future returns, taking into consideration the multifaceted aspects that could affect stock prices. This foresight is invaluable for investors, providing them with a data-driven estimate of what the returns on Bloomin' Brands, Inc. could look like over the next year.
When combined, these two analytical techniques provide a comprehensive picture of both the historical volatility and expected future performance of Bloomin' Brands, Inc.'s stock. Particularly, the calculated Value at Risk (VaR) at a 95% confidence interval stands as a key metric for assessing financial risk. VaR is a statistical measure that estimates the maximum loss an investment might experience with a given confidence level. For a $10,000 investment in Bloomin' Brands, Inc., the annual VaR at a 95% confidence level has been calculated to be $332.86. This figure signifies that, with 95% certainty, one can expect the maximum potential loss over the course of a year not to exceed $332.86 under normal market conditions.
This integration of volatility modeling and machine learning predictions thus not only delineates the potential financial risk involved in investing in Bloomin' Brands, Inc. but also exemplifies the effectiveness of employing both historical and predictive analytics in investment decision-making. By understanding the calculated VaR, investors are better positioned to gauge the level of risk they are exposed to, enabling more informed strategic decisions.
Analyzing the provided options chain for Bloomin' Brands, Inc. (BLMN) call options, our goal is to ascertain the most profitable options, especially considering the target stock price to be 5% over the current stock price. To achieve this, we will delve into the details and interpret the Greeks - Delta, Gamma, Vega, Theta, and Rho, along with other relevant metrics such as strike price, days to expiration, premium, ROI, and profit.
Starting with the options that have a shorter time to expire (15 days), let's consider the available strikes. The call option with a strike of $25.00 catches our attention due to its high ROI of 0.7485 and profit of $1.497. Despite its relatively lower Delta of 0.7139061008 compared to others in the nearer term, its high ROI and Gamma of 0.0730405163 suggest that it has a decent probability of ending in the money with a significant rate of change in its Delta, making it potentially very profitable if the stock's price moves favorably.
Next, examining options with a medium term to expiry (50 days), the option with a strike of $22.50 stands out. This option has a Delta of 0.9545641849, indicating a strong likelihood of finishing in-the-money, and a significant profit potential of $2.397 with an ROI of 0.6658333333. The relatively lower Vega (0.87771836) might suggest less sensitivity to implied volatility changes, which could be advantageous in a stable to bullish market.
For longer-term options (295 days to expiration), the call option with a strike of $22.50 becomes very interesting due to its advantageous mix of Greeks and metrics. It showcases a robust Delta of 0.7994220644, indicating a high likelihood of being in-the-money by expiration. Moreover, its substantial Rho of 13.2025220573 indicates a high sensitivity to interest rate changes, which could amplify its profitability in a rising rate environment. With an ROI of 0.7085470085 and a high profit of $2.487, it presents a compelling case for investors looking for longer-term call options with high profitability.
On a strategic note, the option with a strike of $22.50 and a 295-day expiration is particularly notable for its balance between time to expiration and its potential for profitability in a bullish scenario. Its strong Delta and significant Rho suggest that it stands to benefit greatly from upward movements in the underlying stock price and potential interest rate hikes, respectively, making it an attractive option for investors with a longer-term outlook and a bullish stance on Bloomin' Brands.
In conclusion, while each of these options presents its unique opportunities depending on the investor's time horizon and market outlook, the call option with a $22.50 strike price expiring in 295 days appears to offer a compelling balance of high potential returns, sensitivity to market movements, and longer duration to ride out any price volatility in Bloomin' Brands, Inc. stock. Investors should consider their risk tolerance, market outlook, and the Greeks' insight when choosing the most suitable option for their portfolio.
Similar Companies in Restaurants:
Dine Brands Global, Inc. (DIN), BJ's Restaurants, Inc. (BJRI), Ruth's Hospitality Group, Inc. (RUTH), The Cheesecake Factory Incorporated (CAKE), Brinker International, Inc. (EAT), Chuy's Holdings, Inc. (CHUY), Denny's Corporation (DENN), Jack in the Box Inc. (JACK), Darden Restaurants, Inc. (DRI), Cracker Barrel Old Country Store, Inc. (CBRL), Texas Roadhouse, Inc. (TXRH)
https://finance.yahoo.com/news/bloomin-brands-blmn-reports-q4-070103842.html
https://finance.yahoo.com/news/bloomin-brands-announces-2023-q4-114500904.html
https://finance.yahoo.com/news/bloomin-brands-nasdaq-blmn-posts-115409075.html
https://finance.yahoo.com/news/bloomin-brands-inc-blmn-reports-120211797.html
https://finance.yahoo.com/news/bloomin-brands-q4-earnings-snapshot-120523048.html
https://finance.yahoo.com/news/bloomin-brands-blmn-tops-q4-125502636.html
https://finance.yahoo.com/news/bloomin-brands-inc-nasdaq-blmn-133225271.html
https://finance.yahoo.com/news/bloomin-brands-nasdaq-blmn-due-103540306.html
https://www.sec.gov/Archives/edgar/data/1546417/000154641723000120/blmn-20230924.htm
Copyright © 2024 Tiny Computers (email@tinycomputers.io)
Report ID: xYoSC9
Cost: $0.73860
https://reports.tinycomputers.io/BLMN/BLMN-2024-02-28.html Home