CAVA Group, Inc. (ticker: CAVA)
2024-04-11
 CAVA Group, Inc., listed under the ticker symbol CAVA, operates as a fast-casual restaurant chain focusing on Mediterranean cuisine in the United States. The brand has gained popularity for its customizable salads, grain bowls, and pitas, featuring fresh ingredients and bold flavors. Founded by Ted Xenohristos, Ike Grigoropoulos, and Dimitri Moshovitis in 2011, CAVA emphasizes healthy and innovative food choices, aligning with current consumer trends towards nutritious and convenient dining options. The company implemented a significant expansion strategy, acquiring Mediterranean chain Zoes Kitchen in 2018, which notably increased its footprint and market reach. CAVA's operational strategy focuses on high-traffic urban areas, leveraging consumer preferences for fast service and high-quality ingredients, which plays a crucial role in its competitive positioning within the fast-casual segment of the restaurant industry.
| Full Time Employees | 8,100 | Previous Close | 60.28 | Open | 59.7 |
| Day Low | 59.22 | Day High | 63.81 | Market Cap | 7,260,787,200 |
| Fifty-Two Week Low | 29.05 | Fifty-Two Week High | 71.6 | Fifty Day Average | 58.693 |
| Two Hundred Day Average | 44.6252 | Volume | 3,638,991 | Net Income to Common | 13,280,000 |
| Revenue | 728,700,032 | Debt to Equity | 58.899 | Revenue Per Share | 12.042 |
| Return on Assets | 0.012519999 | Return on Equity | 0.03385 | Revenue Growth | 0.364 |
| Sharpe Ratio | 1.1088074443328526 | Sortino Ratio | 18.012440138011836 |
| Treynor Ratio | 0.32697772434271427 | Calmar Ratio | 1.8318628960943455 |
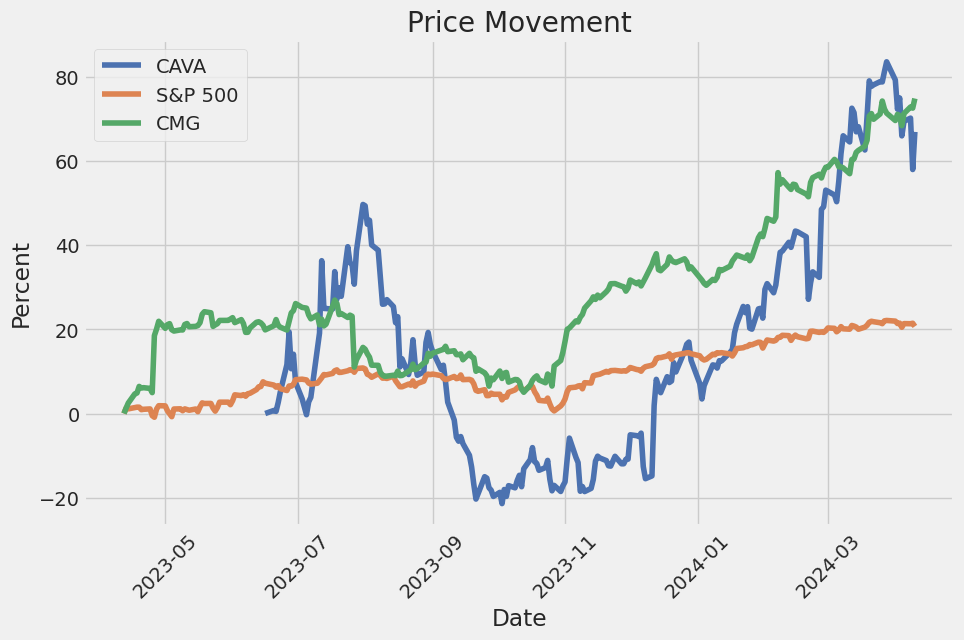
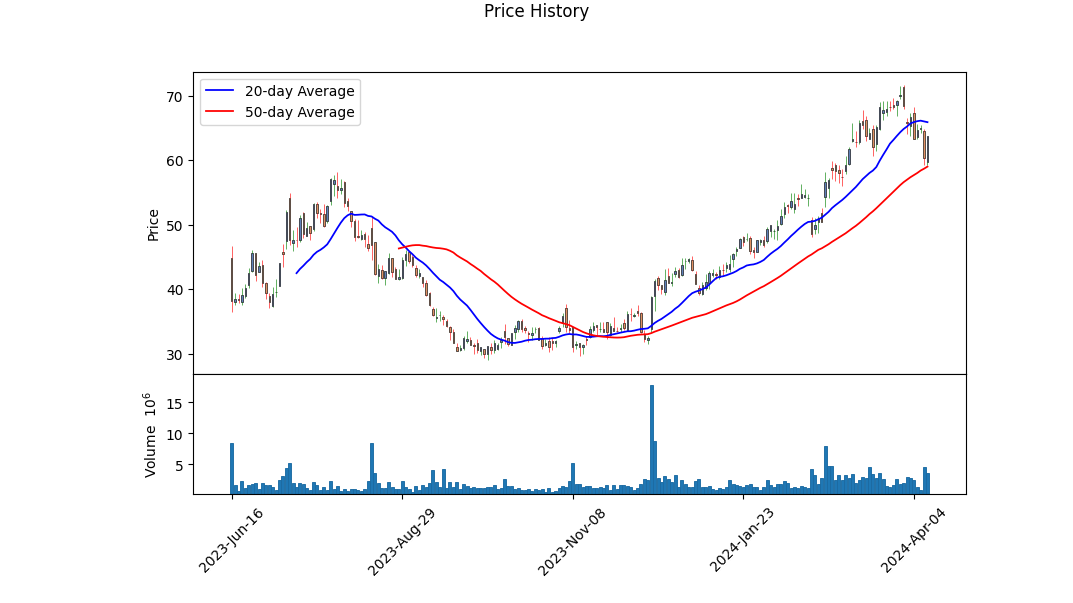
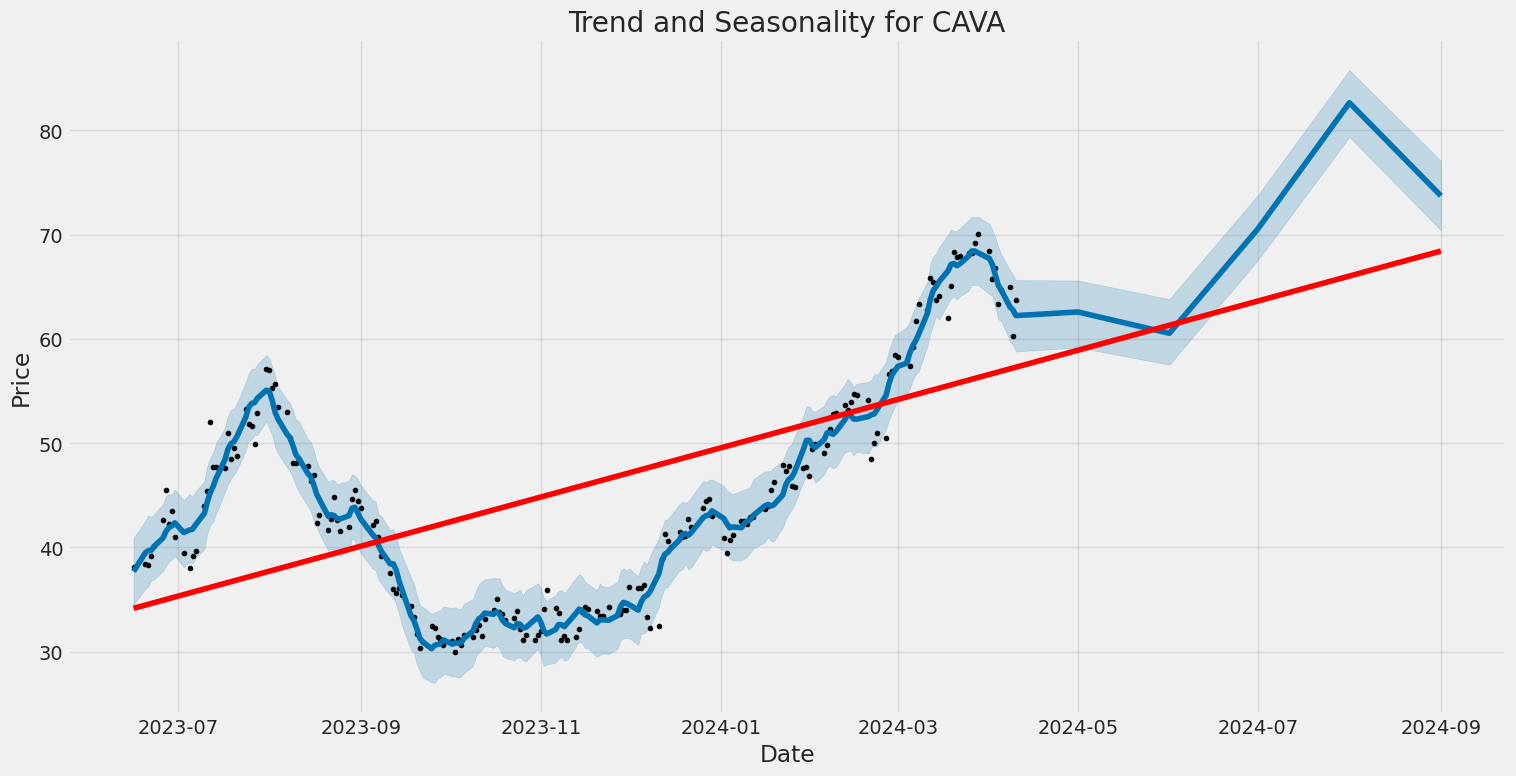
Analyzing the current financial and market data for CAVA, several key indicators and ratios provide a comprehensive view of the company's financial health and expected performance. The recent technical data highlights a significant uptrend in the stock price over the last several months, despite some volatility. With the Open price moving from $38.90 to $64.55 and peaking at $67.35, the overall trend showcases robust growth.
Delving into the technical indicators, the MACD histogram, although negative in the recent data points, reflects a trend where the market momentum has been substantial enough to drive up the stock price. This implies that the current pullback may be temporary, or simply a market correction in an otherwise upward trend.
The fundamental data reveals that CAVA has been working on improving its margins with an operating margin approximating break-even and a decent EBITDA margin. This financial improvement, depicted in the reduction of net income losses and an increase in normalized income and EBITDA, suggests an operational turnaround.
The balance sheet analysis indicates a strong liquidity position, with significant growth in cash and cash equivalents. This increased liquidity enhances the company's ability to manage short-term obligations and invest in growth activities. The substantial equity raise and controlled debt levels further stabilize the financial structure, reducing risk and potentially improving investor confidence.
Risk-adjusted performance ratios such as the Sharpe, Sortino, Treynor, and Calmar ratios each tell a compelling narrative of high returns adjusted for the respective risks, with particularly high Sortino and Calmar ratios indicating strong upward potential adjusted for downside volatility and severe losses, respectively.
The company's strategic maneuvers can be inferred from the cash flow statements, where the capital expenditures point towards aggressive expansion or upgrading operations, funded by robust financing activities.
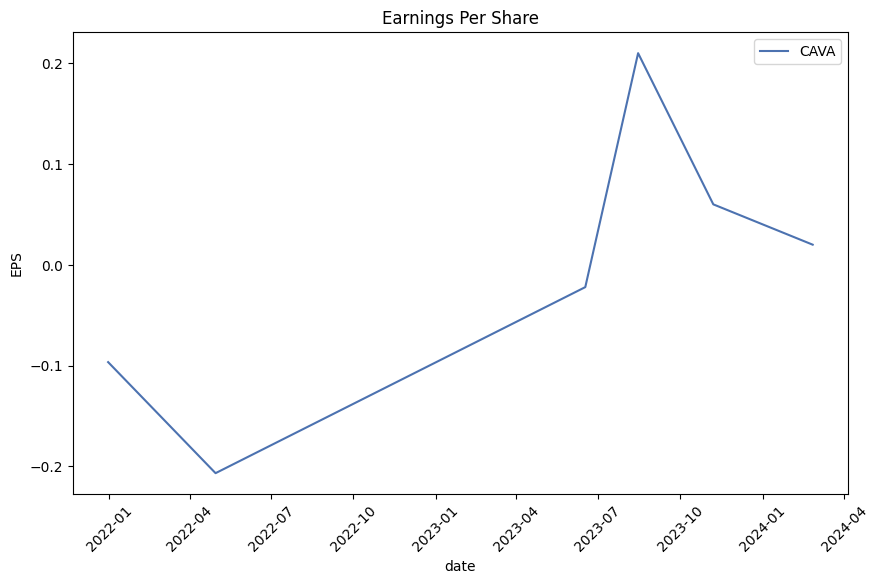
Considering the analyst expectations, there's a consensus on solid earnings growth going forward, underpinned by a positive adjustment in EPS estimates over time. Analysts forecast a substantial year-on-year growth in revenues, highlighting expected operational efficiencies or market expansion.
Combining these insights, the outlook for CAVA in the following months is cautiously optimistic. The company exhibits strong fundamentals with improved financial handling, robust market performance, and a promising growth trajectory as per analyst expectations. Investors might expect continued growth albeit with potential volatility, which should be navigable with prudent risk management strategies.
In our analysis of CAVA Group, Inc. (CAVA), we have assessed key financial metrics to evaluate its investment potential, focusing on the return on capital (ROC) and earnings yield, as suggested by the methodologies in "The Little Book That Still Beats the Market." The ROC, which stands at 3.301%, implies that for every dollar CAVA invests in its capital, it generates about 3.3 cents in profits. This indicates a relatively low efficiency in using its capital to produce income, which can be a point of concern when compared to industry peers. On the other hand, the earnings yield for CAVA is calculated to be approximately 0.345%, derived from the inverse of the price-earnings ratio. This metric suggests that for every dollar invested in the purchase of CAVA's stock, an investor would earn about 0.345 cents, highlighting a low yield which may not attract investors seeking immediate returns through earnings. Both metrics are crucial for evaluating CAVA's financial health and operational efficiency and suggest a careful review when considering this stock for investment.
In evaluating CAVA Group, Inc. (CAVA) using Benjamin Grahams criteria for stock selection, we can analyze its financial metrics and compare them to the principles outlined in "The Intelligent Investor."
-
Price-to-Earnings (P/E) Ratio: CAVA has a P/E ratio of -293.95. Given that a negative P/E ratio implies that the company is currently unprofitable (negative earnings per share, EPS), CAVA does not meet Grahams criteria of favoring stocks with low but positive P/E ratios, especially when compared to industry averages. Unfortunately, no specific industry P/E ratio is provided for a more detailed comparison, but generally, a significantly negative P/E indicates financial challenges or atypical conditions not congruent with Grahams preference for stable, profitable companies.
-
Price-to-Book (P/B) Ratio: CAVAs P/B ratio stands at 6.844. Graham typically sought stocks trading below their book value, i.e., a P/B less than 1.0. A P/B ratio of 6.844 significantly exceeds this threshold, suggesting that the market is pricing CAVA well above its book value, possibly due to growth expectations or intangible assets, thus not aligning with the value investing principles of buying undervalued stocks.
-
Debt-to-Equity Ratio: CAVAs debt-to-equity ratio is 0.589, which indicates that for every dollar of equity, there is approximately 59 cents of debt. This demonstrates a manageable level of debt but it is essential to assess this in comparison to industry standards. Graham preferred companies with low debt-to-equity ratios to lower financial risk, though CAVAs ratio might be considered reasonable depending on sector benchmarks.
-
Current Ratio and Quick Ratio: Both the current and quick ratios for CAVA are 3.255, indicating robust short-term financial health. These ratios suggest that CAVA has more than sufficient current assets to cover its current liabilities, which aligns well with Grahams emphasis on strong, liquid balance sheets. These high ratios could be seen as a positive in Grahams analysis framework, indicating low liquidity risk.
-
Earnings Growth: While specific annual earnings growth figures are not provided in the data snapshot, the negative P/E ratio suggests recent struggles with profitability. Graham valued consistent earnings growth over several years as indicative of a companys stable financial and operational health. Without consistent earnings growth, CAVA might not fit into Grahams criteria effectively.
In conclusion, CAVA Group, Inc., based on the provided metrics, does not entirely fit the stringent criteria set by Benjamin Graham for value investing. The negative P/E raises concerns about current profitability, and the high P/B ratio suggests overvaluation relative to book value. While the company shows strong liquidity, Grahams combined emphasis on earnings stability, valuation metrics, and financial risk would likely lead him to be cautious about investing in CAVA based on the available data. Additional context, such as industry performance and broader market conditions, might further inform an investment decision.Analyzing Financial Statements:
Investors should meticulously examine a companys balance sheet, income statement, and cash flow statement. Graham puts a strong emphasis on understanding a companys assets, liabilities, earnings, and cash flows, as these provide invaluable insights into the financial health and operational efficiency of a business.
1. Balance Sheet Analysis:
The balance sheet reflects a companys financial position at a specific point in time, detailing assets, liabilities, and shareholders equity. Graham advised investors to look for companies with strong balance sheets, characterized by a high ratio of assets to liabilities, which can provide a margin of safety. Key components to examine include:
- Current Assets vs. Current Liabilities: This helps in understanding the liquidity position of the company through metrics such as the current ratio and quick ratio.
- Long-term Debt Levels: Companies with manageable levels of long-term debt are typically more stable.
- Equity Position: A strong equity base supports growth and ensures the company can withstand financial distress.
2. Income Statement Analysis:
The income statement shows how the business performed over a period of time, reporting revenues, expenses, and profits. Graham emphasized earnings stability and growth as indicators of a reliable investment. Investors should focus on:
- Revenue Trends: Consistent revenue growth is a good indicator of a companys market position and operational success.
- Profit Margins: Healthy and improving margins can indicate effective cost management and pricing strategy.
- Earnings Consistency and Growth: Erratic earnings can be a red flag, whereas steady and incremental growth is typically a sign of a sound business model.
3. Cash Flow Statement Analysis:
Cash flow statements report the cash generated and used during a period. Unlike earnings, cash flows are harder to manipulate, making them a critical area of focus for investors following Graham's principles. Key points include:
- Operating Cash Flow: Positive cash flow from operations is essential as it indicates that the core business activities are generating sufficient cash to sustain the business.
- Investment Cash Flows: This reflects the companys strategy in terms of capital expenditure, acquisitions, and asset sales.
- Financing Cash Flows: Changes in debt and equity can signal managements confidence in the businesss future prospects.
4. Historical Comparisons and Industry Averages:
Comparing these financial metrics against historical company performance and industry averages can provide additional context. This helps in distinguishing between industry trends and company-specific issues, thus enabling a more informed investment decision.
5. Valuation Metrics:
After a thorough examination of the financial statements, valuation is the next step. Using ratios like Price to Earnings (P/E), Price to Book (P/B), and Debt to Equity can help in assessing whether the stock is priced appropriately given its financial health and growth prospects.
In summary, Benjamin Grahams approach to analyzing financial statements centers on identifying companies with a solid financial standing and predictable performance. By rigorously evaluating a companys financial documents in the manner described, investors can better gauge the intrinsic value of a stock and make investment decisions that conform to the principles of value investing. This process not only helps in identifying potentially successful investments but also in avoiding substantial losses.Dividend Record: As per Benjamin Graham's investing philosophy articulated in "The Intelligent Investor", focusing on companies that have consistently paid dividends is crucial. Examining the provided data for the company symbolized as 'CAVA', it is noted that there is no historical dividend data available (i.e., 'historical': []). This absence indicates that 'CAVA' has not paid dividends historically, or the data is incomplete. This lack of a dividend record would typically make 'CAVA' less attractive as an investment opportunity under the criteria set forth by Graham, assuming investors prioritize dividend consistency in line with his teachings.
| Statistic Name | Statistic Value |
| Alpha () | 0.1607 |
| Beta () | 2.0215 |
| R-squared | 0.135 |
| Adjusted R-squared | 0.130 |
| F-statistic | 31.39 |
| Prob (F-statistic) | 6.84e-08 |
| Log-Likelihood | -553.84 |
| AIC | 1,112 |
| BIC | 1,118 |
| Observations | 204 |
The analysis of the linear regression model between CAVA and SPY, represented as the overall market, highlights that CAVA has a positive alpha of 0.1607. Although relatively moderate, this alpha value suggests that CAVA, on average, outperformed the market by 0.1607 points, holding other factors constant. This could be indicative of CAVA having intrinsic value different from what could be predicted solely by market movements. Additionally, the model's statistical measures such as an R-squared of 0.135 and an adjusted R-squared of 0.130 suggest that approximately 13.5% of the variability in CAVA's performance can be explained by the model through its relationship with SPY. This points to other factors beyond just market influence shaping CAVA's stock movements.
The beta coefficient of 2.0215 indicates a high sensitivity of CAVA's returns relative to SPY, implying that for every 1% change in the market, CAVA's returns change by approximately 2.02%. This leverage effect underlines CAVAs volatile nature compared to the market. The statistical significance of the beta coefficient, as indicated by a very low P-value (6.84e-08), confirms that the beta estimate is statistically significant and not due to random fluctuations. A Durbin-Watson statistic close to 2 suggests that there is no major issue with autocorrelation in the regression residuals, lending further credibility to the model results. The relatively large value of 31.39 for the F-statistic and its corresponding low P-value display strong overall model significance, meaning the relationship captured between CAVA and SPY in this model is statistically meaningful.
CAVA Group, Inc., a rapidly expanding Mediterranean cuisine restaurant chain, presented its fourth quarter and full-year earnings for 2023, underscoring a year of significant growth and strategic achievements. CEO Brett Schulman highlighted the company's expansion, with 72 new restaurants launched, resulting in a 30% growth in their footprint, and a positive trend in both revenue and restaurant traffic. Schulman pointed out the brand's increasing appeal across diverse demographics, which has supported CAVAs successful geographic expansion, now including 24 states plus the District of Columbia. The companys robust performance is partly attributed to its strategic focus on balancing innovative culinary experiences with health-conscious offerings, alongside maintaining value despite rising costs.
On the financial front, CAVA reported a remarkable increase in its revenues and profitability. Fourth-quarter revenues surged by 52.5% year-over-year to $175.5 million, driven by an 11.4% growth in same-restaurant sales. The increase in traffic, which accounted for a 6.2% rise, coupled with effective cost management strategies, notably in food and beverage expenses, significantly bolstered the profit margins. The full-year figures were equally impressive, with a near 60% rise in revenue and substantial growth in adjusted EBITDA and net income. CFO Tricia Tolivar provided detailed insights into the financial metrics and underscored the companys strong liquidity position, essential for sustaining expansion efforts.
The strategic initiatives for 2024 aim to build upon the current momentum, focusing on expanding 'The Mediterranean Way' through increased community presence and innovative culinary offerings, including the much-anticipated rollout of a new grilled steak option. The leadership emphasized ongoing efforts to enhance guest engagement through a revamped loyalty program and technological integration into daily operations, such as the connected kitchen initiative, which aims to improve operational efficiency through AI and data analytics. These efforts are expected to deepen customer relationships and drive consistent traffic, thereby supporting sustained growth.
Management also discussed their operational strategies, including the implementation of rigorous food safety protocols and the enhancement of team member training programs. These initiatives are part of CAVAs broader objective to ensure excellence in every aspect of the dining experience, supporting the brand's promise of high-quality, health-conscious dining options. The leadership team is confident that these strategic priorities, geared towards operational excellence and innovative growth, will fortify CAVAs market position as a leader in Mediterranean cuisine, aiming to reach a milestone of 1,000 restaurants by 2032.
CAVA Group, Inc., an innovative force in the fast-casual dining industry, specializes in Mediterranean cuisine and is charting a remarkable growth trajectory highlighted by several strategic initiatives and robust financial performance. The company's approach, which centers around a rapid expansion strategy and its focus on healthy, flavorful food options, positions it well among health-conscious consumers who value quality and convenience.
In the most recent financial disclosures, CAVA reported impressive year-on-year growth with revenue increasing by 36%, culminating in $177.1 million for the fourth quarter of 2023. This performance significantly exceeded Wall Street's expectations which had projected revenues close to $174 million. The company's net income turnaround to $2.05 million in the fourth quarteragainst a substantial loss in the prior yearmirrors a successful operational strategy and market acceptance of its offerings.
Along with its financial growth, CAVA has been advancing on its expansion plan with a commitment to open between 48 to 52 new locations in 2024. At the end of 2023, the group operated 309 locations, and it targets to boost this number significantly by 2032. This ambitious growth strategy aligns with the management's vision to replicate a success model akin to other renowned fast-casual chains while carving out a niche with its Mediterranean-focused menu.
The company's operational tactics are also noteworthy, especially in leveraging technology and workforce management. CAVA has effectively integrated advanced technology to streamline its operations and improve customer experience, which includes digital ordering systems that enhance customer interaction while gathering valuable consumer data used to personalize marketing strategies.
Particular emphasis has also been put on sustainability initiatives, aligning with current market trends that favor environmentally responsible companies. CAVA emphasizes reducing its carbon footprint by sourcing ingredients locally and employing eco-friendly packaging solutions, approaches that resonate well with today's more environmentally conscious consumers.
In conjunction with effective operational management, CAVA has demonstrated a strong capability in maintaining a high-profit margin level. The company's restaurant-level operating profit has shown resilience, reflecting robust internal efficiencies despite broader economic pressures that include rising labor and food costs.
Even as the company plans for a moderated pace of new openings in comparison to 2023's aggressive expansion, the projected steady rise in same-store sales underscores continued consumer interest and market penetration. This moderated growth strategy could be a conservative approach, ensuring sustainability while maintaining the momentum gained from the previous year's expansion.
Financial analysts and industry watchers have also highlighted CAVA's potential in filling a unique position within the fast-casual sector, drawing parallels with successful counterparts like Chipotle but distinguished by a focus on Mediterranean cuisine, considered one of the healthiest diets globally.
Another aspect of strategic importance is CAVA's workforce management. The company prides itself on offering competitive wages and benefits, a move that not only decreases turnover but also enhances overall productivity and morale. Such practices ensure high service levels and customer satisfaction, fostering greater brand loyalty and repeated business.
Looking ahead, CAVA's proactive measures in menu innovation and its exploration of new market areas, including potential openings in the Midwest, reflect an ongoing effort to diversify and adapt to changing consumer preferences. With a keen focus on delivering high-quality, healthy food options in a welcoming environment, the chain is set to cater to a broader audience, enhancing its growth prospects.
Indeed, CAVA Group, Inc. embodies a model of strategic resilience and innovative adaptability that other fast-casual establishments might well consider emulating. With a solid foundation laid in both operational excellence and strategic market positioning, coupled with a robust financial trajectory, CAVA is poised for substantial future growth, making it a compelling narrative in the fast-casual dining industry narrative.
The volatility of CAVA Group, Inc. (CAVA) from June 16, 2023 to April 10, 2024 has been notably erratic. The analysis, using an ARCH model, suggests that the returns of CAVA's stock exhibit significant fluctuations, indicated by a volatility coefficient (omega) of approximately 15.25. This high volatility level underscores the unpredictable nature of CAVA's stock returns during this period, making it potentially risky for investors who prefer stable returns.
| Statistic Name | Statistic Value |
|---|---|
| Mean Model | Zero Mean |
| Vol Model | ARCH |
| Log-Likelihood | -569.129 |
| AIC | 1142.26 |
| BIC | 1148.89 |
| No. Observations | 204 |
| omega | 15.2496 |
| alpha[1] | 0.0179 |
When assessing the financial risk of a $10,000 investment in CAVA Group, Inc. (CAVA) over the next year, the volatility modeling technique is instrumental in gauging the stock's price fluctuations. By understanding the inherent volatility, one can better forecast potential risk scenarios that may impact an investment's profitability. This model effectively captures the conditional variance in the stock returns, which can change over time in response to new information or market events.
Simultaneously, the machine learning predictions utilize historical price data and other relevant financial indicators to estimate future returns of CAVA Group, Inc.'s stock. By applying this prediction model, which can adaptively learn from past data points, the approach provides an informed projection of the stock's future performance. The model iteratively adjusts its predictions as it inputs new data, enhancing its accuracy and reliability over time.
One of the crucial aspects analyzed through these methodologies is the Value at Risk (VaR) which quantifies the maximum expected loss over a given period at a specific confidence level. For CAVA Group, Inc., a $10,000 investment's VaR at a 95% confidence interval is projected to be $622.60. This figure represents the potential financial loss that might not be exceeded with 95% certainty over one year. Thus, even in adverse market conditions, the likelihood of losses surpassing this amount within the specified period is relatively low (5%).
By integrating the insights from the volatility modeling regarding possible price variations and combining them with forward-looking estimates from machine learning predictions, investors are better equipped to comprehend the dynamic risk profile of CAVA Group, Inc. This integrated approach not only facilitates a deeper understanding of potential price changes and risk factors but also supports more strategic investment decisions based on quantifiable metrics like the VaR. Such a thorough analysis highlights the multifaceted aspects of risk and return, essential for managing a prudent investment in fluctuating markets.
Analyzing the Greeks and other metrics for CAVA Group, Inc. call options provides significant insights into the potential profitability of these options leading up to a target price that is 5% over the current stock price. The key factors considered are the strike price, days to expiration, delta, gamma, theta, rho, and vega.
Options with a higher delta are of particular interest as they are more sensitive to changes in the underlying stock's price, meaning they will gain value more rapidly as the stock price approaches and exceeds the strike price. For instance, options with strike prices at $17.5 expiring on April 19, 2024, and July 19, 2024, show deltas of 1.0. These options are likely to follow the stock price very closely, making them potentially highly profitable if the stock experiences considerable positive momentum.
Another critical Greek to consider is gamma, which measures the rate at which delta changes as the underlying stock price changes. Options with higher gamma can be advantageous as they indicate a greater rate of change in delta, hence profitability, as the stock approaches the strike price. Options with striking prices further from the current stock price sometimes have higher gammas. For example, an option with a strike price at $58 expiring on April 19, 2024, has a lower delta but a higher gamma, suggesting potential for rapid gains if the stock price begins to approach this higher strike price.
Theta, which measures the rate of decline in an option's value due to the passage of time, also impacts profitability, especially as the expiration date approaches. Lower absolute theta values are preferable for long positions in options trading. A striking example is the option with a strike price of $40 expiring on July 19, 2024, demonstrating a relatively lower theta, meaning it retains value better as time progresses under stable market conditions.
Vega, measuring sensitivity to volatility, and rho, assessing sensitivity to interest rates, are also essential but more context-sensitive. In a volatile market and with changing interest rates, options like those with a strike of $40 expiring on October 18, 2024, stand out due to moderate vega and higher rho, suggesting greater profitability potential under specific economic conditions.
Conclusively, the most profitable call options are those with a positive balance of a high delta, controllable theta, and potential for value increase through gamma and vega, dependent on market conditions. Specifically, leveraging options with a delta close to or at 1.0 (suggesting they are deeply in-the-money or will replicate stock movement), such as those expiring on April 19, 2024, at a $17.5 strike, provide a foundation for solid potential returns particularly if the stock price is expected to rise sharply. The same idea applies to those with longer expirations under the right conditions, providing more latitude for favorable shifts in the market. Always considering the interplay between these Greeks will guide selecting the most profitable options in varying market scenarios.
Similar Companies in None:
Chipotle Mexican Grill, Inc. (CMG), Shake Shack Inc. (SHAK), El Pollo Loco Holdings, Inc. (LOCO), Chuy's Holdings, Inc. (CHUY), Noodles & Company (NDLS)
https://www.cnbc.com/2024/02/27/cava-stock-pops-after-blunder-leads-to-early-earnings-release.html
https://www.fool.com/investing/2024/02/27/why-cava-stock-hit-a-new-all-time-high-today/
https://seekingalpha.com/article/4674063-cava-group-inc-cava-q4-2023-earnings-call-transcript
https://www.youtube.com/watch?v=a_TxJXDpPgo
https://www.youtube.com/watch?v=_Bb63yuwTS4
https://www.fool.com/investing/2024/03/03/can-cava-become-the-next-chipotle/
https://www.fool.com/investing/2024/03/04/cava-stock-buy-sell-or-hold/
https://www.youtube.com/watch?v=KzQgqTHHMNw
https://www.fool.com/investing/2024/03/07/why-cava-stock-jumped-25-in-february/
https://www.youtube.com/watch?v=rLALgWuQDwc
https://www.fool.com/investing/2024/03/12/i-wouldnt-touch-stock-10-foot-pole-buy-instead/
https://www.youtube.com/watch?v=x25J34Hmp7A
https://www.fool.com/investing/2024/03/22/2-reasons-cava-could-be-a-standout-stock-in-2024/
Copyright © 2024 Tiny Computers (email@tinycomputers.io)
Report ID: w6foJu
Cost: $0.79227
https://reports.tinycomputers.io/CAVA/CAVA-2024-04-11.html Home