The Chefs' Warehouse, Inc. (ticker: CHEF)
2024-02-03
 The Chefs' Warehouse, Inc. (CHEF), is a prominent specialty food distributor in the United States, serving a broad customer base that includes top restaurants, caterers, and gourmet stores across the country. Established to cater to the unique needs of the culinary industry, the company offers an extensive array of high-quality products, including exotic ingredients, premium meats, and artisanal cheeses. Over the years, The Chefs' Warehouse has expanded its operations through strategic acquisitions and organic growth, enabling it to enhance its product portfolio and reach a wider market segment. The firm's business model focuses on providing exceptional service and a diverse product offering, aiming to be the premier source for culinary professionals seeking premium ingredients. With its commitment to excellence and deep understanding of the foodservice industry's dynamics, The Chefs' Warehouse, Inc. has established itself as a key player in the distribution of specialty food products.
| Full Time Employees | 4,124 | Founder and CEO | Mr. Christopher Pappas | CEO Age | 63 |
| CEO Total Pay | $2,138,462 | Previous Close | $32.98 | Open | $32.57 |
| Day Low | $32.28 | Day High | $33.27 | Beta | 2.123 |
| Volume | 357,812 | Average Volume | 403,263 | Market Cap | $1,310,934,784 |
| 52 Week Low | $17.29 | 52 Week High | $39.49 | Enterprise Value | $2,173,026,816 |
| Profit Margins | 0.604% | Book Value | $11.535 | Price to Book | 2.865 |
| Shares Outstanding | 39,665,200 | Shares Short | 3,271,800 | Current Price | $33.05 |
| Target High Price | $49.00 | Target Low Price | $29.00 | Total Cash | $33,058,000 |
| Total Debt | $895,148,992 | Total Revenue | $3,274,626,048 | Earnings Growth | -10.8% |
| Revenue Growth | 33.2% | Gross Margins | 23.611% | EBITDA Margins | 4.547% |
| Sharpe Ratio | -0.2835197193526582 | Sortino Ratio | -4.382716449270431 |
| Treynor Ratio | -0.07801605455934374 | Calmar Ratio | -0.2689455164971484 |
Analyzing the recent technical, fundamental, and risk-adjusted performance metrics for CHEF, it's apparent that the stock exhibits notable features for investors and analysts to consider. With a close examination of technical indicators over the recent trading period, it is observed that the stock has shown a significant uptrend, highlighted by the ascending On-Balance Volume (OBV) which transitioned from -0.02159 million to 0.74218 million, indicating strong buying pressure and positive investor sentiment. This uptrend is further supported by a progressively increasing MACD histogram value, which, towards the end of the period, stands at 0.127944, suggesting a strengthening bullish momentum.
From a fundamental standpoint, CHEF's financials reflect a potent combination of revenue growth and operational scaling, as seen in the reported gross margins of 0.23611 and an EBITDA margin of 0.04547. Despite a challenging macroeconomic environment, the company has managed to maintain a solid operational margin and a positive net income trajectory. This is supported by the growth in total revenue from $1.11 billion in 2020 to $2.61 billion in the most recent fiscal year, indicating a strong market position and effective cost management strategies.
The risk-adjusted return metrics, including the Sharpe, Sortino, Treynor, and Calmar ratios, however, suggest a scenario of underperformance relative to the inherent risk. With negative values across these metrics, it indicates that the stock's returns have not been commensurate with the risk borne by investors, a critical factor needing closer examination for risk-averse investors.
Furthermore, analyst expectations, as highlighted by the earnings and revenue estimates, project an optimistic outlook for the next fiscal year, with a notable expected sales growth of 8.40% and an EPS growth projection, indicating a bullish sentiment among market spectators. The adjustments in EPS estimates, particularly the positive adjustments over the last 30 days, underline an improving analyst sentiment towards CHEF's financial health and future performance potential.
Combining these insights, the forecast for CHEF's stock price in the upcoming months is cautiously optimistic. The technical indicators signal a strong bullish momentum supported by increasing investor interest and buying activity. However, prospective investors should also consider the risk-adjusted performance metrics which suggest that the returns may not entirely justify the risks.
Investment decisions should be balanced with comprehensive risk analysis, considering the financial stability and growth prospects indicated by fundamental analyses. An incremental approach, monitoring for sustained improvements in risk-adjusted returns and in line with upcoming earnings reports, could be a prudent strategy to capitalize on CHEF's growth trajectory while mitigating potential downside risks.
In our analysis of The Chefs' Warehouse, Inc. (CHEF), we have scrutinized two critical financial metrics to understand its investment potential as per principles outlined in "The Little Book That Still Beats the Market". Firstly, the Return on Capital (ROC) for CHEF stands at 7.02%, which provides insight into the efficiency with which the company deploys its capital to generate profits. Although not exceptionally high, this ROC suggests that CHEF has a reasonable level of operational efficiency, especially when considering the competitive and capital-intensive nature of the distribution and foodservice industry. Secondly, the Earnings Yield, calculated at 2.27%, serves as a measure of the company's profitability in relation to its share price. This relatively low earnings yield indicates that investors may find the stock to be overvalued at its current price, or it reflects market expectations for significant future growth. When considering these two metrics in tandem, investors should weigh the moderate operational efficiency against the current market pricing, keeping in mind their investment strategy and the potential for CHEF's growth and profitability improvement.
Based on the financial data provided for The Chefs' Warehouse, Inc. (CHEF), let's analyze it against Benjamin Graham's investment criteria to determine if it aligns with his principles for value investing.
-
Margin of Safety: This principle is difficult to assess directly from the provided data without calculating the intrinsic value of CHEF. We need more comprehensive analysis, including earnings, growth, and competitive position, to ascertain the margin of safety.
-
Analyzing Financial Statements: The financial statement data lead to the conclusion that the company has significant growth and changes over the years. However, the detailed analysis of assets, liabilities, and other financial metrics require comparison with industry standards for a decisive conclusion on financial health.
-
Debt-to-Equity Ratio: High debt levels can be risky. CHEF has a "debt_to_equity_ratio" of 2.0740904936128457 (or about 207%), which is considerably high. Graham typically preferred a debt-to-equity ratio lower than 1 (100%), suggesting that CHEF might not meet this criterion favorably.
-
Current and Quick Ratios: The current ratio of CHEF is 2.5405205378068336, indicating that the company has more than twice its current assets relative to its current liabilities, which is a positive sign of financial stability.
-
Earnings Growth: The dataset doesn't explicitly mention earnings growth over the years, but this information can be crucial. Graham looked for a long-term earnings growth to ensure the company could sustain its operations and dividends.
-
Price-to-Earnings (P/E) Ratio: The "pe_ratio" for CHEF is -53.88586956521739, illustrating that the company had negative earnings over the period. Graham usually preferred stocks with a P/E ratio of less than 15, so without positive earnings, CHEF doesn't meet this criterion.
-
Dividend Record: CHEF's "dividend_history" shows an empty list, suggesting there hasn't been consistent dividend payments, which Graham valued for providing income and evidence of profitability.
-
Price-to-Book (P/B) Ratio: CHEF's "pb_ratio" is 0.8708817800618616, which is below Graham's maximum threshold of 1.5, showing the company's stock might be undervalued based on its book value - this is a positive indicator for value investors.
Considering Benjamin Grahams principles, The Chefs' Warehouse, Inc. (CHEF) presents a mixed picture. Its high debt-to-equity ratio and negative P/E ratio due to loss-making highlight significant risks. However, its satisfactory current ratio and low P/B ratio indicate some level of financial stability and potential undervaluation, respectively. The absence of consistent dividend payments may also concern investors looking for income alongside capital appreciation.
For an investment in CHEF to align with Graham's methodology, further qualitative analysis and a review of the companys business model, industry position, and growth prospects would be necessary to ensure it possesses a durable competitive advantage and potential for turnaround. Grahams principles emphasize safety and intrinsic value, requiring thorough due diligence before considering an investment in a company like CHEF that shows both positive and negative financial signals.
| Statistic Name | Statistic Value |
| R-squared | 0.242 |
| Adj. R-squared | 0.241 |
| F-statistic | 400.0 |
| Prob (F-statistic) | 1.82e-77 |
| Log-Likelihood | -3535.2 |
| AIC | 7074. |
| BIC | 7085. |
| coef (const) | 0.0034 |
| coef (0) | 1.7270 |
| Std err (const) | 0.114 |
| Std err (0) | 0.086 |
| t (const) | 0.030 |
| t (0) | 20.001 |
| P>|t| (const) | 0.976 |
| P>|t| (0) | 0.000 |
| [0.025 (const) | -0.220 |
| 0.975] (const) | 0.227 |
| [0.025 (0) | 1.558 |
| 0.975] (0) | 1.896 |
| Omnibus | 489.546 |
| Prob(Omnibus) | 0.000 |
| Jarque-Bera (JB) | 72534.650 |
| Skew | 0.700 |
| Kurtosis | 40.188 |
| Cond. No. | 1.32 |
| Alpha | 0.003422508801426603 |
| Beta | 1.7269697848538628 |
Analyzing the relationship between CHEF and SPY for the period leading up to today, the linear regression model reveals insights into how the stock of CHEF moves with respect to the overall market, depicted by SPY. With an alpha () of 0.0034, there is a slight positive intercept in the linear relationship, indicating that CHEF possesses a small inherent return not explained by SPY's market movements. Though the alpha is small, its positive value suggests that CHEF potentially offers a minimal performance edge over the expected market return under certain conditions.
The beta () coefficient of 1.7270 implies a high elasticity relative to market changes, indicating that CHEF's returns are significantly influenced by the market's movements. A beta greater than one suggests that CHEF is more volatile than the overall market. This is useful for investors seeking exposure to market movements and willing to accept the increased risk for potentially greater returns. The R-squared value of 0.242 indicates that approximately 24.2% of the variability in CHEF's returns can be explained by the markets returns, signifying a moderate level of correlation. Investors might consider this relationship when diversifying their portfolios, balancing exposure to market risks with the inherent return potential indicated by the alpha and beta values.
The Chefs' Warehouse, Inc. (CHEF) held its third quarter 2023 earnings conference call, shedding light on the company's financial performance and future outlook. Alex Aldous, General Counsel, kicked off the call, emphasizing the presentation of non-GAAP financial measures alongside GAAP results, indicating a forward-looking perspective on financial estimates. Chris Pappas, CEO, highlighted a sequential improvement in business activity quarter-over-quarter, despite a slower start in July and August due to holiday placements and increased overseas travel. Pappas drew attention to a 7.1% organic growth in net sales and an 8.2% increase in specialty sales, underpinned by significant customer and volume growth. However, challenges were noted in gross profit margins, primarily attributed to a decrease in both specialty and center-of-the-plate categories.
The company outlined its strategic efforts to mitigate near-term elevated expenses resulting from recent acquisitions, facility expansions, and higher operational costs. Pappas shared optimism towards operational efficiency improvements, citing the expected consolidation of multiple protein processing plants and the enhancement of digital capabilities as key drivers for future growth and cost reduction. Further, he outlined a capital allocation strategy aimed at reducing capital expenditures to about 1% of revenue over the next two years, aspiring for a higher free cash flow conversion and a strategic share repurchase program authorized by the board.
CFO Jim Leddy provided a detailed comparison of the current quarter's financial performance against the previous year, highlighting a 33.2% increase in net sales. This growth chiefly resulted from organic sales growth and the contribution from recent acquisitions. Despite facing net inflation and a decrease in gross profit margins, the company reported a 31.6% increase in gross profit and an upward trend in operating incomes. Noteworthy was the expectation of softened near-term expenses leading into 2024-2025 as the company leverages its investments for organic growth and operational efficiencies.
To conclude, the Chefs' Warehouse maintained a positive outlook for its fiscal year 2023 performance, offering guidance on expected net sales, gross profit, and adjusted EBITDA. Despite the challenges posed by inflationary pressures, increased insurance costs, and integration expenses from acquisitions, the company remains focused on driving organic growth, improving operational efficiencies, and executing its capital allocation strategy. This approach underscores a commitment to sustaining growth while navigating through the prevailing expense headwinds, with a keen eye on enhancing shareholder value through strategic investments and share repurchase initiatives.
The Chefs' Warehouse, Inc. (CHEF), a premier distributor of specialty foods in various culinary markets in the United States, the Middle East, and Canada, filed its 10-Q report for the quarterly period ending September 29, 2023. The report offers detailed insights into the company's financial performance, including net sales, operating income, and net income, along with discussions on recent acquisitions and their financial impact.
For the thirteen weeks ended September 29, 2023, CHEF reported net sales of $881,825,000, a significant increase from $661,856,000 in the comparable period in 2022. This increase in net sales, amounting to $219,969,000 or 33.2%, was attributed to both organic growth and the contributions from recent acquisitions. The organic growth contributed $46.9 million, or 7.1%, to the sales growth, while the acquisitions accounted for $172.9 million, or 26.1%, of the sales growth. The company's gross profit for the same period was $207,698,000, compared to $157,788,000 in 2022, reflecting a gross profit margin of 23.6%.
Selling, general, and administrative expenses for the thirteen weeks ended September 29, 2023, were reported at $179,614,000, marking an increase from $130,255,000 in the same period in 2022. The increase in expenses was primarily due to the higher sales volume, with the expense-to-sales ratio rising slightly by 70 basis points due to near-term costs associated with investments in facilities and acquisitions.
Other operating expenses, net, decreased to $2,535,000 from $5,458,000 in the comparative period of 2022, mainly due to lower non-cash charges related to the changes in the fair value of contingent earn-out liabilities. The interest expense increased to $11,379,000 from $10,737,000, mainly due to higher principal amounts of outstanding debt and higher rates of interest charged on the variable rate portion of the outstanding debt.
The provision for income tax expense for the thirteen weeks ended was $6,848,000, resulting in an effective tax rate of 48.3% for this period. This rate was significantly higher due to discrete charges in the current period for return-to-provision adjustments related to certain nondeductible costs identified in the completion of the Companys fiscal 2022 tax return.
During the same period, CHEF continued its growth strategy through acquisitions, most notably acquiring GreenLeaf, a leading produce and specialty food distributor in Northern California, and Hardie's Fresh Foods, a specialty produce distributor with operations in Texas. The financial impacts of these acquisitions on the company's gross sales, along with the associated costs, have been disclosed, indicating the strategic importance of these acquisitions to CHEF's growth plans.
Additionally, the report discusses the company's liquidity and capital resources, detailing its cash and cash equivalents, working capital, and availability under its asset-based loan facility. Despite significant outflows related to acquisitions and capital expenditure, the company assesses its liquidity position to be sufficient to support its operations, capital expenditures, and other liquidity requirements for the foreseeable future.
Overall, CHEF's financial performance in the reported period showcases significant sales growth driven by both organic efforts and strategic acquisitions. Even amidst increased operating expenses and interest payments, the company continues to pursue growth opportunities, as evidenced by its recent acquisitions and investments in operational capabilities.
The Chefs Warehouse, Inc., headquartered in Ridgefield, Connecticut, has made headlines in recent weeks for a variety of reasons that encapsulate both the challenges and opportunities the company faces in the current economic landscape. Known for its role as a leading distributor of specialty food products across the United States, Canada, and the Middle East, the company has navigated through market fluctuations with strategies that have drawn the attention of investors, analysts, and industry observers.
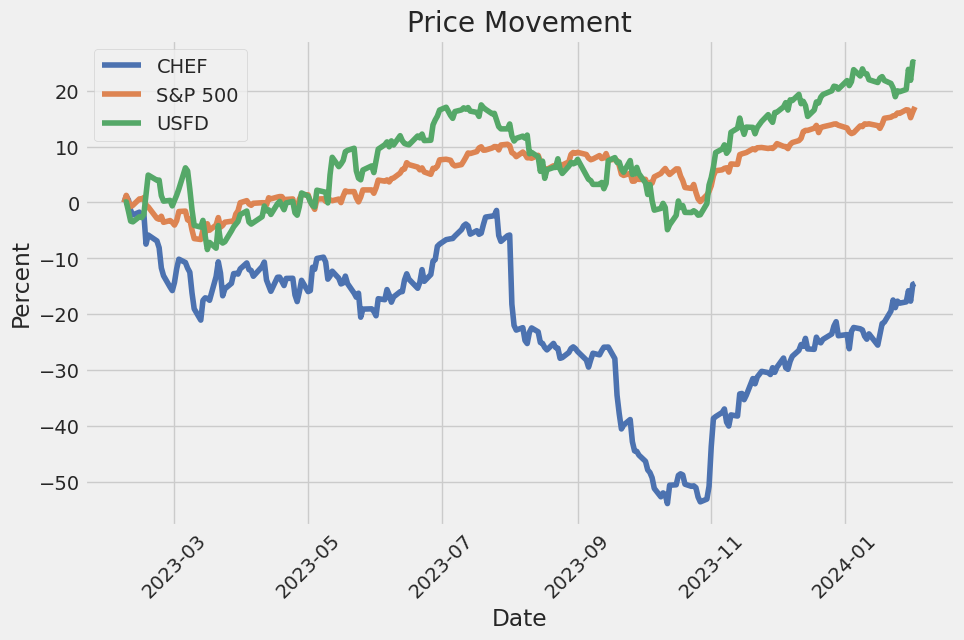
In a report by Soumya Eswaran on Yahoo Finance dated December 26, 2023, it was noted that The Chefs' Warehouse stock value experienced a decline, closing at $29.18 per share on December 22, 2023. This reflected a concerning trend with an 8.19% return over one month, and a more stark 14.98% loss over the last year. The market capitalization of the company was thereby pegged at approximately $1.157 billion, implying a murky outlook on consumer spending habits which may affect the company's operations. This sentiment was further echoed in wasatch's third-quarter 2023 investor letter which highlighted The Chefs Warehouse's struggle amidst a declining market for restaurant stocks, sparked by the anticipation of subdued consumer spending. Despite these pressures, Wasatch Micro Cap Value Strategy found the company's valuation of about eight times EBITDA to be reasonably low-priced, projecting resilience in high-end dining sectors even in the face of a possible recession.
Interestingly, by the end of the third quarter of 2023, The Chefs Warehouse was held in 18 hedge fund portfolios, up from 15 in the previous quarter, suggesting a complex view among investors regarding the company's future performance and the broader impact of consumer behavior trends. This mix of apprehension and strategic optimism underscores the intricate dance of market positioning and investor relations where The Chefs Warehouse is concerned.
In another development, Tim McCauley, the Chief Accounting Officer of The Chefs Warehouse, engaged in the sale of 6,000 shares of company stock at an average price of $30.04 per share, as reported by GuruFocus.com on December 27, 2023. This transaction, while representing a common financial maneuver within corporate sectors, raised questions about insider confidence and market perceptions, particularly given the company's valuation with a P/E ratio significantly above both the industry and its historical averages. GuruFocus.com's valuation metrics, however, suggested that despite the recent insider selling activity, The Chefs' Warehouse could be undervalued, presenting a potential opportunity for investors.
Amid these financial maneuvers and market analyses, The Chefs Warehouse announced its participation in the 2024 ICR Conference scheduled for January 8, 2024, in Orlando, Florida. This move reflects the companys determination to engage actively with the investment community and share insights into its business operations, strategies, and growth prospects. The Chefs Warehouse has leveraged its presence across multiple geographies, catering to a diverse array of clients, from leading independent restaurants and fine dining establishments to country clubs and culinary schools, boasting an expansive portfolio of over 55,000 products. Participation in the ICR Conference is a testament to the companys commitment to transparency and strategic visibility in a competitive market.
Additionally, the company has slated the release of its financial results for the fourth quarter and fiscal year ended December 29, 2023, for February 14, 2024. A conference call to discuss these results will provide further clarity on the companys financial health and operational efficiency. This announcement looks to be a pivotal moment for The Chefs Warehouse as it aims to navigate through the complexities of the specialty food distribution sector and articulate its response to the evolving market dynamics.
Each of these developments, from stock performance analyses and insider trading activities to strategic conference participation and financial disclosures, forms part of a broader narrative. The Chefs Warehouse, Inc. is at a crucial juncture, facing the dual challenges of market volatility and changing consumer spending patterns, yet it remains poised with strategies to address these challenges head-on. The coming months will be critical in shaping the company's trajectory as it seeks to reinforce its market position, optimize growth opportunities, and cultivate robust investor relations within an increasingly unpredictable economic landscape.
The volatility of The Chefs' Warehouse, Inc. (CHEF) from February 5, 2019, to February 2, 2024, reveals a significant level of unpredictability in the asset's returns, as indicated by the ARCH model's outputs. The coefficient (omega) value of 8.7619 suggests a high base level of volatility present without factoring in recent price movements. Furthermore, the alpha[1] value of 0.7753 indicates that past volatility has a substantial influence on future volatility, pointing towards a reactive and potentially unstable price pattern over the examined period.
| Statistic Name | Statistic Value |
|---|---|
| Mean Model | Zero Mean |
| Vol Model | ARCH |
| Log-Likelihood | -3435.31 |
| AIC | 6874.61 |
| BIC | 6884.88 |
| No. Observations | 1257 |
| omega | 8.7619 |
| alpha[1] | 0.7753 |
Analyzing the financial risk of a $10,000 investment in The Chefs' Warehouse, Inc. (CHEF) over one year requires an in-depth scrutiny of the stock's past performance to predict future uncertainty. This analysis employs a dual approach, integrating volatility modeling and machine learning predictions to assess the potential financial risks accurately.
Volatility modeling, a statistical method for quantifying the degree of variation in a trading price series over time, is crucial for understanding The Chefs' Warehouse, Inc.'s stock volatility. This model is particularly adept at capturing the 'clusters' of volatility often observed in financial markets, where periods of high volatility are followed by high volatility and low by low. By examining historical stock price data, volatility modeling helps in estimating the future fluctuations in the price of CHEF stock. This is instrumental in assessing the risk, as it provides a clear depiction of potential price volatility which could affect the investment value.
In conjunction, machine learning predictions are utilized to forecast future stock returns based on historical data. The role of machine learning, particularly a model that emulates the complexity of financial markets dynamics to predict outcomes, is pivotal. By analyzing patterns within the historical price data and identifying the relationships between different market factors, this approach forecasts the future performance of The Chefs' Warehouse, Inc. stock. It factors in a wide array of inputs, including but not limited to previous stock prices, volumes, and market sentiment, to enhance the accuracy of these predictions.
The integration of these two analytical methods provides a comprehensive overview of the potential financial risks. Specifically, the Value at Risk (VaR) metric, which quantifies the maximum expected loss over a specified timeframe at a certain confidence level, is calculated. For The Chefs' Warehouse, Inc., the annual VaR at a 95% confidence interval stands at $429.13 on a $10,000 investment. This implies that, under normal market conditions, there is a 95% probability that the investor would not lose more than $429.13 over the next year.
The calculated VaR is a testament to the effectiveness of combining volatility modeling with machine learning predictions. This integration provides a nuanced understanding of both the potential fluctuations in stock price (volatility) and the expected direction of stock price movement (returns). By doing so, it enables an in-depth analysis of the financial risk associated with investing in The Chefs' Warehouse, Inc., ensuring that investors can make informed decisions grounded in a thorough assessment of potential risks.
Similar Companies in Food Distribution:
US Foods Holding Corp. (USFD), Sysco Corporation (SYY), SpartanNash Company (SPTN), Calavo Growers, Inc. (CVGW), Mission Produce, Inc. (AVO), United Natural Foods, Inc. (UNFI), The Andersons, Inc. (ANDE), Performance Food Group Company (PFGC), AMCON Distributing Company (DIT)
https://finance.yahoo.com/news/chefs-warehouse-chef-fell-concerns-115605022.html
https://finance.yahoo.com/news/insider-sell-chief-accounting-officer-040144524.html
https://finance.yahoo.com/news/chefs-warehouse-inc-participate-2024-130000810.html
https://finance.yahoo.com/news/chefs-warehouse-announce-fourth-quarter-130000067.html
https://www.sec.gov/Archives/edgar/data/1517175/000151717523000016/chef-20230929.htm
Copyright © 2024 Tiny Computers (email@tinycomputers.io)
Report ID: EjwhZxL
Cost: $0.49152
https://reports.tinycomputers.io/CHEF/CHEF-2024-02-03.html Home