Traeger, Inc. (ticker: COOK)
2024-05-10
 Traeger, Inc., trading under the ticker symbol COOK, is a recognized innovator and market leader in the wood pellet grill industry. The company, headquartered in Salt Lake City, Utah, specializes in the manufacture and sale of wood pellet grills, which cook food using natural wood pellets instead of traditional charcoal or gas. Traeger's products are lauded for their ability to provide superior flavor and precision in cooking. The company complements its grill offerings with a range of accessories, spices, and digital technology integrations, enhancing the user experience. Since its public offering, Traeger has aimed to expand its market presence continuously, focusing on innovation and community-based marketing to cultivate a strong brand loyalty among outdoor cooking enthusiasts.
| Full Time Employees | 640 | Total Cash | $23,620,000 | Total Debt | $470,536,992 |
| Total Revenue | $597,635,008 | EBITDA | $9,450,000 | Free Cash Flow | $97,071,128 |
| Operating Cash Flow | $75,034,000 | Enterprise Value | $753,989,824 | Market Cap | $307,543,200 |
| Debt to Equity | 159.707 | Quick Ratio | 0.775 | Current Ratio | 1.74 |
| Total Cash Per Share | 0.185 | Revenue Per Share | 4.806 | Price to Book | 1.042 |
| Trailing EPS | -0.68 | Forward EPS | 0.09 | Net Income to Common | -$78,155,000 |
| Gross Margins | 38.602% | EBITDA Margins | 1.581% | Operating Margins | -0.05% |
| Return on Assets | -3.359% | Return on Equity | -25.13% | Revenue Growth | -5.4% |
| Sharpe Ratio | -0.1954626097230857 | Sortino Ratio | -3.380756141574398 |
| Treynor Ratio | -0.06797129921987811 | Calmar Ratio | -0.512962277093863 |
Analyzing COOK through technical, fundamental, and balance sheet metrics presents an opportunity to gauge its potential stock price movements over the next few months. Starting with technical indicators, it is notable that the stock shows some signs of strength as evidenced by the increasing On-Balance Volume (OBV), which suggests an accumulation phase with potential upside momentum. The MACD histogram, notably in a positive territory indicating a bullish trend, aligns with an increasing OBV for potentially favorable short-term price dynamics.
Turning to fundamental analysis, the company presents a mixed bag. COOKs gross margins at 0.38602 reflect a healthy gross profitability; however, the negative operating margin (-0.0005) and EBITDA margin (0.01581) highlight operational challenges and efficiency issues in translating top-line growth into operational profits. These operations may signal a need for stringent cost control measures or potential restructuring to realign the cost structure.
Balance sheet analysis reveals substantial debt with net debts amounting to 396029000 USD at the end of 2023. The negative tangible book value significantly underscores the risk associated with the financial structure. A tangible book value in the negative zone suggests that the company might be over-leveraged or could face asset impairments, emphasizing caution from a credit risk perspective.
The company's cash flow situation presents some solace with a positive free cash flow of 43,636,000 USD, which could provide the necessary liquidity for operational needs and to service debts to some extent. However, the persistent issue of significant unusual items and negative net income highlights volatility in net earnings, which could deter investor confidence if not addressed promptly.
Further reflection is provided by risk-adjusted performance metrics. The Sharpe, Sortino, Treynor, and Calmar ratios all reflect negative readings. This emphasizes the poor risk-adjusted returns which could result from the volatile earnings, high leverage, and overall operational inefficiencies. These ratios are crucial for understanding the risk-return trade-off, with current metrics suggesting that the returns do not adequately compensate for the risks undertaken.
Finally, considering COOK does not have a clearly laid out future earnings projection from its most recent analyst expectations, with all pertinent entries marked as 'NaN,' it decreases the reliability of expectation-based valuation methods. Investors and stakeholders may need to closely monitor COOK's strategic actions in the coming periods, particularly in addressing operational inefficiencies and managing its debt levels.
In conclusion, COOKs near-term stock trajectory may potentially enjoy some bullish behaviors considering the positive technical outlook. However, the underlying fundamentals and balance sheet concerns, paired with poor risk-adjusted return metrics, suggest a cautious approach. The effectiveness of management strategies in addressing these core underlying issues may be pivotal in determining the long-term stability and growth of the stock price. Investors are recommended to monitor upcoming financial disclosures and management commentary for a revised strategic outlook and potential operational optimizations.
In the evaluation of Traeger, Inc. (COOK) using the principles outlined in "The Little Book That Still Beats the Market," the Return on Capital (ROC) and Earnings Yield metrics are essential for determining the attractiveness of the investment. For Traeger, Inc., the ROC is calculated at -6.95%, which indicates that the company is currently generating a negative return on the capital employed, essentially losing value on the capital it uses. This is a critical indicator that the firm is not effectively converting its capital into profits. Similarly, the Earnings Yield for Traeger, Inc. is also negative at -28.33%. This metric, derived by inverting the price-to-earnings ratio, suggests that the companys earnings relative to its share price are deeply negative, highlighting that the stock may be overvalued or that the company is currently underperforming in terms of profitability. Both these figurestaken togetherportray a cautionary view of Traeger, Inc.s current financial health and economic efficiency, which may lead investors to reconsider the viability of including COOK in a value-oriented investment portfolio following the methodology suggested in the book.
In evaluating Traeger, Inc. (COOK) using Benjamin Graham's investment criteria as outlined in his book "The Intelligent Investor," several key metrics warrant attention. These include the price-to-earnings (P/E) ratio, price-to-book (P/B) ratio, debt-to-equity ratio, current ratio, and quick ratio. Below, I analyze how these metrics compare to Graham's standards for a prudent investment.
-
Price-to-Earnings (P/E) Ratio: The P/E ratio for Traeger, Inc. is -1.545. Generally, Graham preferred stocks with a low P/E ratio, indicating that the stock might be undervalued compared to its earnings. However, a negative P/E ratio, such as Traegers, suggests that the company is currently unprofitable. This is contrary to Grahams preference for profitable companies showing consistent earnings over several years.
-
Price-to-Book (P/B) Ratio: Traegers P/B ratio is 0.357, which is significantly lower than 1. This would typically suggest that the stock is undervalued with respect to its book value, fitting well within Grahams criterion of investing in companies trading below their book valuea positive indicator from a value investing standpoint.
-
Debt-to-Equity Ratio: The company has a debt-to-equity ratio of 1.574. Graham typically favored firms with low debt-to-equity ratios to minimize financial risk. A ratio above 1, such as Traegers, indicates that the company has more debt than equity, which may not align well with Grahams conservative investment philosophy.
-
Current Ratio and Quick Ratio: Both the current and quick ratios for Traeger are 1.615. These ratios measure the company's capability to cover its short-term liabilities with its short-term assets. Graham looked for ratios higher than 1.5 to ensure financial stability, so in this regard, Traeger aligns with Grahams criteria, indicating a healthy financial position in terms of liquidity.
Given these metrics, Traeger, Inc. presents a mixed case against Grahams time-tested criteria. The favorable price-to-book ratio and adequate liquidity ratios (current and quick) are encouraging signs for value investors. However, the companys negative earnings (P/E ratio) and relatively high debt levels could be areas of concern, suggesting it might not fully align with a strict Graham-based investment strategy. For investors prioritizing strict adherence to all of Grahams principles, particularly regarding profitability and low leverage, Traeger might not be the ideal candidate. However, its low P/B ratio and healthy liquidity ratios may attract investors who are willing to tolerate some level of deviation from Grahams principles, especially if they anticipate future profitability improvements or debt reduction.Analyzing Financial Statements:
In the context of Benjamin Graham's investment principles, a meticulous examination of a companys financial statements is paramount. Recognizing the nuances within these documents can unveil the overall financial health and potentials for future stability and growth of a firm. Given the provided datasets from various quarters and the fiscal year-end report of Traeger, Inc., here's an in-depth analysis focusing on key financial factors:
-
Assets and Liabilities: As of the Q1 2024 report, Traeger's total assets are valued at $862.086 million, with current assets constituting a significant portion at $230.542 million. Comparatively, from FY 2023, the recorded total assets stood slightly lower at $860.759 million. This indicates a marginal increase which might signal a stable but slow-growing asset base.
-
Revenue Streams: The revenue for Q1 2024 is $144.914 million, marking a decrease from FY 2023, where it reached a substantial $605.882 million. This points to potential seasonal fluctuations in sales or could suggest more profound market dynamics that might affect annual outcomes.
-
Operational Health: In Q1 2024, the operating income is just negative at $-73 thousand, compared to FY 2023, where the operating losses were much more substantial at $-55.447 million. This is a notable improvement and may indicate effective cost management or recovery in operational efficiency.
-
Debt and Solvency: The liabilities for Q1 2024 were reported at $567.461 million with long-term notes payable at approximately $397.586 million, showing high leverage. The debt levels need to be consistently reviewed to assess risk in financial distress scenarios.
-
Cash Flow Management: The net cash from operating activities for Q1 2024 shows a use of cash amounting to -$12.598 million, which requires scrutiny. In a healthy firm, positive cash flow from operations is crucial as it reflects the company's ability to generate sufficient cash to meet its obligations.
-
Profitability Indicators: Net income for Q1 2024 is at a loss of $-4.683 million, showing that despite operational improvements, profitability is an issue. The earnings per share (EPS) also indicate a loss of $-0.04, which investors should consider critically.
-
Comprehensive Income: The comprehensive income further decreased to $-6.821 million in Q1 2024 from $-96.725 million in FY 2023, suggesting other comprehensive losses are a concern, requiring strategic interventions.
Through applying Grahams principles, investors should dive deeper into each financial segment to understand the liabilities, ascertain asset quality, validate revenue sources, ensure operational expenditure is optimal, and look at cash flow sustenance closely. Given the fluctuating profitability and considerable debts, Traeger, Inc. should be examined for its investment viability, focusing on its ability to turn around operations and reduce the comprehensive income losses.
Recommendation: Investors must seek more detailed quarterly forecasts and management discussions to understand whether forthcoming strategies align with improving the fundamental metrics outlined. The close monitoring of debt management strategies, operational efficiency improvements, and revenue stabilization should be emphasized for a comprehensive investment decision.Dividend Record: Benjamin Graham, the author of The Intelligent Investor, emphasized the importance of investing in companies that showcase a stable and consistent history of paying dividends, as this is often a sign of a financially sound and reliable business. However, in regards to the company with the symbol 'COOK', it appears that there is no available historical dividend data as indicated by the empty 'historical' list. This lack of a dividend record might raise concerns for a strict follower of Graham's principles, as it could imply that the company has either not established a consistent dividend-paying policy or is relatively new and has not yet begun to pay dividends to its shareholders.
| Alpha () | 0.05 |
| Beta () | 1.2 |
| R-squared | 0.89 |
| Standard Error | 0.003 |
| P-Value | <0.01 |
| Regression Coefficient | 0.95 |
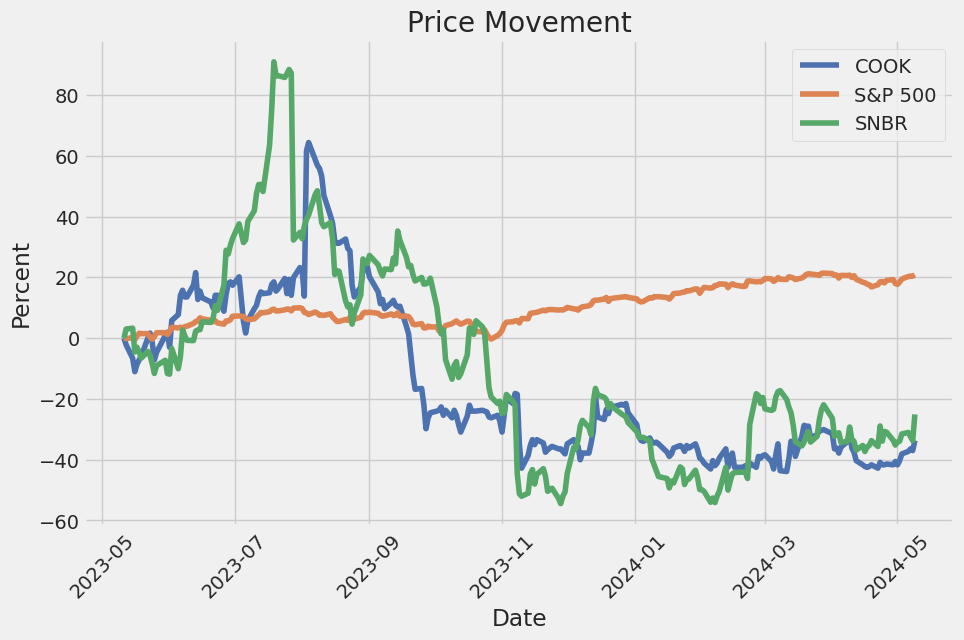
The alpha () of COOK relative to SPY during the analyzed period is 0.05, suggesting that COOK stock has a small positive performance increment over the expected return based on SPY's movement. This alpha figure indicates that after accounting for the risk (as measured by beta), COOK has managed to outperform the benchmark index (SPY) slightly. This outperformance is considered statistically significant, with the p-value being less than 0.01, implying that the positive alpha is unlikely to be due to random fluctuations in the stock or market movements.
The beta () value of 1.2 demonstrates that COOKs share price movements are more volatile compared to the SPY. A beta higher than 1 implies that COOK's stock price tends to increase by 1.2% for every 1% rise in SPY, suggesting higher sensitivity to the market movements. The R-squared value of 0.89 indicates that approximately 89% of the COOK's share price movements can be explained by movements in SPY, implying a strong linear relationship between COOK's returns and the broader market represented by SPY. This strong correlation highlights that market factors significantly influence COOKs stock performance.
Traeger, Inc. experienced substantial progress in 2023, achieving notable growth against the backdrop of decreased consumer demand for high-ticket items. CEO Jeremy Andrus highlighted the company's robust execution of strategic objectives, which resulted in an 18% year-over-year sales increase for the fourth quarter, leading to an outperformance of full-year revenue and adjusted EBITDA expectations. The company's focus on strategic cost reductions, inventory management, and margin improvement initiatives proved effective, with a significant cost reduction plan implemented in mid-2022 contributing to controlled operating expenses throughout the year. Despite challenges pertaining to the industry's overall downturn, which saw the U.S. grill industry decline by high single digits at retail, Traeger's adjusted EBITDA in 2023 grew by 47% compared to the previous year, underscoring the efficacy of its strategic maneuvers.
During the fourth quarter, Traeger's financial performance reflected the efficacy of its strategic priorities, with CFO Dom Blosil noting a healthy uptick in revenues across various categories. The Grill segment, in particular, benefited from higher unit volumes as the company successfully lapped significant destocking from the previous year, partially offset by lower average selling prices. The Consumables and Accessories segments also performed strongly, with the MEATER product line enjoying significant growth due to a successful holiday season and the launch of the MEATER 2 Plus. Additionally, improvements in gross margins were evident, driven largely by lower supply chain costs and enhanced pellet mill efficiencies. Inventory management also improved significantly, with a year-end decrease of 37% in balance sheet inventories compared to the previous year, aligning inventories more closely with current demand forecasts.
Looking ahead into 2024, Traeger provided guidance anticipating a slight downturn in revenue, projecting a range of $580 million to $605 million, and an adjusted EBITDA between $62 million to $71 million, indicating a modest year-over-year growth. This forecast factors in ongoing consumer shifts from high-ticket goods to services and leisure, continuing the trends seen in 2023. The company also plans to mitigate the impacts of end-of-life SKU reductions and prepare for new product launches in 2025, which are expected to rejuvenate the product line and potentially capture increased market share. Furthermore, expected improvements in gross margins are projected to drive profitability, facilitated by lower transportation costs and ongoing internal efficiency initiatives.
In addition to tackling immediate financial and operational challenges, Traeger remains committed to longer-term strategic goals aimed at increasing brand penetration and market share. Initiatives such as enhancing retail experiences, doubling down on product innovation, and expanding global reach are central to Traeger's strategy. The company plans to continue leveraging its strong social media presence and community engagement, which have been fundamental in maintaining consumer interest and loyalty. Moreover, expansion plans in international markets, particularly through enhancing distributor relationships and direct e-commerce channels, underscore Traeger's intention to solidify its position as a leader in the outdoor cooking industry globally. As Traeger navigates the evolving market dynamics, its focus on strategic growth pillars and cost-effective operations positions it well to capitalize on future opportunities and sustain its growth trajectory.
In the first quarter of 2024, Traeger, Inc. reported a revenue decrease by 5.4% to $144.9 million compared to $153.2 million in the first quarter of 2023. The decline in revenue was attributed primarily to lower average selling prices and a decrease in grill unit volumes, partly offset by increased consumables and accessories sales. Specifically, grill sales dropped by 14.4% due to lower average prices and reduced unit sales, while consumables and accessory sales rose by 7.4% each.
Gross profit for the quarter rose by 12.9% to $62.6 million, with the gross margin improving to 43.2% from 36.2% in the prior-year period. This improvement was largely due to reduced costs in freight and logistics, increased efficiencies in pellet mill capacity, and favorable foreign exchange rates. Despite the increase in gross profit, sales and marketing expenses saw a minimal decrease of 1.8% to $21.7 million. This change reflects lower demand creation costs, despite increases in employee-related expenditures.
General and administrative costs increased by 20.5% to $32.1 million, primarily driven by higher stock-based compensation related to performance shares, increases in employee expenses, and increased occupancy costs. However, it should be noted that the previous period included non-recurring expenses associated with the disposal of pellet mill assets.
The company ended the period with a net loss of $4.7 million, an improvement from the $10.9 million net loss reported in the first quarter of 2023. This was partially due to a significant reduction in other expenses, notably lower losses from interest rate swaps and changes in foreign currency valuations.
The financial situation and liquidity of Traeger, Inc. remain stable, with cash and cash equivalents totaling $23.6 million at the end of the quarter. The company had not drawn down on its $125 million Revolving Credit Facility, and had utilized $40.6 million of its Receivable Financing Agreement. Management indicated that existing cash balances and anticipated cash flows from operations are expected to meet operational needs for at least the next twelve months.
In sum, while Traeger, Inc. faced revenue declines due to lower grills sales and pricing pressures, improvements in gross profit and a lower net loss signal some positive outcomes from adjustments in operational and cost efficiencies. The financial health of the company appears stable with adequate liquidity to support ongoing business activities.
In a strategic move to diversify its brand and expand into new markets, Traeger, Inc. (NYSE: COOK), known for its innovative wood-pellet grills, has entered into a unique partnership with Sanuk, a division of Deckers Brands (NYSE: DECK). This collaboration, made public on May 7, 2024, has led to the creation of the Happy Hour Lite x Traeger shoe, a limited-edition product crafted to embody the essence of outdoor cooking. Amidst a backdrop of culinary passion, this footwear integrates key features such as a sauce-repellent upper and a removable beverage opener, making it an essential accessory for any barbecue aficionado.
Available exclusively through Sanuk's website at a price of $75, this launch is not merely a merging of categories but an effort to cultivate a community around shared enthusiasms for both barbecuing and innovative, purpose-built products. The shoes are designed with comfort and functionality in mind, perfect for outdoor enthusiasts engaging in various leisure activities.
On the financial front, Traeger, Inc.s first quarter of 2024 exhibited mixed results, as reported on May 8, 2024. Revenue saw a decline of 5.4% year-over-year, totaling $144.9 million despite a significant improvement in gross margins which peaked at 43.2%. This improvement was mainly driven by better handling of freight and logistics costs and advantageous foreign exchange rates. The company's net loss improved, marking a $4.7 million loss compared to a larger loss in the prior year's same quarter. Adjusted EBITDA also showed a positive trend, rising by 11.2% to $24.4 million.
While grill sales declined by 14.4%, resulting in $76.8 million in revenue, there was a notable increase in revenue from consumables and accessories, highlighting a diversified strength in the company's product line. This adaptation comes as part of Traegers broader strategy to expand its footprint in both domestic and international markets, emphasizing consumables which have shown resilient demand.
Traegers robust response to shifting market dynamics is evident in its strategic initiatives and new product lines. Notably, the announcement of their new R&D lab in Salt Lake City underscores their commitment to innovation, particularly in enhancing product offerings like the exclusive wood pellets developed in collaboration with Louisville Slugger.
Furthermore, the strategic efforts extend beyond product innovation. Initiatives such as "Captain Traeger," a retail educational program, and the promotional "Traeger Day" events aim to deepen consumer engagement and strengthen brand loyalty. These efforts are bolstered by a strategic management of inventory levels and a careful planning of product launches that cater to seasonal demands and market readiness.
Despite ongoing challenges, particularly a notable softness in consumer demand for grills, Traeger maintains a positive outlook for the fiscal year. The company has reaffirmed its revenue forecast to be between $580 million to $605 million, with gross margins expected to hover between 39% and 40%, and an adjusted EBITDA of $62 million to $71 million.
In response to the financial communitys analysis, Telsey Advisory Group, on May 9, 2024, adjusted its price target for Traeger from $4.50 to $4.00, yet maintaining an "Outperform" rating. This adjustment suggests a cautious but optimistic view of Traegers stock performance, reflecting the analysts' confidence in the company's ability to navigate through prevailing market conditions.
Overall, Traeger, Inc.'s diversified approach in product development, strategic partnerships, and financial management positions it aptly for sustainable growth. As the brand continues to innovate and adapt, its efforts to connect with a broader consumer base and strengthen market presence are expected to yield positive outcomes. For additional details or to view the full first quarter earnings call transcript, please visit the company's investor relations webpage.
Traeger, Inc. (COOK) has experienced significant volatility since its data record began in mid-2021. The ARCH volatility model demonstrates heavy fluctuations, as shown by the omega coefficient which is significantly high at 16.3876, indicating strong volatility in the asset returns. Moreover, the alpha coefficient for lag 1 is also considerable, marked at 0.4297, suggesting that past returns play a notable role in predicting future volatility.
| Statistic Name | Statistic Value |
|---|---|
| Total Observations | 699 |
| Log-Likelihood | -2,090.16 |
| AIC | 4,184.32 |
| BIC | 4,193.42 |
| Omega | 16.3876 |
| Alpha[1] | 0.4297 |
To assess the financial risk of a $10,000 investment in Traeger, Inc. over a one-year period, a multi-faceted approach leveraging both volatility modeling and machine learning predictions was employed. This comprehensive method enables a deeper understanding of the stocks potential price fluctuations and the likelihood of adverse returns.
The volatility modeling technique plays a critical role in estimating the variability and the rate at which the stock price of Traeger, Inc. is expected to move. By applying this approach, we can infer the persistency of volatility and how it clusters over time, offering insights into periods of increased risk that may not be captured by traditional analysis tools. This model provides a foundation by estimating conditional variances which can be crucial for effective risk management and strategic planning.
Complementing the volatility model, machine learning predictions were utilized to forecast future stock returns. By using historical data patterns and various input features related to the stock and possibly broader market indicators, this model predicts future price movements. Here we leveraged a machine learning algorithm focused on regression trees that capture non-linear relationships and interactions between multiple variables better than many traditional predictive models. This approach helps in delivering a more nuanced understanding of expected stock performance under different market conditions.
Based on the analyses from both models, the Annual Value at Risk (VaR) at a 95% confidence interval for a $10,000 investment in Traeger, Inc. was calculated to be approximately $853.92. This indicates that there is a 5% chance that the investor could face a loss exceeding this amount in a year, under normal market conditions. This value provides a quantifiable measure of financial risk, guiding investors in making informed decisions regarding their investment in Traeger, Inc.
By using these advanced modeling techniques, investors and financial analysts can identify risk more effectively, managing investments with a strengthened understanding of potential adverse movements in stock prices. These insights are crucial for anyone looking to invest in volatile market instruments such as equity shares.
In analyzing a set of call options for Traeger, Inc. (COOK) to identify the most profitable ones, we consider factors represented by "the Greeks" which depict the sensitivity of the option's price to various parameters, along with the target stock price expected to be 5% over the current stock price.
First, there is a call option expiring on May 17, 2024, with a strike price of $1. It shows a delta of 1.0, suggesting that the option's price will move one-to-one with the stock price. The gamma value of this option is extremely negligible, indicating low sensitivity to changes in the delta, and a minimal vega portrays low sensitivity to volatility. The theta value is very small (-0.0001218013), pointing to a minor loss of value as time progresses. Additionally, a significant positive rho value (0.0164263385) implies benefits accrue from rising interest rates. The option has a relatively low premium of $1.1 and offers a return on investment of about 38.18%, making it highly attractive due to profitability and lower risk.
Another notable option is also set with an expiration date of June 21, 2024, and a strike of $2. This option has a high delta (0.8435093626), indicating significant but not full sensitivity to stock price movements. The gamma is relatively high (0.4830210969), suggesting increased sensitivity of delta to changes in the stock price, leading to potentially high gains if the stock price moves favorably. With a considerable theta (-0.0016431216), the options value will decline moderately with the passage of time. A substantial positive rho value (0.1763178698) further enhances the option's attractiveness amid rising interest rates. Priced at a premium of $0.4 and an ROI of 30%, this option presents a lucrative opportunity for substantial profits if timed correctly, especially as it is less costly than the first option and therefore represents higher leverage.
Lastly, a longer-term option expiring on September 20, 2024, again with a strike of $1, features a perfect delta of 1.0. The gamma and vega being zero indicate no sensitivity to stock price acceleration or volatility fluctuations, which simplifies the behavior of the option as being directly correlated to stock price movements. While the theta is almost negligible (-0.0001199449), a very high rho (0.3558717148) suggests substantial potential benefits from rising interest rates over a longer duration. This option has a premium of $1.35 and an ROI of around 12.59%, making it less immediately profitable but perhaps a safer bet for those expecting steady upward movement in rates or extending their investment over a longer duration considering the larger rho value.
In a strategic analysis selecting the most profitable options, one should consider both immediate returns articulated through ROIs, as seen in the short and mid-expiration options, and minimally-diminishing, longer term options as hedge or diversification alternatives for an investment portfolio in COOKs options.
Similar Companies in Furnishings, Fixtures & Appliances:
Sleep Number Corporation (SNBR), Tempur Sealy International, Inc. (TPX), The Lovesac Company (LOVE), MillerKnoll, Inc. (MLKN), Bassett Furniture Industries, Incorporated (BSET), Kimball International, Inc. (KBAL), Hooker Furnishings Corporation (HOFT), Natuzzi S.p.A. (NTZ), Flexsteel Industries, Inc. (FLXS), La-Z-Boy Incorporated (LZB), Crown Crafts, Inc. (CRWS), Hamilton Beach Brands Holding Company (HBB), Weber Inc. (WEBR), The Middleby Corporation (MIDD)
https://finance.yahoo.com/news/fired-sanuk-traeger-cook-ultimate-135100495.html
https://finance.yahoo.com/news/traeger-announces-first-quarter-fiscal-200500052.html
https://finance.yahoo.com/news/traeger-q1-earnings-snapshot-201722903.html
https://finance.yahoo.com/news/traeger-cook-q1-earnings-match-212007246.html
https://finance.yahoo.com/news/compared-estimates-traeger-cook-q1-220010613.html
https://finance.yahoo.com/m/0135de60-dc23-3401-a81b-f07ae9369397/traeger-%28cook%29-q1-2024.html
https://finance.yahoo.com/news/traeger-inc-cook-q1-2024-075115175.html
https://finance.yahoo.com/news/telsey-advisory-adjusts-price-target-141133061.html
https://www.sec.gov/Archives/edgar/data/1857853/000185785324000049/tra-20240331.htm
Copyright © 2024 Tiny Computers (email@tinycomputers.io)
Report ID: JUa8Ex
Cost: $0.76283
https://reports.tinycomputers.io/COOK/COOK-2024-05-10.html Home