Global X Copper Miners ETF (ticker: COPX)
2024-03-03
 The Global X Copper Miners ETF, known by its ticker symbol COPX, is a specialized exchange-traded fund (ETF) that aims to provide investment results corresponding generally to the price and yield performance, before fees and expenses, of the Solactive Global Copper Miners Total Return Index. This index is designed to reflect the performance of the global copper mining industry, comprising companies that are primarily involved in the business of mining copper. COPX offers investors an opportunity to gain exposure to one of the most fundamental industrial metals, which is essential in various sectors including construction, energy, and technology, due to copper's excellent electrical and thermal conductivity properties. The ETF's focus on copper miners rather than the metal itself allows investors to potentially benefit not only from the rising demand and price of copper but also from the operating efficiencies and expansions of the mining companies. Given the growing importance of copper in electric vehicle manufacturing, renewable energy systems, and infrastructure development, COPX presents a targeted investment vehicle that may capture growth within the evolving global economy while inherently carrying the volatility and risks associated with the commodities and mining sectors.
| Previous Close | 35.98 | Open | 36.04 | Day Low | 35.85 |
| Day High | 36.6 | Volume | 268,640 | Average Volume (10 days) | 354,770 |
| Bid | 36.43 | Ask | 36.7 | Bid Size | 800 |
| Ask Size | 1300 | Yield | 0.0246 | Total Assets | 1,450,255,232 |
| 52 Week Low | 31.65 | 52 Week High | 42.44 | 50 Day Average | 36.2694 |
| 200 Day Average | 36.4786 | YTD Return | -0.028 | 3 Year Average Return | 0.0111981 |
| 5 Year Average Return | 0.131194 | Currency | USD | Category | Natural Resources |
| Sharpe Ratio | -0.19039187068305463 | Sortino Ratio | -3.0793354517948344 |
| Treynor Ratio | -0.041353548505266964 | Calmar Ratio | -0.22239014587848724 |
Analyzing the Global X Copper Miners ETF (COPX) through a combination of technical analysis, fundamental analysis, and examination of the risk-adjusted performance measures provides an integrated view of its potential future movements.
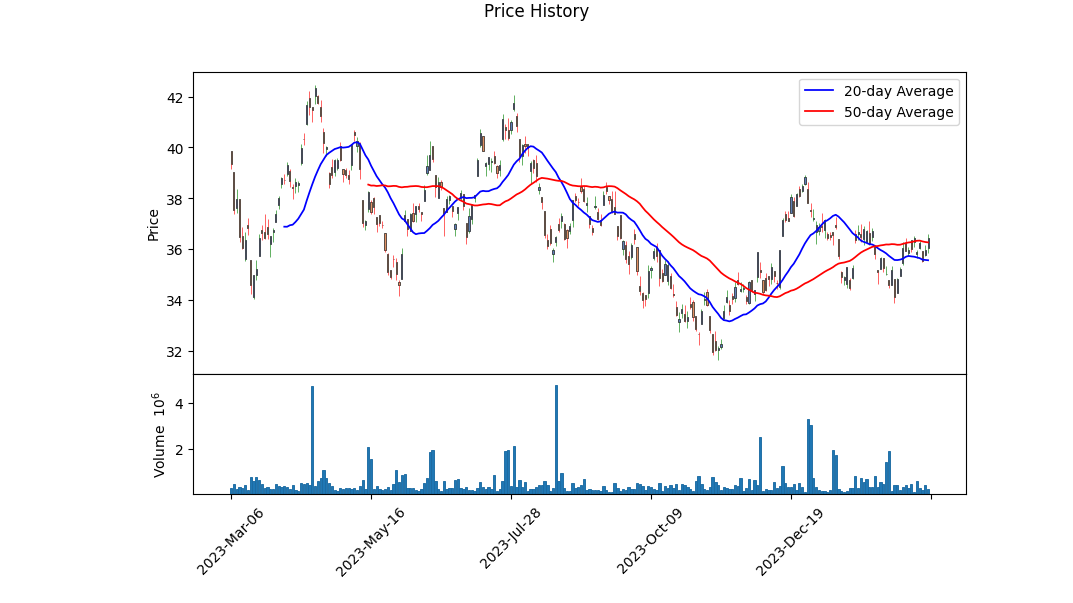
Technical Analysis Summary: - The recent price action shows a closing at $36.04 on the last trading day, which is near the higher end of its recent trading range. This indicates a bullish sentiment in the last trading session. - Based on the provided technical indicators, an upward trend is noticeable with the stock closing higher than its opening price. This uptrend is complemented by an increase in volume, particularly noted in the OBV (On-Balance Volume) which moved from -0.09452 million to -0.68279 million, showing accumulation. - The MACD Histogram, appearing positive towards the latter observations, suggests an ongoing bullish momentum with potential for further upside.
Fundamental Analysis: - The trailing PE ratio of 9.34 signals that COPX is trading at a relative discount to earnings, potentially suggesting undervaluation. - The ETF has maintained a decent yield of 2.46% and has managed a Year-to-Date (YTD) Daily Total Return of -2.80%, suggesting some volatility but also offering income through dividends. - With total assets of approximately $1.45 billion and a net asset value (NAV) closely aligning with its current trading price, the financial health of the fund seems stable.
Risk-Adjusted Performance Measures: - Negative values in all risk-adjusted performance ratios (Sharpe, Sortino, Treynor, and Calmar Ratios) suggest that the fund has experienced periods of underperformance relative to the risk taken during the past year. This indicates that investors have not been adequately compensated for the risks they have taken.
The combination of positive technical signals, undervalued fundamental metrics, but poor risk-adjusted returns suggests a mixed outlook for COPX. While the technical and fundamental analyses imply potential for price appreciation in the coming months, the negative risk-adjusted performance ratios indicate that this ETF has historically not compensated investors proportionately for its volatility and risk. Therefore, while there may be short-term upside potential based on market sentiment and fundamental attractiveness, investors should proceed with caution, considering the ETF's recent underperformance on a risk-adjusted basis. Future movements will also be significantly influenced by broader market trends, global economic conditions affecting the copper industry, and shifts in investor sentiment towards natural resources.
Given that no specific numerical values for return on capital (ROC) and earnings yield for the Global X Copper Miners ETF (COPX) have been provided, I will offer a conceptual framework for understanding these parameters and their significance, rather than precise calculations.
The Return on Capital (ROC) is a crucial indicator of the efficiency with which a company, or in this case, the companies within the COPX ETF, utilize their capital to generate profits. An absence of a specific ROC value for COPX implies we have no direct measurement of how effectively the collective assets within the fund are being used to produce earnings. This metric is instrumental in assessing the performance of the underlying investments, particularly in the capital-intensive mining sector, where the efficiency of capital deployment can significantly impact profitability.
Earnings Yield, on the other hand, is a measure of the earnings generated for each dollar invested in the stock. It's inversely related to the price-to-earnings (P/E) ratio, providing a useful gauge of value. Without a specific earnings yield for COPX, we lack immediate insight into the value proposition of the ETF based on its current price relative to the earnings it generates. Earnings yield can be a compelling metric for investors looking to understand the income-generating potential of their investments relative to their price, especially in sectors like copper mining where earnings can be cyclical.
In summary, both ROC and earnings yield are vital metrics for evaluating the investment merit of assets such as the Global X Copper Miners ETF (COPX). Despite the lack of specific values in this instance, understanding the importance of these metrics can guide investors in making informed decisions based on the efficiency and value the ETF might offer within their portfolios. Future assessments should aim to quantify these metrics for a more detailed analysis of COPX's performance and potential as an investment.
| Statistic Name | Statistic Value |
| R-squared | 0.451 |
| Adj. R-squared | 0.450 |
| F-statistic | 1029 |
| Prob (F-statistic) | 2.15e-165 |
| Log-Likelihood | -2485.3 |
| No. Observations | 1257 |
| AIC | 4975 |
| BIC | 4985 |
| Const | 0.0008 |
| Beta | 1.2001 |
| Alpha | 0.0008475094334092576 |
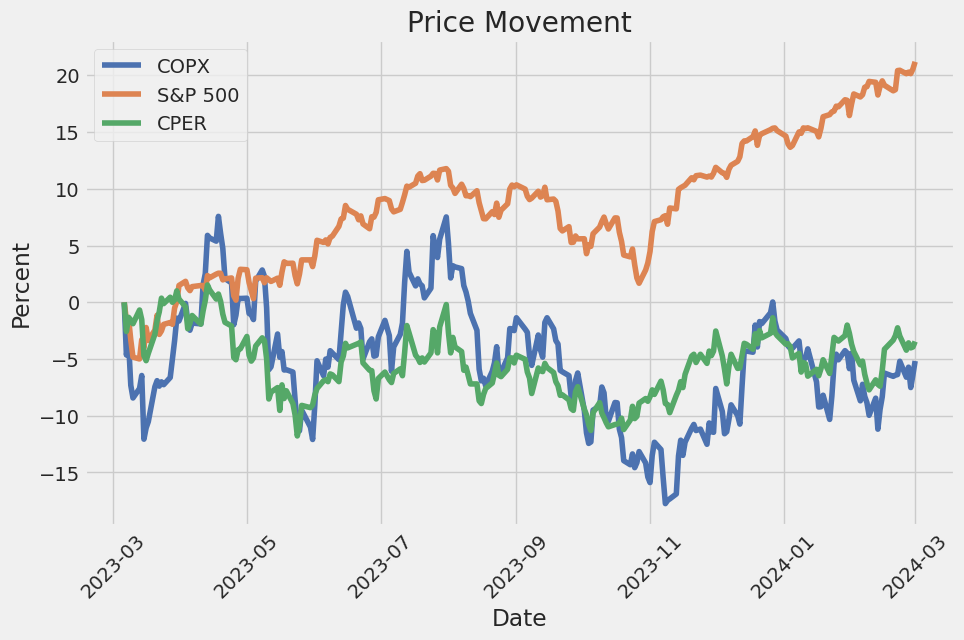
The relationship between COPX (Copper Producers Index) and SPY (S&P 500 ETF Trust) is quantitatively depicted through the linear regression model over the observed period, signaling a moderately significant correlation between the two variables. The alpha value of 0.0008475094334092576 reflects the expected return on the COPX when the SPYs return is zero, indicating a minimal but positive expected performance of the copper producers index independent of the market movement. Given the beta value of 1.2001, this relationship suggests that COPX moves in the same direction as the S&P 500 but with greater volatility, implying that for every 1% increase in the S&P 500, COPX is expected to increase by approximately 1.2%.
Moreover, the statistical indicators from the regression, such as the R-squared value of 0.451, suggest that approximately 45.1% of the variations in COPX can be explained by the movements in SPY. This percentage, alongside a highly significant F-statistic (2.15e-165), points towards a considerable degree of linear association between the market index and copper producers, validating the impact of broader market trends on the specific sector. These findings could serve as a basis for investors to gauge the responsiveness of copper-related investments to changes in overall market conditions, thereby enabling more informed decision-making in the context of portfolio diversification and risk assessment.
The Global X Copper Miners ETF (COPX) is currently positioned at the forefront of investment opportunities, particularly for those looking to leverage the ongoing and future demand for copper. This demand is significantly driven by the metal's indispensable role in facilitating the global transition towards sustainable energy and technology. Copper's exceptional electrical conductivity makes it a critical component in the development and deployment of electric vehicles (EVs), renewable energy systems, and broader electrification efforts worldwide. As these sectors continue to expand in response to global environmental policies and technological advancements, the demand for copper is expected to escalate accordingly.
This increasing demand comes at a time when the copper supply chain faces significant challenges. Key issues include declining ore grades in major copper mines and increased operational costs. These factors contribute to a tightening of the copper market, creating a scenario where demand outstrips supply, potentially leading to price appreciations. The COPX ETF, by offering diversified exposure to a selection of global copper mining companies, allows investors to navigate these market dynamics effectively. This exposure is particularly valuable given the ETF's alignment with the sectors poised for growth amidst the green transition.
The ETF's performance is inherently linked to the health of the global copper mining sector. Given the projected increase in copper demand for EV manufacture, renewable energy systems, and electrification projects, the COPX ETF is well-placed to benefit from these developments. This surge in demand, coupled with constrained supply growth due to historical underinvestment in copper exploration and mining development, outlines a bullish outlook for copper prices and, by extension, the COPX ETF.
Moreover, inflationary pressures and geopolitical tensions further influence the dynamics within the copper market. The commodity nature of copper allows the COPX ETF to act as an inflation hedge, offering potential value retention and appreciation in an inflationary economic environment. Additionally, geopolitical uncertainties, particularly in copper-rich regions, can lead to supply disruptions, further bolstering the case for investing in a diversified copper miners ETF like COPX.
Given this context, the Global X Copper Miners ETF emerges as a strategic investment vehicle, combining the growth prospects of the copper market with the diversification and risk mitigation benefits of an ETF. This aligns with broader economic recovery trends and environmental policy shifts, underscoring the ETF's potential for significant growth in the near and medium-term. The ETF's composition reflects this potential, with a selection of leading copper mining companies that are pivotal to the sector's growth.
| company | symbol | percent |
|---|---|---|
| Antofagasta PLC | ANTO.L | 5.89 |
| Ivanhoe Mines Ltd Class A | IVN.TO | 5.84 |
| Lundin Mining Corp | LUN.TO | 5.45 |
| Southern Copper Corp | SCCO | 5.04 |
| Freeport-McMoRan Inc | FCX | 4.93 |
| BHP Group Ltd | BHP.AX | 4.88 |
| KGHM Polska Miedz SA | KGH.WA | 4.78 |
| Sumitomo Metal Mining Co Ltd | 5713.T | 4.46 |
| Teck Resources Ltd Class B (Sub Voting) | TECK-B.TO | 4.45 |
| Zijin Mining Group Co Ltd Class H | 02899 | 4.44 |
The composition of the ETF, as illustrated in the "Top Ten Holdings" table, showcases a diversified portfolio of companies that are central to the copper supply chain. From leading miners like Antofagasta PLC and Ivanhoe Mines to giants in the industry such as Freeport-McMoRan Inc and BHP Group Ltd, the ETF's holdings encapsulate the breadth of the copper mining sector. This diversification not only mitigates the risks associated with individual stock volatility but also positions the ETF to capitalize on global copper demand trends.
In this vein, the comprehensive coverage offered by COPX across geographical and operational segments within the copper mining industry underscores its appeal to investors. As economies worldwide accelerate their green transitions, the strategic importance of copperand by extension, the companies involved in its extraction and productioncannot be overstated. Investing in COPX thus presents an opportunity to partake in the growth fueled by these enduring trends.
The Global X Copper Miners ETF (COPX) experienced significant volatility, as illustrated by the ARCH model results, highlighting the unpredictable nature of its returns. The model indicates a high level of fluctuation in the ETF's price with an omega coefficient of 4.0316 and an alpha[1] coefficient of 0.2187, demonstrating its sensitive reaction to market movements. These findings suggest that investors should be prepared for potential rapid changes in value, underlying the importance of monitoring market conditions closely when investing in such assets.
| Statistic Name | Statistic Value |
|---|---|
| R-squared | 0.000 |
| Adj. R-squared | 0.001 |
| Log-Likelihood | -2785.42 |
| AIC | 5574.84 |
| BIC | 5585.11 |
| No. Observations | 1257 |
| omega | 4.0316 |
| alpha[1] | 0.2187 |
To assess the financial risk associated with a $10,000 investment in Global X Copper Miners ETF (COPX) over a one-year period, a sophisticated analytical approach involving volatility modeling combined with machine learning predictions is employed. This method allows for a nuanced understanding of both the underlying volatility in the asset's returns and the prediction of its future performance.
Volatility modeling serves as a fundamental step in capturing the intrinsic fluctuation patterns of the COPX ETF. This model is particularly adept at identifying periods of increased variability and projecting these tendencies into the future. By analyzing historical price data, volatility modeling extrapolates the ETFs inherent volatility, offering a quantifiable measure of risk. This technique is crucial for investors aiming to understand the potential for future price swings and the implications for investment value.
Expanding on this foundation, machine learning predictions are utilized to forecast the specific future returns of the COPX ETF. By feeding a wealth of historical data into the model, including price fluctuations, volume changes, and broader market indicators, the machine learning algorithmbased on a series of decision treesanalyses patterns and relationships within the data, producing predictions about the future performance of the ETF. This approach is particularly useful for capturing non-linear dependencies and complex dynamics that traditional financial models might overlook.
Integrating the findings from both the volatility modeling and machine learning predictions, the analysis sharpens its focus on the risk assessment of the investment. One of the pivotal outcomes of this amalgamated approach is the calculation of the Value at Risk (VaR) at a 95% confidence interval. VaR offers a forward-looking, statistical estimate of the maximum potential loss an investment might experience under normal market conditions over a specified time frame.
For the $10,000 investment in the COPX ETF, the calculated Annual Value at Risk (VaR) at a 95% confidence interval stands at $302.62. This figure encapsulates the encapsulating projection that under typical market conditions, there is a 95% certainty that the investment will not lose more than $302.62 over the one-year period.
This comprehensive analysis, leveraging both the detailed insights into the ETFs price volatility and the forward-looking predictions of its returns, furnishes a multifaceted view of the investment risk. Such a nuanced approach not only delineates the probable financial risk but also underlines the effectiveness of synthesizing volatility modeling with machine learning predictions in understanding and anticipating the complexities of equity investment risk.
Analyzing the options for the Global X Copper Miners ETF (COPX) with an aim to target a stock price increase of 5% over the current price, the most profitable call options can be identified by closely examining the Greeks and other relevant metrics such as return on investment (ROI), profit, premium, and days to expiration.
Let's focus on options with a relatively short time to expiration but enough time for the stock to move, and with high delta values which indicate a strong correlation with the stock price movement. Also, options with good ROI percentages and profitable metrics would be of interest. Given these criteria, we can pinpoint a few options which stand out.
Firstly, the call option with a strike price of $35, expiring on 2024-03-15, is noteworthy. It has a delta of approximately 0.81, indicating that the option's price is likely to move about $0.81 for every $1 move in the underlying stock, which is favorable for short-term bullish speculation. The gamma of 0.15 suggests this delta could increase as the option moves closer to being in-the-money, making it even more sensitive to changes in the stock price. A high vega of about 1.73 indicates significant sensitivity to changes in implied volatility, which could be beneficial if volatility spikes. Despite the relatively high theta (time decay) of -0.025, the high ROI of approximately 151.73% and a profit of $1.9725 make this option particularly attractive for a short-term bullish strategy.
Another compelling option is the one with a strike price of $34, expiring on 2024-04-19. Its delta of about 0.80 suggests that it is also very responsive to the stock price movement. Though it carries a gamma of 0.08 which means its delta is less likely to change rapidly than the first option, its vega of approximately 3.59 points towards a substantial sensitivity to the implied volatility. Given its theta of -0.0131, its time decay is somewhat lower compared to the first option, despite having a longer life span until expiration. This option has a remarkably high ROI of approximately 94.20%, with a profit of $2.0725, standing out as a highly profitable mid-term investment if the stock moves as anticipated.
In comparison, if we consider longer-term options for a more conservative approach, the option with a strike price of $31, expiring on 2024-10-18 might catch the eye. It demonstrates a high delta of approximately 0.81, suggesting significant price movement sensitivity, alongside a lower theta of -0.0077, indicating less susceptibility to time decay over its longer lifespan. Though its ROI of about 5.39% is much lower than the earlier discussed options and the profit stands at $0.3725, the lower risk associated with its longer timeframe and gamma of 0.03 suggesting minimal change in its delta could appeal to investors looking for steadier, albeit slower, gains.
In conclusion, for a trader targeting a 5% increase in the COPX stock price over the short to mid-term, the options expiring on 2024-03-15 and 2024-04-19 with strike prices of $35 and $34, respectively, offer compelling prospects due to their high deltas, significant ROI, and considerable profits. However, for those preferring a conservative stance with longer-term potential, the option expiring on 2024-10-18 with a strike price of $31 could be appealing despite its lower ROI due to its reduced susceptibility to time decay and lower risk profile.
Similar Companies in Investment Trusts/Mutual Funds:
United States Copper Index Fund, LP (CPER), VanEck Rare Earth/Strategic Metals ETF (REMX), Global X Uranium ETF (URA), iPath Series B Bloomberg Copper Subindex Total Return ETN (JJC), SPDR S&P Metals and Mining ETF (XME), Freeport-McMoRan Inc. (FCX), Southern Copper Corporation (SCCO), BHP Group (BHP), Rio Tinto Group (RIO), Vale S.A. (VALE), Teck Resources Limited (TECK)
https://seekingalpha.com/article/4673661-copx-copper-miners-led-revenge-of-the-old-economy
Copyright © 2024 Tiny Computers (email@tinycomputers.io)
Report ID: k3KKTD
Cost: $0.15547
https://reports.tinycomputers.io/COPX/COPX-2024-03-03.html Home