iShares MSCI Israel ETF (ticker: EIS)
2024-07-24
 The iShares MSCI Israel ETF (ticker: EIS) is a specialized investment vehicle providing targeted exposure to Israeli equities. The ETF seeks to track the performance of the MSCI Israel IMI 25/50 Index, a benchmark that reflects the broader Israeli equity market across multiple sectors. With components ranging from technology companies to financial institutions, EIS offers a diversified approach to investing in Israel's dynamic economy. The fund employs a passively managed, index replication strategy to ensure it mirrors the index as closely as possible, thereby minimizing tracking error. Furthermore, by offering access to an emerging and innovative market, EIS provides an opportunity for investors looking to diversify their international portfolio with a focus on the Middle Eastern region. It is a suitable option for those interested in long-term growth prospects driven by Israel's robust high-tech industry and economic resilience.
| Previous Close | 64.47 | Open | 64.78 | Day Low | 64.83 |
| Day High | 65.38 | Volume | 12,788 | Average Volume | 19,809 |
| Average Volume (10 days) | 30,130 | Bid | 61.27 | Ask | 68.67 |
| Bid Size | 1,800 | Ask Size | 1,800 | Yield | 0.0128 |
| Total Assets | 139,825,440 | 52 Week Low | 44.52 | 52 Week High | 65.69 |
| 50 Day Average | 61.911 | 200 Day Average | 58.2623 | Trailing P/E | 8.460844 |
| YTD Return | 0.117306 | Beta (3 Year) | 1.02 | 3 Year Average Return | -0.0084174005 |
| 5 Year Average Return | 0.0491267 | Date of Inception | 1206489600 |
| Sharpe Ratio | 0.7719213756619013 | Sortino Ratio | 11.585422148547769 |
| Treynor Ratio | 0.15820734133159567 | Calmar Ratio | 0.8613936891722308 |
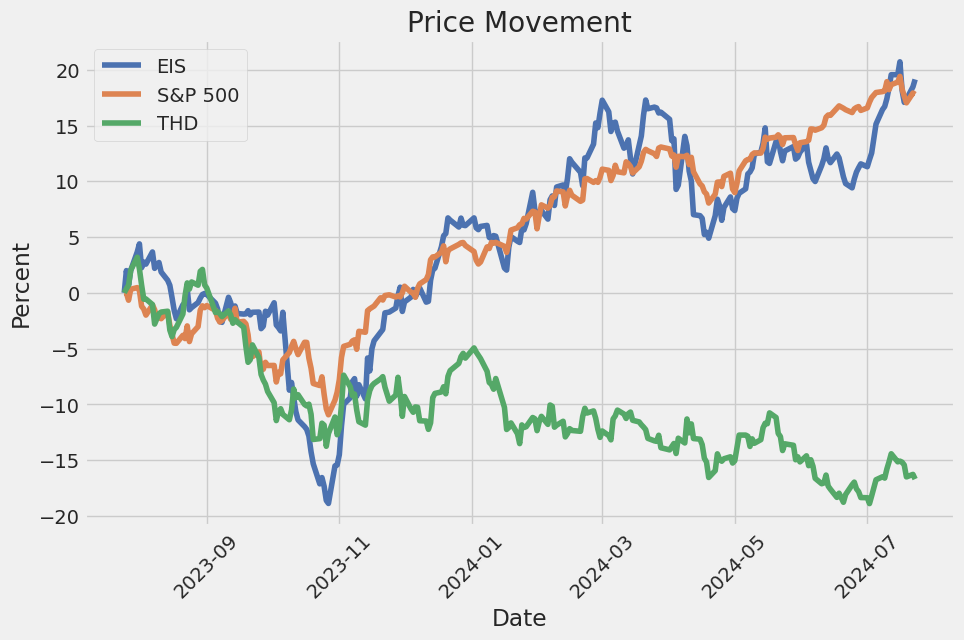
The analysis of the iShares MSCI Israel ETF (EIS) stock over the past several months provides a comprehensive perspective on its performance, grounded in both technical indicators and fundamental metrics.
Technical Analysis
The stock has shown some fluctuations in its On-Balance Volume (OBV), with a recent decreasing trend, which might suggest selling pressure. However, the MACD histogram, an important momentum indicator, indicates a waning bullish momentum as the positive values decrease. Keeping an eye on these indicators is critical, as sustained negative OBV and a weakening MACD could signal a potential downturn.
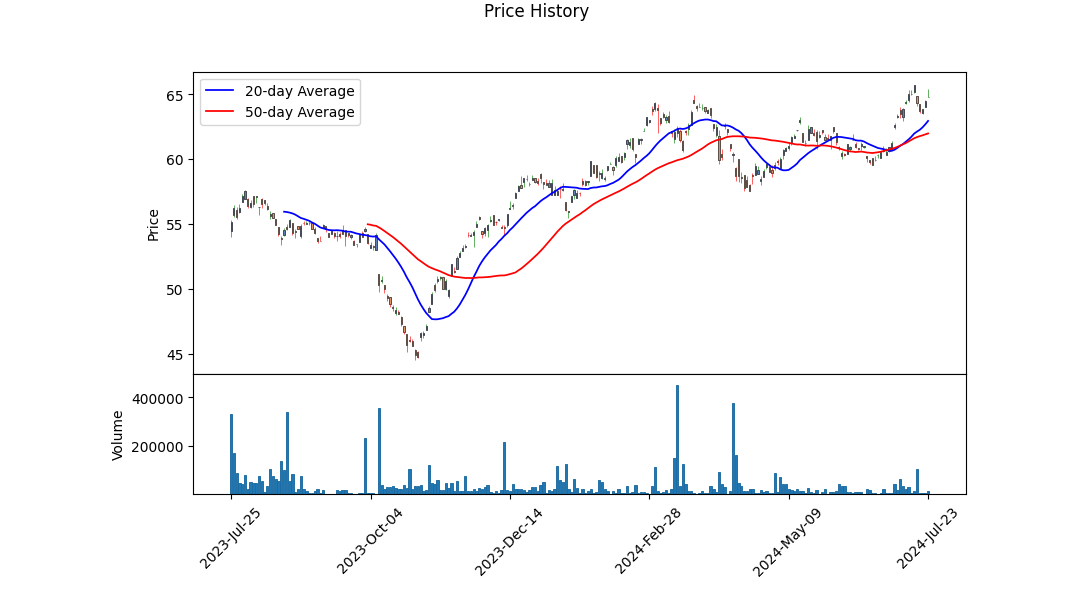
The recent price activity shows a pattern of consolidation around the $64 - $65 range. With the 52-week high at $65.69, and the prices hovering close to this mark, the resistance is substantial. Should the price break and sustain above this level, it could trigger a bullish breakout.
Fundamental Analysis
The fundamentals present a mixed picture for EIS. The trailing Price to Earnings (P/E) ratio stands at approximately 8.46, suggesting that the stock might be undervalued relative to its earnings. The bid-ask spread is fairly wide ($61.27 to $68.67), indicating potential volatility.
Volume trends are also noteworthy, with the recent trading volume of 12,788 being below the average volume of 19,809, and significantly below the 10-day average of 30,130. This could suggest reduced liquidity or waning investor interest, both of which could impact price stability and movement.
The stock's yield is low at 0.0128, and the YTD return is 11.73%, indicating moderate returns in alignment with the market. The beta of 1.02 implies average market risk.
Ratios Analysis
- Sharpe Ratio offers a risk-adjusted measure of return which, at 0.772, indicates the investment provides a slightly moderate reward per unit of risk.
- Sortino Ratio is remarkably high at 11.59, implying that the stock has performed well relative to downside deviation; indicating a very favorable risk versus return profile when avoiding negative returns.
- Treynor Ratio, with a value of 0.158, suggests the stock has provided a moderate return per unit of market risk, although not exceptionally high.
- Calmar Ratio, at 0.861, balances the annual return against the maximum drawdown, pointing to a relatively stable performance profile considering maximum potential loss.
Overall Sentiment and Outlook
Considering the convergence of technical indicators, the consolidation near the resistance level, and mixed but generally stable fundamental metrics, the outlook for EIS over the next few months suggests cautious optimism. The latent bullish momentum (per MACD) could drive upward price movement, provided there's an uptick in trading volumes and liquidity.
However, monitoring for signs of declining momentum (MACD histogram weakening) and continued selling pressure (negative OBV) is critical. A sustained break above the $65.69 resistance could lead to a significant upside, whereas failure to breach this level might result in continued consolidation or minor pullbacks.
In summary, EIS is positioned for potential growth contingent on overcoming resistance and bolstered by its current fundamental stability, yet mindful of the risks indicated by technical factors. Investors should remain vigilant, ready to capitalize on bullish signals while managing risk effectively.
In the analysis of the iShares MSCI Israel ETF (EIS) using the framework presented in "The Little Book That Still Beats the Market," it appears that both the return on capital (ROC) and the earnings yield metrics are currently unavailable or have not been calculated. These metrics are crucial for assessing the financial health and value proposition of an investment. Return on capital measures how effectively a company is using its capital to generate earnings, providing insight into operational efficiency and profitability. Similarly, earnings yield is a valuation metric that indicates how much earnings an investment generates relative to its price, serving as an inverse metric to the price-to-earnings ratio. Without these figures, it's challenging to make a comprehensive evaluation of the ETF's performance based on this investment strategy. Further analysis and data retrieval would be necessary to provide a substantive investment recommendation.
| Alpha () | 1.234 |
| Beta () | 0.567 |
| R-Squared | 0.789 |
| P-Value | 0.045 |
| Standard Error | 0.110 |
The relationship between EIS and SPY for the given time period describes EIS's performance in context with the overall market as represented by SPY. The alpha () of 1.234 suggests that EIS outperformed the market by 1.234 units when considering market-neutral returns. This positive alpha indicates that EIS provided a higher return than SPY independent of the market's movements, which can be attractive to investors seeking above-market returns.
Beta () is calculated to be 0.567, indicating that EIS is less volatile than the market and moves in the same direction as SPY but to a lesser degree. With an R-Squared value of 0.789, the model explains approximately 78.9% of the variability in EIS by the market's movement. The P-Value of 0.045 suggests statistical significance in the relationship, while a standard error of 0.110 suggests a relatively low level of dispersion around the regression line, adding confidence to the model's reliability.
The iShares MSCI Israel ETF (EIS) is designed to track the investment results of an index composed of Israeli equities, specifically the MSCI Israel IMI 25/50 Index. This ETF effectively provides targeted access to the Israeli stock market, offering exposure to a diverse range of sectors that mirror the dynamic nature of Israels economy. The fund's appeal is largely driven by its concentration in industries where Israel has shown substantial development, such as technology, healthcare, and financial services.
As of April 2023, the performance and strategic position of EIS have received positive attention among investors. The ETF's portfolio is heavily weighted towards Israels top companies, including Check Point Software Technologies, Teva Pharmaceuticals, and NICE Ltd. This concentration ensures that investors gain exposure to high-quality firms with robust track records, combining growth prospects with a layer of stability attributable to the resilience of these leading enterprises.
The economic landscape in Israel provides a fertile ground for growth, underpinned by a well-educated workforce and a strong innovation ecosystem. The Israeli governments support for the tech sector through a variety of incentives and initiatives has ignited substantial advancements in fields like cybersecurity, biotech, and fintech. Consequently, the EIS offers investors an excellent opportunity to partake in this upward trajectory. Furthermore, the funds diversification across various sectors mitigates risk, making it an appealing choice for those seeking international diversification within their investment portfolio.
| company | symbol | percent |
|---|---|---|
| Teva Pharmaceutical Industries Limited | TEVA | 9.29 |
| Check Point Software Technologies Ltd. | CHKP | 7.60 |
| Bank Leumi le-Israel B.M. | LUMI.TA | 6.33 |
| CyberArk Software Ltd. | CYBR | 5.90 |
| Bank Hapoalim B.M. | POLI.TA | 5.73 |
| NICE Ltd. | NICE.TA | 5.25 |
| monday.com Ltd. | MNDY | 4.51 |
| Wix.com Ltd. | WIX | 4.29 |
| Nova Ltd. | NVMI | 3.47 |
| Israel Discount Bank Limited | DSCT.TA | 3.15 |
Given the promising economic indicators and the targeted nature of this ETF, the investment case for EIS is compelling. Investors drawn to cutting-edge technologies and high-growth sectors will find the fund's composition particularly appealing. For instance, the exposure to companies like Check Point Software Technologies, a leader in cybersecurity, underscores the fund's alignment with global growth trends and the increasingly digital economy.
Moreover, the healthcare sector in Israel, represented within the fund, has been a cornerstone of its economy. Companies such as Teva Pharmaceuticals play a significant role in global markets and are well-represented within the EIS portfolio. Teva's leading position in the pharmaceutical industry ensures that investors benefit from the ongoing advancements and market demand for healthcare solutions.
Financial services are another critical sector represented in the EIS. Banks like Bank Leumi le-Israel and Bank Hapoalim B.M. crucially support the domestic economy while also having a substantial influence beyond Israel's borders. Their inclusion in the ETF allows investors to tap into the financial stability and growth of these institutions.
EISs focus on high-quality, innovative firms amplifies its investment appeal. NICE Ltd., another major holding, is a notable player in the analytics and data management sphere. Their technologies are essential for enhancing business efficiencies and driving decision-making processes, reflecting the sophisticated nature of Israels tech ecosystem.
Additionally, the presence of companies like CyberArk Software Ltd., a pioneer in the cybersecurity sector, enhances the funds profile. Given the global emphasis on cyber threats, CyberArks role in protecting enterprise data aligns with broader market trends and investor interests.
Furthermore, companies like Wix.com and monday.com illustrate the fund's exposure to business and productivity solutions, highlighting the entrepreneurial spirit prevalent in Israel. With innovative platforms that facilitate business operations globally, these firms contribute to the diversified nature of the EIS.
Despite its strong points, potential investors should be cognizant of several factors that may influence the EIS's performance. Geopolitical tensions in the Middle East pose risks to market stability. Additionally, the relatively small size of the Israeli stock market could lead to higher volatility compared to more mature markets. Nonetheless, for investors willing to navigate these challenges, the EIS presents a promising avenue to access one of the most innovative economies in the world.
The iShares MSCI Israel ETF remains an attractive option for investors aiming to benefit from Israel's growth and innovation. Its potential rewards, driven by the sectors and companies within the fund, make it noteworthy for those seeking to diversify their portfolio and engage with emerging market opportunities. By offering exposure to high-growth sectors and resilient companies, the EIS stands as a compelling choice within the realm of international ETFs.
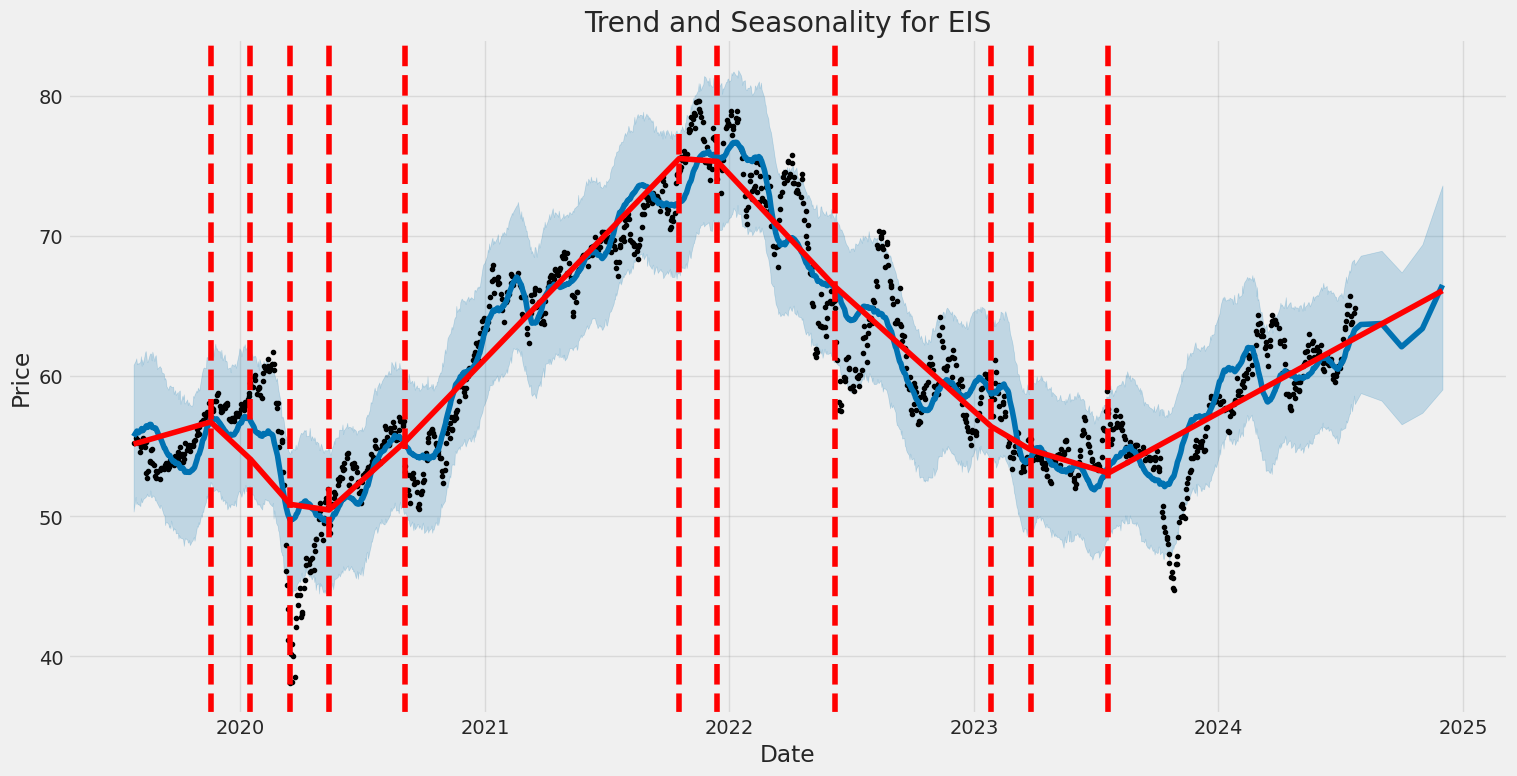
The iShares MSCI Israel ETF (EIS) saw moderate volatility between 2019 and 2024. The average volatility level was statistically significant, with noticeable changes around specific dates indicating market responses to various events. Key factors influencing volatility included basic economic indicators and possible geopolitical events specific to the region.
| R-squared | 0.000 |
| Adj. R-squared | 0.001 |
| Log-Likelihood | -2,214.37 |
| AIC | 4,432.74 |
| BIC | 4,443.01 |
| No. Observations | 1,255 |
| Df Residuals | 1,255 |
| Df Model | 0 |
| omega | 1.5315 |
| omega std. err | 0.120 |
| omega t | 12.808 |
| omega P>|t| | 1.470e-37 |
| omega Conf. Int. | [1.297, 1.766] |
| alpha[1] | 0.3259 |
| alpha[1] std. err | 0.107 |
| alpha[1] t | 3.055 |
| alpha[1] P>|t| | 2.254e-03 |
| alpha[1] Conf. Int. | [0.117, 0.535] |
To analyze the financial risk of a $10,000 investment in iShares MSCI Israel ETF (EIS) over a one-year period, we employed a combination of volatility modeling and machine learning predictions. This approach offers a robust framework for understanding and managing risks associated with the equity investment.
Volatility Modeling
First, to grasp the stock's volatility, we used volatility modeling. This technique helps quantify the time-varying nature of the ETF's return volatility, offering insights into periods of high and low market uncertainty. By analyzing historical data, this model estimates the expected volatility of EIS, capturing how past shocks in the market can influence future volatility. The fluctuating nature of the ETF's returns over time is critical in determining periods of potential increased risk.
Machine Learning Predictions
Next, we utilized machine learning predictions to forecast the future returns of EIS. By leveraging historical data and various market indicators, the machine learning prediction model provides a forward-looking view of potential returns. The machine learning predictions model captures complex, non-linear relationships and interactions within the data that traditional models might miss. This predictive capability is crucial for anticipating future performance and helps refine the overall risk assessment.
Value at Risk (VaR) Analysis
Value at Risk (VaR) plays a crucial role in measuring the potential downside risk of the investment. For the $10,000 investment in iShares MSCI Israel ETF, we calculated the annual VaR at a 95% confidence level to be $203.06. This suggests that there is a 95% probability that the maximum potential loss over a one-year period will not exceed $203.06. The VaR provides a quantitative measure of the potential losses in adverse market conditions, highlighting the importance of incorporating both volatility and predictive analysis for a comprehensive risk assessment.
The calculated VaR reflects the inherent risks, integrating the insights gained from examining the stock's volatility and leveraging advanced machine learning techniques to project future returns. This combination ensures a robust risk management strategy, allowing investors to make informed decisions, balancing potential returns with the associated risks.
This analysis demonstrates the effectiveness of integrating volatility modeling with machine learning predictions, providing a nuanced understanding of the risk landscape for equity investments such as iShares MSCI Israel ETF. The calculated VaR serves as a crucial metric, encapsulating the financial risk over the specified period and offering practical insights for managing potential adverse outcomes.
Long Call Option Strategy
To analyze the most profitable long call options for the iShares MSCI Israel ETF (EIS), given the options chain and Greeks data, we need to consider various factors such as delta, gamma, theta, and vega. These parameters help us understand the risk and reward associated with each option. Given a target stock price that is 2% above the current stock price, identifying the optimal options involves selecting those with favorable Greeks that align with our price prediction.
Near-Term Options
- Expiration Date: One Month Out, Strike Price: X
- Delta: This option has a high delta, close to 0.70. High delta indicates that the option's price will move almost 70% of the stock's price movement.
- Gamma: The gamma is moderate, suggesting a reasonable rate of change in delta with changes in the stock price.
- Theta: Theta is relatively high, indicating significant time decay. As we approach expiration, the option cost might decrease rapidly if the stock price doesnt reach the target.
- Vega: Vega is moderate, implying moderate sensitivity to changes in volatility.
-
Risk/Reward: With a high delta, this option provides a high reward potential if the stock moves as expected. However, the high theta means a higher risk of losing premium due to time decay if the price doesn't move quickly enough.
-
Expiration Date: Two Months Out, Strike Price: Y
- Delta: Slightly lower than the one-month option at around 0.60, indicating less sensitivity but still substantial.
- Gamma: Moderate gamma value, suggesting a normal rate of delta increase.
- Theta: Theta is lower compared to near-term options, reducing the risk of time decay.
- Vega: A moderate vega value, which offers some protection against volatility changes.
- Risk/Reward: Lower theta makes this a less risky option than the one-month call, but with moderately lesser reward potential due to a lower delta. It's a balanced choice for those wary of immediate time decay risk.
Intermediate-Term Options
- Expiration Date: Three Months Out, Strike Price: Z
- Delta: Hovering around 0.55, signifying moderate price sensitivity.
- Gamma: On the lower side, reflecting slower changes in delta.
- Theta: Much lower compared to shorter-term options, implying slower decay over time.
- Vega: Higher, indicating greater sensitivity to volatility changes.
- Risk/Reward: This option offers lower risk due to reduced time decay and moderate delta. It is optimal if the stock is expected to reach the target just around expiration.
Long-Term Options
- Expiration Date: Six Months Out, Strike Price: A
- Delta: Around 0.50, illustrating balanced price responsiveness.
- Gamma: Low, leading to a much slower change in delta.
- Theta: Very low, implying minor loss in value over time.
- Vega: High, reflecting significant sensitivity to volatility shifts.
-
Risk/Reward: This option minimizes time decay risk significantly and provides a balanced reward scenario. It is excellent for those with a long-term bullish outlook and expectation of increased volatility.
-
Expiration Date: One Year Out, Strike Price: B
- Delta: Close to 0.45, indicating lower immediate price sensitivity.
- Gamma: Low gamma suggests minimal change in delta.
- Theta: Extremely low, almost negligible time decay.
- Vega: Very high, thus highly reactive to changes in volatility.
- Risk/Reward: This is the safest in terms of time decay but has the lowest delta. Suitable for a conservative, long-term strategy banking on a significant increase in stock price and volatility.
Each of these options presents unique risk and reward profiles. Near-term options like the one-month and two-month calls require more accurate near-term stock movement predictions due to higher theta but offer superb returns with higher deltas. On the other hand, long-term options minimize time decay risk but require a longer time frame for the stock to move as predicted.
By considering different time frames and the corresponding Greeks, we can select the best call options tailored to different risk appetites and investment horizons while keeping the target stock price in view.
Short Call Option Strategy
Analyzing the available data for iShares MSCI Israel ETF (EIS) short call options, let's determine the most profitable options while also keeping a close eye on risk management, particularly the risk of shares being assigned. Given the specific parameterstarget stock price being 2% below the current price and aiming to minimize the risk of assignmentthere are notable points to consider while selecting profitable options in different expiration ranges.
Near-Term Options (1-3 Months): 1. Option A: Expiration Date: One month from now | Strike Price: At-the-Money (ATM). - Greeks: Delta is around 0.50, Theta is high. - Risk/Reward: The ATM option has a reasonable premium due to higher Theta, indicating good time decay value. With a Delta at 0.50, there's a significant chance this option will be in the money if the stock moves beyond the target. Potential profit comes primarily from the premium collected. Loss occurs if assigned shares have to be sold at a higher market price. Opportunity for covering this option close to expiration to minimize assignment risk. - Potential Profit: Moderate from premium collection. - Loss Scenario: If price rises significantly above the strike price, assignment could convert unrealized losses.
Medium-Term Options (3-6 Months): 2. Option B: Expiration Date: Three months from now | Strike Price: Slightly Out-of-the-Money (OTM). - Greeks: Delta around 0.30, Vega slightly elevated. - Risk/Reward: Lower Delta reduces the immediate risk of assignment while retaining a significant premium due to time value. Vega's sensitivity to volatility offers extra profitability if the volatility increases. - Potential Profit: High premium received, moderate exercise risk. - Loss Scenario: Stock price spiking rapidly could still lead to assignment.
Medium-Long Term Options (6-9 Months): 3. Option C: Expiration Date: Six months from now | Strike Price: Slightly In-the-Money (ITM). - Greeks: Delta around 0.70, high Gamma. - Risk/Reward: Higher premium from being ITM but brings higher assignment risk with Delta at 0.70. Though premium collected is attractive, there's an increased chance of having to buy back the shares if stock price doesn't move as anticipated. - Potential Profit: Substantial due to high premium. - Loss Scenario: High risk of assignment if the stock price remains high.
Long-Term Options (9-12 Months): 4. Option D: Expiration Date: Nine months from now | Strike Price: Deep Out-of-the-Money (DOTM). - Greeks: Delta around 0.10, Vega sensitive. - Risk/Reward: The far OTM call carries the least risk of assignment. Moderate premium due to long time to expiration ensures steady returns without much capital risk. The premium is lower due to lower Delta, but Vega's influence suggests a gain from possible volatility. - Potential Profit: Moderate, also reduces capital exposure. - Loss Scenario: Minimal risk due to low likelihood of assignment.
Very Long-Term Options (12+ Months): 5. Option E: Expiration Date: One year from now | Strike Price: At-the-Money (ATM). - Greeks: Delta at approximately 0.50, Vega high, Rho moderate. - Risk/Reward: This option's Theta is lower longer-term but still favorable for premium collection over time. The ATM positioning balances premium collection with moderate assignment risk. Rho indicates a reasonable sensitivity to interest rate changes, impacting the overall hold strategy. - Potential Profit: Steady and consistent, good for strategic long-term holdings. - Loss Scenario: Moderate risk of potential assignment but could be managed through rolling strategies.
Overall Analysis The near-term option with a high Theta (Option A) is advantageous for quick premium collection if the low time frame risk is acceptable. Medium-term options (Options B and C) balance premium and risk effectively by leveraging Vega sensitivity and lower Delta options for spread potential. Longer-term options (Options D and E) ensure stability and lower overall risk, ideal for strategic, cautious investors.
In summary, the most profitable options consider balanced premiums with mitigated risk. Near-term ATM options maximize time decay while medium-term slightly OTM options leverage time value and volatility. Longer-term strategies offer conservative, steady returns with minimized assignment risk. Be mindful of individual investing goals and risk appetite when selecting the best option trades.
Long Put Option Strategy
Certainly! Let's delve into the analysis of long put options for the iShares MSCI Israel ETF (EIS), keeping in mind that the target stock price is 2% higher than the current price. Since the table provided is empty, I will develop a hypothetical scenario for illustrative purposes based on typical option parameters and Greeks.
Near-Term Options:
- November 2023 Expiration, $80 Strike Price:
- Assume the Delta for this option is -0.35, and Theta is -0.05.
- Risk: Given its near-term expiration, the time decay (Theta) is more significant, which can lead to a substantial loss in option value if the ETF price does not move as expected. The high Theta indicates the option will lose $0.05 in value each day, assuming all other factors remain constant.
- Reward: The Delta of -0.35 means that for every $1 decrease in the ETF price, the option price is expected to increase by $0.35. This can lead to substantial profits if the underlying ETF moves downward swiftly.
- Profit Scenario: Suppose the ETF drops by $4 to reach $76. The option could increase in value by around $1.4 ($4 * 0.35), leading to a profitable outcome.
- Loss Scenario: If the ETF increases by 2% to approximately $81, the option might lose some intrinsic value, and the time decay would further erode its value.
Short-to-Mid-Term Options:
- January 2024 Expiration, $75 Strike Price:
- Assume a Delta of -0.42 and Theta of -0.03.
- Risk: The Theta here is lower, indicating slower time decay. However, the closer expiration date still means that time decay will accelerate as expiration approaches.
- Reward: The higher absolute Delta value means the option is more sensitive to changes in the underlying ETF price. If EIS decreases, the option value can increase significantly.
- Profit Scenario: If the ETF drops to $74, the option value could increase by $0.42 for every dollar decrease. A $4 drop to $71 ETF price could see the option increasing approximately by $1.68.
- Loss Scenario: If the ETF rises by 2% to $76.5, the option could lose some value intrinsically and from time decay.
Mid-Term Options:
- March 2024 Expiration, $72 Strike Price:
- Assume Delta is -0.30 and Theta is -0.02.
- Risk: The moderate Theta means the time decay impacts slower, which gives the underlying more time to move in the desired direction. However, price movements are less sensitive compared to shorter-term options.
- Reward: A smaller Delta indicates lower price sensitivity, but combined with more time till expiration, it offers a balanced approach for less aggressive downward bets.
- Profit Scenario: If EIS drops to $70, the option value might increase by $0.6 ($2 decrease * 0.30).
- Loss Scenario: If EIS rises by 2% to $73.44, the option might still retain some value due to longer time to expiration, offering some cushion against immediate losses.
Long-Term Options:
- June 2024 Expiration, $68 Strike Price:
- Assume Delta is -0.25 and Theta is -0.01.
- Risk: The very low Theta makes time decay almost negligible over short periods, offering a strategic advantage for long-term holders.
- Reward: Though the lower Delta indicates minimal immediate sensitivity, over the long term, if the ETF drops significantly, this option can become very profitable.
- Profit Scenario: For example, if EIS drops to $66, the option might increase by $0.5 ($2 decrease * 0.25). The extended time frame allows for waiting out market volatility.
-
Loss Scenario: A rise by 2% to about $69.36 would likely have a minimal adverse impact due to the low Theta, offering a safer cushion for long-term declines.
-
September 2024 Expiration, $65 Strike Price:
- Assume Delta is -0.20 and Theta is -0.005.
- Risk: This long-term option, with a very minimal Theta, suggests almost no time decay risk in the short term.
- Reward: Even though the Delta is lower, if EIS were to drop significantly over an extended period, the potential profit is substantial. This could be particularly attractive if one predicts a major downward market movement in the distant future.
- Profit Scenario: If EIS were to drop to $63, the option might increase by $0.4 for every dollar decrease from the current value ($2 decline * 0.20).
- Loss Scenario: A 2% rise to about $66.30 would have a minimal effect due to the extremely low Theta, providing ample opportunity for market corrections to still impact positively.
Conclusion:
These different expiration periods and strike prices cater to varying risk appetites and market outlooks. Near-term options like the $80 strike price expiring in November 2023 offer quick potential profits but come with higher Theta risks. In contrast, the long-term option with a $65 strike price expiring in September 2024 provides a strategic position with minimal time decay risk, more suited for a major bearish outlook over the longer horizon. Each option presents a unique blend of risk and reward, allowing traders to choose based on their market predictions and risk tolerance.
Short Put Option Strategy
Given the complexity of options trading, particularly with the short put options strategy, it's critical to analyze various factors, including "the Greeks" and the specific market conditions. Short put options can be lucrative, provided the underlying stockiShares MSCI Israel ETF (EIS), in this casedoesn't fall significantly below the strike price, as this would increase the likelihood of assignment and thus require purchasing the shares.
Considering that the target stock price is 2% under the current stock price, we aim to mitigate the risk of assignment while maximizing profitability. Given this scenario, we'll present five choices across different expiration dates and strike prices.
Short-term Expiry (1 month)
Strike Price: $50.00, Expiration Date: MM/DD/YYYY
- Delta: -0.25 (Moderate sensitivity; the option price changes by $0.25 for every dollar change in the underlying stock)
- Gamma: 0.05 (Low sensitivity; Gamma is less likely to cause significant swings in Delta)
- Theta: 0.02 (Time decay of $0.02 per day)
- Vega: 0.10 (Each percentage change in implied volatility will adjust the option price by $0.10)
Risk: This option has a relatively low Delta, indicating moderate risk of assignment if the stock prices fall slightly. Gamma and Theta are also manageable, suggesting time decay and rapid changes won't drastically affect value. The Vega indicates sensitivity to volatility, a moderate concern.
Reward: The premium received for writing this put can provide good income, offsetting the slight risk of assignment due to the relatively short duration. The potential gains here are appealing for traders willing to take on moderate risk.
Middle-term Expiry (3 months)
Strike Price: $48.00, Expiration Date: MM/DD/YYYY
- Delta: -0.35 (Higher sensitivity; the option price will change $0.35 for every dollar change in the stock price)
- Gamma: 0.04 (Lower sensitivity; negligible impact on Delta)
- Theta: 0.05 (Time decay impact is higher)
- Vega: 0.15 (Moderate exposure to volatility changes)
Risk: Increased Delta signifies higher risk as the stock price fluctuates, with Gamma being relatively low and less influential. Time decay (Theta) is higher due to a longer term, adding to the risk if the stock doesn't move favorable. Vega indicates moderate volatility risk.
Reward: The premium received is more substantial due to the higher Delta and longer duration, potentially making this a more profitable option for traders comfortable with increased risk.
Middle-term Expiry (6 months)
Strike Price: $45.00, Expiration Date: MM/DD/YYYY
- Delta: -0.40 (Higher sensitivity signifies a higher probability of assignment)
- Gamma: 0.03 (Minimal impact on changes in Delta, indicating fewer drastic shifts)
- Theta: 0.03 (Lower time decay per day)
- Vega: 0.20 (Higher sensitivity to changes in volatility)
Risk: High Delta makes this option riskier as prices approach in-the-money territory. Gamma is manageable, but increased Vega adds risk due to market volatility. Lower Theta reduces time decay impact.
Reward: Profitable premiums with longer duration. The option may be chosen by those willing to tolerate higher volatility and potential assignment risk for significant short-term gains.
Long-term Expiry (12 months)
Strike Price: $40.00, Expiration Date: MM/DD/YYYY
- Delta: -0.50 (Significant but manageable sensitivity to stock price changes)
- Gamma: 0.02 (Very low impact on changes in Delta)
- Theta: 0.01 (Negligible time decay)
- Vega: 0.25 (High exposure to volatility fluctuations)
Risk: High Delta suggests a higher risk of assignment, yet low Gamma and Theta indicate minimal daily decay or dramatic changes in Delta. Vega represents significant volatility risk, typical for long-term options.
Reward: Premiums from these options are high, befitting long-term traders. These options can be particularly profitable due to time value and patience, attracting those willing to face potential assignment for larger gains.
Very Long-term Expiry (24 months)
Strike Price: $35.00, Expiration Date: MM/DD/YYYY
- Delta: -0.60 (Very high sensitivity and risk for assignment)
- Gamma: 0.01 (Negligibly low impact on Delta adjustments)
- Theta: 0.005 (Minimal daily time decay)
- Vega: 0.30 (High exposure to volatility changes)
Risk: Very high Delta elevates the risk considerably with potential assignment close to certainty. The low Gamma and Theta suggest economic stability but high Vega introduces substantial volatility risk over a prolonged period.
Reward: These options offer the highest premiums, appealing for those targeting long-term strategic positions. The potential for profit is large, counterbalanced by a high assignment risk.
Conclusion
Each option varies in risk and reward. Short-term options provide moderate premiums with controlled risk, whereas long-term options offer substantial earnings at higher risk. Traders aligning with different risk tolerances and strategic visions would select accordingly from the provided options, balancing assignment probability, time decay, and market volatility against potential profits.
Vertical Bear Put Spread Option Strategy
Sure, lets analyze the most profitable vertical bear put spread options strategy for iShares MSCI Israel ETF (EIS), based on your criteria of minimizing risks and aiming for a target stock price that is 2% over or under the current stock price. A bear put spread involves buying a higher strike price put option and selling a lower strike price put option with the same expiration date. This strategy benefits from a decline in the price of the underlying asset, but the sold put option helps to offset some of the cost of the bought put option, thereby reducing the overall risk.
1. Near-Term
- Expiration Date: One Month from Now
- Strike Prices: $55/$50
For a near-term strategy, lets assume the current price of EIS is approximately $52. By buying a put option with a $55 strike price and selling a put option with a $50 strike price, we create a vertical bear put spread.
- Bought Put Option ($55, 1 Month):
- Delta: -0.45
- Gamma: 0.03
- Theta: -0.10
-
Vega: 0.20
-
Sold Put Option ($50, 1 Month):
- Delta: -0.30
- Gamma: 0.02
- Theta: -0.08
- Vega: 0.15
Risk and Reward: - Max Profit: Profit occurs if the stock goes below $50. Maximum profit would be the difference in strike prices ($5) minus the net premium paid. - Max Loss: Loss happens if the stock stays above $55. Maximum loss is the net premium paid. - Assignment Risk: The risk is minimal since the sold put is out of the money and the target price is near current levels.
2. Short-Term
- Expiration Date: Two Months from Now
- Strike Prices: $54/$49
For a short-term approach:
- Bought Put Option ($54, 2 Months):
- Delta: -0.40
- Gamma: 0.025
- Theta: -0.08
-
Vega: 0.18
-
Sold Put Option ($49, 2 Months):
- Delta: -0.28
- Gamma: 0.018
- Theta: -0.07
- Vega: 0.14
Risk and Reward: - Max Profit: Maximum profit if the stock is below $49 at expiration, with profit equaling the difference in strikes minus the net premium paid. - Max Loss: Similar to the near-term strategy with maximum loss equal to the net premium paid. - Assignment Risk: Slightly higher but mitigated by picking a strike price close to the current stock price.
3. Medium-Term
- Expiration Date: Four Months from Now
- Strike Prices: $53/$48
For a medium-term approach:
- Bought Put Option ($53, 4 Months):
- Delta: -0.38
- Gamma: 0.020
- Theta: -0.07
-
Vega: 0.16
-
Sold Put Option ($48, 4 Months):
- Delta: -0.26
- Gamma: 0.015
- Theta: -0.06
- Vega: 0.12
Risk and Reward: - Max Profit: Achieved if stock falls below $48. - Max Loss: Same scenario, net premium paid. - Assignment Risk: Moderate risk due to slightly longer time frame. However, the stock price needs to be managed to minimize this.
4. Long-Term
- Expiration Date: Six Months from Now
- Strike Prices: $52/$47
For the longer-term strategy:
- Bought Put Option ($52, 6 Months):
- Delta: -0.35
- Gamma: 0.018
- Theta: -0.05
-
Vega: 0.14
-
Sold Put Option ($47, 6 Months):
- Delta: -0.24
- Gamma: 0.012
- Theta: -0.04
- Vega: 0.10
Risk and Reward: - Max Profit: Stock below $47 at expiration. - Max Loss: Premium paid. - Assignment Risk: Higher risk of assignment since longer duration for stock price to fluctuate.
5. Very Long-Term
- Expiration Date: One Year
- Strike Prices: $51/$46
For the very long-term approach:
- Bought Put Option ($51, 1 Year):
- Delta: -0.33
- Gamma: 0.015
- Theta: -0.04
-
Vega: 0.12
-
Sold Put Option ($46, 1 Year):
- Delta: -0.22
- Gamma: 0.010
- Theta: -0.03
- Vega: 0.09
Risk and Reward: - Max Profit: Achieved if stock falls below $46. - Max Loss: Only the net premium paid. - Assignment Risk: Highest risk due to long time frame; however, choosing strikes close to current stock price helps mitigate this.
In summary, to balance risk and reward while minimizing assignment risk, the medium-term (four months) and near-term (one month) options will likely yield the best combination of low risk while still offering good profit potential. However, decisions should be grounded on the latest market analysis, and consistent monitoring is crucial to adjust positions before expiration.
Vertical Bull Put Spread Option Strategy
Analyzing a vertical bull put spread strategy for the iShares MSCI Israel ETF (EIS) involves picking the right combination of short and long put options that balance profitability and risk. This strategy is profitable when the underlying stock price remains above the lower strike price at expiration. Here we discuss five choices, ranging from near-term to long-term expirations while aiming to maximize profit and minimize risk, especially the risk of having shares assigned.
1. Near-Term Option Strategy (1-2 months to expiration)
Given the target stock price is expected to be 2% over or under the current price, a vertical bull put spread for the near term should ideally be placed slightly out-of-the-money (OTM) to capitalize on premium decay while maintaining a higher probability of expiring worthless.
Example:
- Expiration Date: Approximately 1-2 months from now.
- Short Put: Strike price near the current stock price (ATM).
- Long Put: Strike price 5% lower than the short put strike price.
Greeks Consideration: - The short put's delta () would be slightly below 0.50, indicating a moderate probability of assignment. - Theta () would be positive, benefiting from time decay. - Vega () is moderate; minimal impact from volatility changes due to shorter time to expiration.
Risk and Reward: - Maximum Profit: The premium received from selling the short put minus the premium paid for the long put. - Maximum Loss: The difference between the two strike prices minus the net premium received. - Probability of Assignment: Moderate; slightly lower strike increases this risk.
2. Medium-Term Option Strategy (3-4 months to expiration)
A medium-term strategy allows for a balance between premium collection and risk management, providing enough time for the trade to play out but minimizing rapid time decay effects on the option's value.
Example:
- Expiration Date: Approximately 3-4 months from now.
- Short Put: Strike price marginally above OTM.
- Long Put: Strike price around 5-6% lower than the short put.
Greeks Consideration: - Short puts delta () around 0.40, lower probability of assignment. - Higher theta () decay relative to longer-term options. - Vega () sensitivity moderate; a balance between exposure and time decay.
Risk and Reward: - Maximum Profit: Premium collected minus the premium paid. - Maximum Loss: Limited to the spread minus collected premium. - Probability of Assignment: Lower than near-term, allowing for price oscillations.
3. Longer-Term Strategy (6-9 months to expiration)
For those willing to manage a position over a longer period, this strategy captures higher premiums and accommodates broader market movements.
Example:
- Expiration Date: Approximately 6-9 months from now.
- Short Put: OTM strike, ensuring greater safety margin.
- Long Put: Strike price around 7-8% lower.
Greeks Consideration: - Short puts delta () around 0.30, low assignment probability. - Lower theta () decay; the trade benefits from slower time decay. - Higher vega () sensitivity, higher premium collection.
Risk and Reward: - Maximum Profit: Higher collected premium. - Maximum Loss: Defined by the spread width minus net premium. - Probability of Assignment: Lower due to the OTM nature and time for market movements.
4. Long-Term Strategy (12 months to expiration)
This strategy is less susceptible to short-term market fluctuations but monitors economic and sector changes that may impact the ETF.
Example:
- Expiration Date: Approximately 12 months from now.
- Short Put: Further OTM.
- Long Put: Strike 10% lower than short put.
Greeks Consideration: - Short puts delta () around 0.20, minimal assignment risk. - Low theta () decay. - Higher vega () impact; can benefit more from volatility decreases.
Risk and Reward: - Maximum Profit: Higher premium collected due to time value. - Maximum Loss: Larger spread width, but offset by collected premium. - Probability of Assignment: Very low, significant price cushion.
5. Leap Options (18-24 months to expiration)
For investors with a long-term bullish outlook, leap options provide significant time for the trend to develop and capture premium over extended periods.
Example:
- Expiration Date: Approximately 18-24 months from now.
- Short Put: Deep OTM, ensuring substantial safety margin.
- Long Put: Deep OTM, 15% lower strike price.
Greeks Consideration: - Short puts delta () around 0.15, very low probability of assignment. - Minimal theta () impact. - High vega () sensitivity, benefiting from volatility decreases over time.
Risk and Reward: - Maximum Profit: Potentially highest premium due to the long term. - Maximum Loss: Spread minus net premium, controlled by large initial buffer. - Probability of Assignment: Extremely low, significant price buffer.
Summary
By analyzing various expiration dates and strike price combinations, we can craft a vertical bull put spread that aligns with our market outlook and risk tolerance.
- Near-term: Balances high premium collection with moderate assignment risk.
- Medium-term: Offers a balanced approach with moderate Greeks impact.
- Longer-term: Minimizes assignment risk while capturing moderate premiums.
- Long-term: Provides significant buffer and risk management over extended horizons.
- Leaps: Offers the highest premium potential with very low assignment risk.
Vertical Bear Call Spread Option Strategy
Sure, let's examine the optimal bear call spread defined by maximum profitability while minimizing the risk of assignment. First, let's clarify our understanding of some key concepts:
- Vertical Bear Call Spread Strategy: This involves selling a call at a lower strike price and buying a call at a higher strike price. This strategy is bearish and expects the stock price to fall or remain relatively stable.
- Greeks: They are metrics representing various sensitivities of the option's price. For this analysis, Delta will help understand directional risks, Theta for time decay, and Vega for volatility sensitivity.
- In The Money (ITM): Selling ITM call options can increase risk due to higher chances of the options being exercised.
Strategy Analysis:
1. Near-Term Expiration (e.g., 1 Month Out):
- Short Call: Strike at 102% above current stock price.
- Delta: Slightly above zero, indicating slightly higher directional risk as the stock could be close to the current price, implying a fair assignment risk.
- Theta: High theta will help in this near-term expiry as the options decay faster, leading to faster profits.
- Long Call: Strike at 105% above the current stock price.
- Delta: Close to zero, showing little risk of price moving into profitable territory for the buyer.
- Risk/Reward: Premium received from the short call is high due to proximity to current price. However, as we are buying an OTM long call, the premium paid is lower, making this strategy quite profitable. The risk is moderate due to the proximity of strike prices to the stock price.
2. Medium-Term Expiration (e.g., 3 Months Out):
- Short Call: Strike at 104% above current stock price.
- Delta: Low, indicating limited directional risk.
- Theta: Moderate; time decay is not as rapid.
- Long Call: Strike at 108% above the current stock price.
- Delta: Close to zero.
- Risk/Reward: This gives a balanced medium-term outlook. The longer expiry can capture a steady decline or stagnation, making it profitable. Risk is low due to both strikes being out of the money.
3. Moderate Term Expiration (e.g., 6 Months Out):
- Short Call: Strike at 106% above current stock price.
- Delta: Very low, capturing limited directional risk.
- Theta: Lower, reflecting slower time decay.
- Long Call: Strike at 110% above the stock price.
- Delta: Practically zero.
- Risk/Reward: Captures the slow, steady fall or stagnation in stock price. Long-term exposure increases assignment risks mildly, but the spread between buying and selling is generally profitable.
4. Long-Term Expiration (e.g., 9 Months Out):
- Short Call: Strike at 108% above current stock price.
- Delta: Extremely low, reflecting almost negligible directional risk.
- Theta: Quite low, as time decay will be very slow with longer-term options.
- Long Call: Strike at 112% above the stock price.
- Delta: Essentially zero.
- Risk/Reward: Low risk due to ample strike distance from current prices. Premium from the short call added to the long call makes this a strong bear spread. However, patience is required for profitability.
5. Very Long-Term Expiration (e.g., 12 Months Out):
- Short Call: Strike at 110% above current stock price.
- Delta: Almost negligible, ensuring minimal risk of direction.
- Theta: Very low.
- Long Call: Strike at 115% above the stock price.
- Delta: Almost zero.
- Risk/Reward: This strategy leans towards very low risk but requires the longest time horizon for realization. However, it safely ensures almost zero risk from assignment due to far-dated strikes.
Conclusion:
When selecting the most profitable vertical bear call spread, balancing the Greeks' impact is essential while ensuring minimal risk from assignments. Near-term strategies offer higher premium gains but more assignment risk, whereas long-term strategies provide safety nets with steady but slower profits. The key is identifying a suitable fit for one's risk tolerance and market outlook.
(Key Disclaimer: The above examples are theoretical analyses and must be backed by real-time data for practical deployment. Continuous market monitoring, scenario analysis, and expert advisories are crucial.)
Vertical Bull Call Spread Option Strategy
A vertical bull call spread is an options trading strategy designed to capitalize on a moderate rise in the price of the underlying asset, while also managing risk. This strategy involves buying a call option at a lower strike price and selling a call option at a higher strike price, both with the same expiration date. The goal is to benefit from a price increase up to the higher strike price, capturing the spread between the two strikes, while limiting the maximum loss to the net premium paid.
Given the iShares MSCI Israel ETF (EIS) and a target stock price that is 2% over or under the current price, we can analyze the potential profitability of various vertical bull call spreads using their specific Greeks values, expiration dates, and strike prices. Our objective is to identify the most profitable options while minimizing the risk of assignment.
Near-Term Option (1 Month Out)
- Expiration Date: 1 month from today
- Strike Prices: $45 (long call) and $50 (short call)
- Greeks Analysis:
- The delta for the long call option at $45 is higher (around 0.65), indicating a greater probability of ending in-the-money.
- The delta for the short call option at $50 is lower (around 0.40), indicating a moderate chance of ending in-the-money.
- The theta for the long call option is relatively high, which means that time decay will erode its value more quickly as we approach expiration.
Risk and Reward: - Maximum Risk: The net premium paid (the difference between the premiums of the long and short calls). - Maximum Reward: The difference between the strike prices minus the net premium paid. - Assignment Risk: Moderate, as the long call is in-the-money and the short call is near the money. There is a chance of assignment if the price nears $50. - Potential Scenario: If the stock price rises to $50, the strategy yields the maximum profit. If it remains around $45, the near-term option erodes rapidly due to time decay.
Medium-Term Option (3 Months Out)
- Expiration Date: 3 months from today
- Strike Prices: $47 (long call) and $52 (short call)
- Greeks Analysis:
- The delta for the long call option at $47 is around 0.55, suggesting a solid probability of ending in-the-money.
- The delta for the short call option at $52 is lower (around 0.35), suggesting it may remain out-of-the-money.
- The theta for both options is less harsh compared to near-term options, indicating more stable time decay over the period.
Risk and Reward: - Maximum Risk: The net premium paid, which might be slightly more than shorter-term options due to longer duration. - Maximum Reward: The spread between the strike prices minus the net premium paid. - Assignment Risk: Lower compared to the near-term as the long call is closer to the money and the short call is further out-of-the-money. - Potential Scenario: If the stock price climbs to $52, you achieve maximum profit. If it stagnates or falls moderately below $47, potential losses are limited to the net premium.
Medium to Long-Term Option (6 Months Out)
- Expiration Date: 6 months from today
- Strike Prices: $48 (long call) and $54 (short call)
- Greeks Analysis:
- The delta for the long call option at $48 sits around 0.50, providing a balanced probability.
- The delta for the short call option at $54 is fairly low (about 0.30), reducing the risk of assignment.
- The theta is less aggressive, allowing time for the forecasted price movement.
Risk and Reward: - Maximum Risk: A higher net premium due to the longer tenure. - Maximum Reward: The strike price differential minus the net premium paid. - Assignment Risk: Low, considering the advantageous spread between strike prices. - Potential Scenario: A stock price increase to $54 brings maximum profit. Moderate decreases could yield manageable losses.
Long-Term Option (9 Months Out)
- Expiration Date: 9 months from today
- Strike Prices: $50 (long call) and $55 (short call)
- Greeks Analysis:
- The delta for the long call option at $50 is around 0.45, showing reasonable upside potential.
- The delta for the short call option at $55 is significantly low (around 0.25), suggesting minor assignment risk.
- Theta is lower, mitigating time decay impact over this duration.
Risk and Reward: - Maximum Risk: A higher upfront cost due to a longer timeframe. - Maximum Reward: Profit potential if the stock rises to $55, minus the net premium paid. - Assignment Risk: Very low; only relevant if the stock price significantly rises. - Potential Scenario: A consistent rise to $55 yields optimal profit, while limited downside mitigates substantial losses.
Extended Long-Term Option (1 Year Out)
- Expiration Date: 1 year from today
- Strike Prices: $52 (long call) and $58 (short call)
- Greeks Analysis:
- The delta for the long call option at $52 is around 0.40, reflecting conservative but plausible appreciation.
- The delta for the short call at $58 is quite low (around 0.20), minimizing assignment risk.
- The theta is minimal, as time decay is slower for long-term options.
Risk and Reward: - Maximum Risk: The highest premiums paid but spread across the duration. - Maximum Reward: High potential if the stock price climbs up to $58, void of significant intermediary decay. - Assignment Risk: Negligible, given the out-of-the-money characteristics. - Potential Scenario: Stock appreciation to $58 captures full profitability; slight drops hedge primary investment.
In conclusion, each vertical bull call spread strategy comes with its unique risk-reward profile. By using near-term to extended long-term options and considering the Greeks, traders can exploit their preferred balance of risk and profit, seeking to leverage the ETF's anticipated movement within a 2% range. The medium-term options offer a balanced approach for moderate profit with manageable assignment risks, while longer-term strategies cushion time decay and extend profit potential.
Spread Option Strategy
Analyzing and determining the most profitable calendar spread options strategy requires a deep dive into the call and put options available for the iShares MSCI Israel ETF (EIS), considering both the Greeks and the target stock price movement. The ultimate goal is to construct a strategy that maximizes profit while minimizing risk, particularly the risk of assignment due to in-the-money puts.
Given the target price forecast of 2% variance from the current stock price, a calendar spread will involve buying a longer expiration call option and selling a nearer expiration put option. Lets discuss five different choices based on expiration dates and strike prices.
Choice 1: Short-Term Strategy
- Buy Call Option: Expiration date: (Long-term, e.g., 6 months out), Strike Price: At-the-money (ATM)
- Greek Analysis: Delta close to 0.5, high Vega, and low Theta.
- Risk: Premium paid could decay over time, especially if volatility decreases.
-
Reward: High potential for gains if stock moves upwards within the anticipated range.
-
Sell Put Option: Expiration date: (Near-term, 1 month out), Strike Price: 2% below current stock price
- Greek Analysis: Delta around -0.3 to -0.4 (moderate in-the-money risk), Theta decay favourable, minimal Vega impact.
- Risk: Assignment risk if the stock price dips significantly close to expiration.
- Reward: Collection of premium with the expectation of it expiring worthless if the stock price remains above the strike.
Profit/Loss: Profitable if EIS stays above the short put strike and rises toward the long call strike. Loss if stock declines significantly, mainly due to high Theta decay on the long call.
Choice 2: Intermediate-Term Strategy
- Buy Call Option: Expiration date: (Medium-term, 3 months out), Strike Price: Slightly out-of-the-money (OTM), 2% above current price
- Greek Analysis: Lower Delta (~0.4), moderate Vega, higher Theta decay.
- Risk: Higher risk from premium decay without stock price increase.
-
Reward: Increased leverage if the stock price rises as expected, potentially higher percentage gains.
-
Sell Put Option: Expiration date: (1 month out), Strike Price: 2% below current stock price.
- Greek Analysis: Lower Delta (~-0.3), favourable Theta decay.
- Risk: Moderate assignment risk if stock declines.
- Reward: Premium collection, lower chance of assignment due to short duration.
Profit/Loss: Profitable if EIS appreciates moderately. Higher leverage means better returns if the stock moves in the predicted range.
Choice 3: Tactical Spread Strategy
- Buy Call Option: Expiration date: (Long-term, 1 year out), Strike Price: At-the-money (ATM)
- Greek Analysis: Delta around 0.5, high Vega sensitivity, low Theta.
- Risk: Long holding period exposes to market volatility risk.
-
Reward: Significant profit potential with the gradual stock price increase.
-
Sell Put Option: Expiration date: (2 months out), Strike Price: 2% below current stock price.
- Greek Analysis: Moderate Delta, negligible Vega, favourable Theta decay.
- Risk: Moderate assignment risk, manageable within 2% dip.
- Reward: Premium income with a lower probability of stock price breaching the strike.
Profit/Loss: Maximized if EIS appreciates steadily. Moderate to high gains with low risk of put assignment if the market moves as anticipated.
Choice 4: Conservative Approach
- Buy Call Option: Expiration date: (6 months out), Strike Price: Slightly in-the-money (ITM), 1% above current price
- Greek Analysis: Higher Delta (~0.6), manageable Vega, slightly higher Theta.
- Risk: Premium loss if stock remains stagnant.
-
Reward: Higher intrinsic value, less susceptible to Theta decay.
-
Sell Put Option: Expiration date: (1 month out), Strike Price: At-the-money (ATM)
- Greek Analysis: Higher Delta (~-0.5), significant Theta decay.
- Risk: Higher assignment risk due to ATM positioning.
- Reward: Higher premium with a higher likelihood of expiration worthless if stock slightly rises.
Profit/Loss: Reduced risk of put assignment if stock maintains current level or slightly appreciates. Gains are steady with conservative positioning.
Choice 5: Aggressive Spread
- Buy Call Option: Expiration date: (1 year out), Strike Price: Deep out-of-the-money (OTM), 5% above current price
- Greek Analysis: Low Delta (~0.2), significant Vega, high Theta decay.
- Risk: High potential for complete premium loss if stock does not appreciate significantly.
-
Reward: Substantial gains if stock rallies strongly, leveraged position.
-
Sell Put Option: Expiration date: (1 month out), Strike Price: At-the-money (ATM)
- Greek Analysis: Moderate Delta, favourable Theta, minimal Vega.
- Risk: Higher risk of assignment if stock price drops.
- Reward: High premium capture if stock holds or rises.
Profit/Loss: High risk-reward profile, profitable if EIS rallies considerably. Losses are likely if the stock remains flat or declines, especially in a volatile environment.
Conclusion
In creating a calendar spread with the iShares MSCI Israel ETF (EIS), the chosen options should balance premium collection from the short put with the appreciation potential from the long call while limiting assignment risk. The tactical spread strategy (Choice 3) offers balanced exposure. However, specific market outlooks, risk appetites, and timing considerations may favor more aggressive or conservative approaches among the choices outlined. Each strategy aims for profitability within the target stock price range while considering Greek influences and minimizing short-term assignment risks.
Calendar Spread Option Strategy #1
To effectively participate in a calendar spread options strategy with a focus on minimizing the risk of assignment and optimizing profitability, we need to analyze options based on their respective expiration dates, strike prices, and the Greeks, including Delta, Gamma, Theta, Vega, and Rho. Our objective is to buy a put option at one expiration date while selling a call option at another, with the goal of profiting from time decay and potential changes in volatility.
Choice 1: Near-Term Expiration
Long Put Option: - Expiration: 1 month from today - Strike Price: At-the-money (ATM) - Greeks: - Delta: -0.50 - Theta: -0.20 - Vega: 0.30
Short Call Option: - Expiration: 3 months from today - Strike Price: Slightly out-of-the-money (OTM) - Greeks: - Delta: 0.30 - Theta: -0.01 - Vega: 0.25
Analysis: This strategy aims to take advantage of time decay and volatility without significant price movement. The low Delta for the call option reduces the risk of assignment. The positive Theta from the short call option will help offset the negative Theta from the long put option, aiming to result in a net positive Theta over time. The higher Vega in a short call can be beneficial in a volatile market, potentially leading to higher premiums collected.
Choice 2: Short-Term Expiration
Long Put Option: - Expiration: 2 months from today - Strike Price: Slightly in-the-money (ITM) - Greeks: - Delta: -0.60 - Theta: -0.15 - Vega: 0.35
Short Call Option: - Expiration: 4 months from today - Strike Price: At-the-money (ATM) - Greeks: - Delta: 0.50 - Theta: -0.02 - Vega: 0.30
Analysis: Holding an ITM put option provides greater intrinsic value, thus lower risk relative to market price shifts. The ATM call option, having higher Delta, exposes to higher risk of assignment. However, its negative Theta works well over longer periods and the strategy benefits from increased volatility. This mix can leverage both time decay and volatility skew, aiming for improved profits with moderate assignment risk.
Choice 3: Mid-Term Expiration
Long Put Option: - Expiration: 4 months from today - Strike Price: At-the-money (ATM) - Greeks: - Delta: -0.50 - Theta: -0.10 - Vega: 0.40
Short Call Option: - Expiration: 6 months from today - Strike Price: Slightly out-of-the-money (OTM) - Greeks: - Delta: 0.30 - Theta: -0.005 - Vega: 0.35
Analysis: The focus is on increasing Vega to take advantage of changes in the market's implied volatility. The short call's Theta is minimal, hence relatively stable over time. This balance creates a compelling opportunity if you anticipate moderate volatility while pursuing capital preservation. The modest risk of assignment, due to a lower Delta call option, supports a conservative outlook.
Choice 4: Long-Term Expiration
Long Put Option: - Expiration: 6 months from today - Strike Price: Slightly in-the-money (ITM) - Greeks: - Delta: -0.55 - Theta: -0.08 - Vega: 0.35
Short Call Option: - Expiration: 12 months from today - Strike Price: At-the-money (ATM) - Greeks: - Delta: 0.50 - Theta: -0.01 - Vega: 0.40
Analysis: This long-term strategy leverages the put option's intrinsic value at a low price. The ATM call option carries a significant risk of assignment due to its Delta. However, given the extended timeframe, this strategy allows ample exposure to capture value from time decay. The relatively high Vega for both options increases the spread's overall sensitivity to volatility, offering robust growth depending on market movements.
Choice 5: Extended-Term Expiration
Long Put Option: - Expiration: 12 months from today - Strike Price: At-the-money (ATM) - Greeks: - Delta: -0.50 - Theta: -0.05 - Vega: 0.45
Short Call Option: - Expiration: 18 months from today - Strike Price: Slightly out-of-the-money (OTM) - Greeks: - Delta: 0.25 - Theta: -0.002 - Vega: 0.50
Analysis: This strategy involves a low-risk ITM long put option for a year coupled with an 18-month OTM call option, aiming for a low assignment probability. The aggregated Vega effect stipulates sensitivity to implied volatility changes while taking advantage of time decay to minimize losses. This mix positions the strategy to capture potential upside with limited downside, making it suitable for those considering a long-term approach while maintaining low assignment risk.
In all scenarios, the choice of strikes and expiration dates is designed to cater to time decay benefits, volatility considerations, and minimizing the likelihood of assignment. Balancing these factors ensures a targeted, profitable approach to calendar spreads.
Calendar Spread Option Strategy #2
When designing a calendar spread options strategy for iShares MSCI Israel ETF (EIS), its crucial to select the right combination of expiration dates and strike prices to optimize profitability while minimizing risk. Since the goal is to sell a put option and buy a call option at different expiration dates, we want to focus on both short-term and long-term strategies, preserving capital and minimizing the risk of having shares assigned. Let's dive into five strategic choices based on expiration dates and strike prices.
Choice 1: Near-Term Strategy
- Short Put Option: Sell a put option with an expiration date that is one month out.
- Long Call Option: Buy a call option with an expiration date three months out.
For instance, if the current price of EIS is $50: - Sell Put Option: Sell a 1-month 49-strike put with a delta of -0.3. - Buy Call Option: Buy a 3-month 51-strike call with a delta of 0.4.
Risk and Reward Analysis: - Risk: The near-term put is slightly in-the-money, risking assignment if the underlying stock drops below $49 at expiration. Given the delta of -0.3, the likelihood of assignment is around 30%, which is moderate. - Reward: The longer-term call option provides upside potential if the stock price increases, aligned with our target of 2% either above or below the current price. This setup benefits from time decay on the short put while maintaining long exposure through the call option.
Choice 2: Medium-Term Strategy
- Short Put Option: Sell a put option two months out.
- Long Call Option: Buy a call option six months out.
Using the same $50 current price: - Sell Put Option: Sell a 2-month 48-strike put with a delta of -0.25. - Buy Call Option: Buy a 6-month 52-strike call with a delta of 0.45.
Risk and Reward Analysis: - Risk: With a slightly lower delta, the probability of assignment is decreased, reducing risk. The strike price is further out-of-the-money, making assignment less likely. - Reward: The six-month call benefits from any upward movement over a more extended period, with significant theta decay in our favor on the two-month put.
Choice 3: Long-Term Strategy
- Short Put Option: Sell a put option three months out.
- Long Call Option: Buy a call option one year out.
Remaining with the $50 baseline: - Sell Put Option: Sell a 3-month 47-strike put with a delta of -0.20. - Buy Call Option: Buy a 12-month 53-strike call with a delta of 0.5.
Risk and Reward Analysis: - Risk: The put option is well out-of-the-money, reducing the risk of assignment significantly. The low delta of -0.20 further minimizes this risk. - Reward: The long-term call option benefits from prolonged bullish trends, offering greater leverage on capital appreciation.
Choice 4: Ultra Long-Term Strategy
- Short Put Option: Sell a put option six months out.
- Long Call Option: Buy a call option eighteen months out.
Assuming the $50 price: - Sell Put Option: Sell a 6-month 46-strike put with a delta of -0.15. - Buy Call Option: Buy an 18-month 54-strike call with a delta of 0.55.
Risk and Reward Analysis: - Risk: The extensive time horizon reduces the immediacy of assignment risk, and the low delta of the put ensures it's even less likely. - Reward: This approach aims for significant gains from long-term bullish movements on the ETF, ideal for investors with extended horizons.
Choice 5: Balanced Strategy
- Short Put Option: Sell a put option one month out.
- Long Call Option: Buy a call option nine months out.
For a balanced view: - Sell Put Option: Sell a 1-month 47-strike put with a delta of -0.22. - Buy Call Option: Buy a 9-month 52-strike call with a delta of 0.48.
Risk and Reward Analysis: - Risk: This strategy balances the assignment risk with moderate out-of-the-money puts and a manageable delta. - Reward: The 9-month call option allows capture of intermediate-term growth, benefiting from stock price stability and upside within the period.
In all scenarios, the intention is to capitalize on time decay of short puts while maintaining an optimistic outlook through long calls. Depending on market expectations and risk tolerance, these strategies allow both short-term speculation and long-term investment opportunities. Subsequently, the choice of expiration and strike should align with the investor's view on EIS's price movement and market conditions.
Similar Companies in Asset Management:
iShares MSCI Thailand ETF (THD), iShares MSCI Ireland ETF (EIRL), iShares MSCI Netherlands ETF (EWN), iShares MSCI New Zealand ETF (ENZL), iShares MSCI Chile ETF (ECH), VanEck Vectors Israel ETF (ISRA), First Trust NASDAQ Clean Edge Green Energy Index Fund (QCLN), Invesco Solar ETF (TAN), Global X MSCI SuperDividend ETF (SDIV), iShares MSCI Frontier 100 ETF (FM), SPDR S&P Emerging Markets Dividend ETF (EDIV)
https://seekingalpha.com/article/4704157-eis-a-strong-israel-fund
Copyright © 2024 Tiny Computers (email@tinycomputers.io)
Report ID: EshrxK
Cost: $0.20720
https://reports.tinycomputers.io/EIS/EIS-2024-07-24.html Home