e.l.f. Beauty, Inc. (ticker: ELF)
2024-01-17
 e.l.f. Beauty, Inc. (ticker: ELF), is a prominent American cosmetics brand known for its high-quality beauty products offered at accessible price points. Established in 2004, the company has built a strong following by marketing primarily to younger consumers through digital and social media channels. e.l.f. stands for "eyes, lips, face," reflecting its extensive product range that includes makeup, skincare, and beauty tools. The brand is particularly noted for its commitment to being cruelty-free and vegan. e.l.f. Beauty, Inc. positions itself in the market by combining affordable prices with innovative products that often follow the latest beauty trends. The company's direct-to-consumer approach, supplemented by its presence in major retailers, allows it to maintain a robust connection with its customer base while expanding its reach. As of the last report, e.l.f. continues to demonstrate growth and resilience in the dynamic and competitive cosmetics industry.

| Full Time Employees | 339 | Previous Close | 163.93 | Beta | 1.457 |
| Trailing PE | 76.57277 | Forward PE | 52.954548 | Volume | 881,234 |
| Average Volume 10 Days | 1,131,390 | Market Cap | 9,002,989,568 | Fifty Two Week Low | 52.56 |
| Fifty Two Week High | 164.71 | Price to Sales TTM | 11.75724 | Enterprise Value | 8,962,739,200 |
| Profit Margins | 0.1588 | Shares Outstanding | 55,199,200 | Shares Short | 3,242,530 |
| Held Percent Insiders | 0.04507 | Held Percent Institutions | 0.98772 | Short Ratio | 2.9 |
| Book Value | 9.455 | Price to Book | 17.250134 | Net Income to Common | 121,599,000 |
| Trailing EPS | 2.13 | Forward EPS | 3.08 | Peg Ratio | 2.14 |
| Enterprise to Revenue | 11.705 | Enterprise to EBITDA | 59.613 | 52 Week Change | 2.056115 |
| Current Price | 163.1 | Total Cash | 167,763,008 | Total Debt | 81,694,000 |
| Quick Ratio | 1.67 | Current Ratio | 2.858 | Total Revenue | 765,740,032 |
| Debt to Equity | 15.819 | Revenue Per Share | 14.296 | Return on Assets | 0.12814 |
| Return on Equity | 0.27844998 | Free Cash Flow | 110,889,376 | Operating Cash Flow | 110,107,000 |
| Earnings Growth | 1.762 | Revenue Growth | 0.761 | Gross Margins | 0.69578004 |
| EBITDA Margins | 0.19634001 | Operating Margins | 0.18643999 | Currency | USD |
 Technical Analysis Perspective:
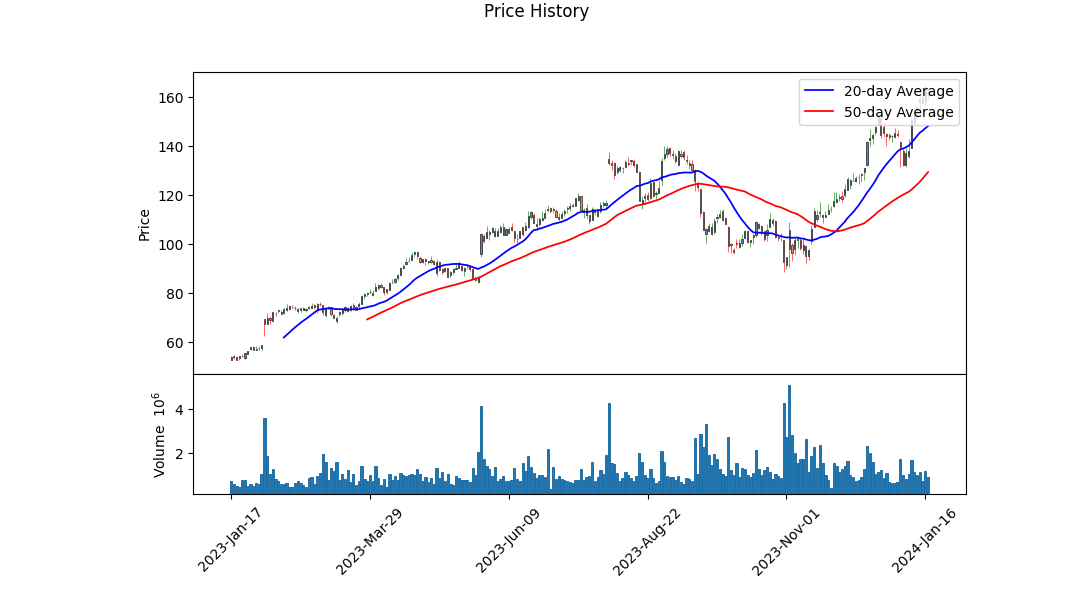
- The recent price movements indicate a growing upward momentum. The Parabolic SAR (PSAR), an indicator often used to determine the direction of a stock's momentum, is showing a bullish trend with the values beneath the price, suggesting it may continue to rise.
- On-Balance Volume (OBV) has seen an increase, aligning with the rising price, which typically reflects positive volume pressure that could drive prices higher.
- The Moving Average Convergence Divergence (MACD) histogram is increasing, indicating that the bullish momentum is growing stronger.
Fundamental Analysis Perspective:
- The company's fundamental data, including financials and cash flow, indicate that the company is in good health, with increasing net income and a strong free cash flow.
- The balance sheet shows a healthy level of working capital and tangible book value which suggests a good liquidity position and financial resilience.
- Analyst expectations for both earnings and revenue growth are optimistic, suggesting a favorable outlook which could influence the stock positively.
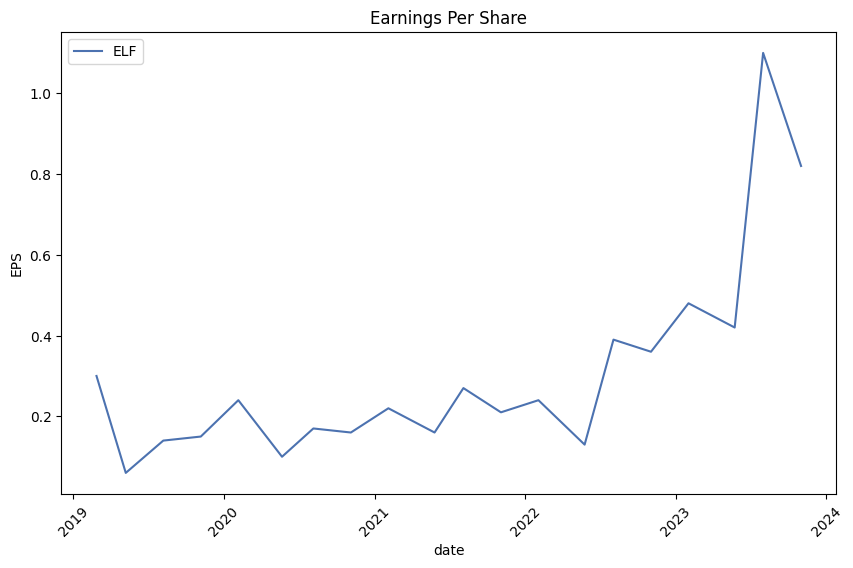
- The EPS trend is upward, and there have been revisions and surprise percentages that indicate better-than-expected performance.
Balance Sheet Perspective:
- The company has a tangible book value that has increased significantly, which is a positive sign for equity holders.
- The increase in total equity suggests that the company is generating value for its shareholders.
- Debt levels appear to have shifted over the recent years, but without concerning signals as the debt management seems to be under control, especially given the strong net income figures.
Considering the data and the analyst expectations, the next few months could see a continued upward trend in the stock price. Earnings and revenue growth estimates point towards a favorable financial performance. Given the company's increasing net income, strong fundamental position, and positive technical indicators, investor sentiment is likely to remain positive unless unexpected events alter market conditions or company-specific news changes the current trajectory.
It's important to remember that the stock market is influenced by a variety of factors including market sentiment, emerging industry trends, and broader economic conditions, which can have an unpredictable impact on stock price movements. However, the combination of positive technical indicators, strong fundamentals, and encouraging analyst expectations generally results in a bullish outlook for the stock in question over the short to medium term. Investors and stakeholders should monitor the ongoing financial performance and market conditions for any signs of change that could influence the company's future stock performance.
| R-squared | 0.209 |
| Adj. R-squared | 0.209 |
| F-statistic | 331.9 |
| Prob (F-statistic) | 5.63e-66 |
| Log-Likelihood | -3,085.6 |
| AIC | 6,175 |
| BIC | 6,186 |
| No. Observations | 1,256 |
| Df Residuals | 1,254 |
| Const Coef. | 0.2204 |
| SPY Coef. | 1.1026 |
| Std. Err. of Const | 0.080 |
| Std. Err. of SPY | 0.061 |
| t-value of Const | 2.762 |
| t-value of SPY | 18.218 |
| P>|t| of Const | 0.006 |
| P>|t| of SPY | 0.000 |
| [0.025 of Const] | 0.064 |
| [0.975 of Const] | 0.377 |
| [0.025 of SPY] | 0.984 |
| [0.975 of SPY] | 1.221 |
In a linear regression model analyzing the relationship between ELF (the dependent variable y) and SPY (the stock ticker for an exchange-traded fund representing the S&P 500, used as the independent variable in this regression), alpha represents the intercept of the regression line, essentially the expected value of ELF when SPY is zero. The calculated alpha, also referred to as the constant term, is approximately 0.2204, which indicates that if SPY were zero, ELF would be expected to have a baseline value of around 0.2204, barring any other external influences. This alpha value is considered statistically significant with a t-value of 2.762 and a P-value (P>|t| for the constant) of 0.006, suggesting that the existence of an intercept is backed by the data.
Beta, measuring the expected change in ELF for a one-unit increase in SPY, is approximately 1.1026. The R-squared of the model is 0.209, indicating that around 20.9% of the variance in ELF is explained by SPY. The beta coefficient is also statistically significant with a t-value of 18.218 and a very low P-value. This conveys a positive relationship between ELF and SPY, meaning that as the S&P 500 index increases or decreases, the value of ELF is likely to move in the same direction, with more than a one-to-one correspondence since the beta is greater than one. Given the observed significance and relationship, investors might view ELF as being somewhat responsive to market movements as per this model.
Executive Summary of e.l.f. Beauty, Inc. Earnings Call for Second Quarter Fiscal Year 2024
Introduction and Highlights: Kristina Katten initiated the e.l.f. Beauty earnings call, with Tarang Amin, Chairman and CEO, and Mandy Fields, CFO, presenting. The company delivered remarkable Q2 results, marking its 19th consecutive quarter of net sales growth a feat achieved by only 5 out of 274 public consumer companies. The company grew net sales by 76%, gross margin by 570 basis points, and adjusted EBITDA by 122% year-over-year.
Business Performance and Growth Outlook: Tarang Amin highlighted e.l.f. Beauty's momentum, noting that the company substantially outperformed in color cosmetics, skin care, and international markets. e.l.f. Cosmetics grew 51% in tracked channels and increased market share by 330 basis points, doubling its market share since 2019. e.l.f. SKINs growth was remarkable as well, growing 129% and becoming the fastest-growing brand among the top 20 skin care brands. The brand holds a significant runway for growth internationally, with a 157% increase in net sales, particularly strong in Canada and the U.K. Due to this success, e.l.f. has updated its progress and raised its outlook for the fiscal year '24.
Strategic Imperatives and Marketing Success: Amin detailed the company's five strategic imperatives, such as building brand demand, powering digital, leading innovation, driving productivity, and delivering profitable growth. e.l.f. continues to experience success due to its disruptive marketing strategies, embracing gaming and entertainment content collaborations. Marketing investments have been increased from 7% to 22% of net sales, resulting in significant return on investment. The company also emphasized its commitment to sustainability and was recognized by Newsweek as one of America's greenest companies.
Financial Highlights and Naturium Acquisition: Mandy Fields shared the financial highlights of Q2, elaborating on the strong growth, margin expansion, and leveraged spending in non-marketing SG&A expenses. The balance sheet remains strong, and the acquisition of Nutrium, a skin care brand, has now doubled e.l.f.s skin care presence. Looking forward to the second half of fiscal '24, the company expects to continue driving strong net sales growth and profitability.
Discussion and Questions: During the Q&A session, executives responded to inquiries about sales guidance, margins, international and product expansion, Naturium integration, and marketing investments. The focus remained on the positive trends in the underlying business, the momentum behind the brand, and e.l.f.'s strategic actions to maintain growth across various market segments.
Conclusion:
The call concluded with Tarang Amin reaffirming the company's strong performance in the first half of fiscal '24 and the expectations for continued success in the future, driven by strategic investment and growth initiatives.

E.l.f. Beauty, Inc. has become a company to watch in the ever-evolving cosmetics industry, demonstrating resilience and strategic prowess amid widespread industry challenges and intense competition. The company has been navigating a complex market landscape, which, according to Zacks.com's December 5, 2023 report, is fraught with inflationary pressures, supply chain difficulties, and a volatile currency environment. Notably, the Zacks Cosmetics Industry Rank places the sector in the bottom 24% of over 250 industries, reflecting a negative earnings outlook.
Despite the industry's headwinds and reduced consumer discretionary spending, e.l.f. Beauty has distinguished itself by expanding its digital capabilities, focusing on innovative products aligned with the 'clean beauty' movement, and successfully reaching new market segments with targeted online marketing strategies. The company's focus on digital innovation positions it as a forward-thinking player in the sector, preparing to capitalize on the emerging trends and consumption patterns of a more technologically adept consumer base.
e.l.f. Beauty's strategic direction is underscored by its robust performance in terms of efficiency ratios, outpacing industry averages, which is a testament to the company's operational excellence and adept management. These bullish signs have granted e.l.f. Beauty a Zacks Rank #1 (Strong Buy) with a significant average four-quarter positive earnings surprise of 90.1%.
The firm's emphasis on serving the interests and preferences of consumers, particularly in the direct-to-consumer segment, has paid dividends. Bright forecasts for revenue and earnings growth suggest an optimistic outlook for the fiscal year ending March 2024. e.l.f. Beauty has embraced a multi-brand strategy that includes e.l.f. Cosmetics, e.l.f. Skin, Well People, and Keys Soulcareeach playing a role in broadening the company's consumer appeal.
Recent financial results as of fiscal Q2 revealed that e.l.f. Beautys sales and adjusted EBITDA significantly outperformed analysts' forecasts, largely driven by the success of its skincare segment and its growing market share in the color cosmetics realm. Underpinning these results is a marketing approach that leverages social media and influencer endorsements, bypassing traditional advertising avenues in favor of more modern, cost-effective digital strategies.
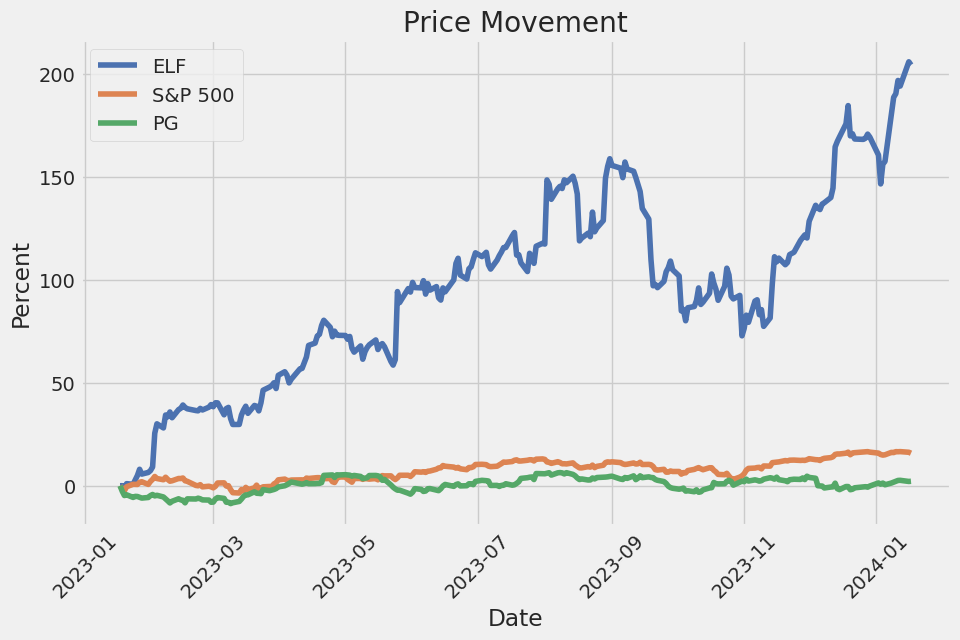
The company's stock performance has been drawing investor attention, outpacing the S&P 500, with e.l.f. Beauty shares experiencing positive movements in the trading sessions around December 2023 and January 2024. These sessions have seen varying degrees of growth, sometimes surpassing and at other times underperforming market gains. Despite fluctuations in daily performance, the overarching trend for e.l.f. Beauty shares has been one of considerable growth over the past month, cementing its position as a strong competitor within the cosmetics industry.
Analysts and market observers indicate that e.l.f. Beauty is likely to continue its streak of surpassing earnings estimates, given the company's history of positive earnings surprises over the past two quarters. This sign of consistency bolsters investor confidence and suggests that e.l.f. Beauty's business model is yielding tangible results.
Looking at a broader perspective, e.l.f. Beauty's engagement with younger customers, particularly via social media platforms like TikTok, has positioned the company favorably among Gen Z and millennialsa demographic increasingly influential in setting industry trends. This strategy, alongside strategic retail partnerships and effective use of influencer marketing, has facilitated the company's outstanding revenue growth and market share expansion.
Given the healthy outlook and the potential for sustained growth and market share gains, e.l.f. Beauty has been depicted by various analysts as both a growth stock worth incorporating into investment portfolios and a possible disruptor in the cosmetics market. The brand has enjoyed a 162% stock price increase over the last year and has been cited as embodying the potential for Netflix-like market redefinition in its sector.
To stay attuned to e.l.f. Beautys ongoing progress and market performance, investors are encouraged to consult resources such as Zacks.com, as well as pay attention to the companys upcoming earnings reports and potential impact on stock price.
In summary, e.l.f. Beauty has positioned itself as a significant player in the cosmetics industry, managing to defy the sector's broader challenges through a combination of operational efficiency, a strong digital approach, innovative product offerings, and an astute understanding of consumer behavior. The company's market performance and analysts' optimistic projections illuminate a path of continued growth and market penetration.
The volatility of e.l.f. Beauty, Inc. (ELF) can be summarized as follows: The ARCH model, which is used to estimate how volatile the stock returns are, indicates that ELF's returns do not follow a clear pattern or trend over time since the R-squared value is virtually zero. The volatility, as suggested by the omega value, is relatively high, which points to a larger variance in the investment returns. Furthermore, the alpha[1] value indicates that past shocks or movements in the stock's price have a statistically significant effect on future volatility, though the impact is moderate.
Key features of the volatility based on the model results include: - ELF's stock price movements are quite unpredictable. - The returns exhibit a level of volatility that could be considered higher than average. - Past price fluctuations tend to influence future unpredictability to a certain extent.
Below is the requested HTML table displaying the statistics:
| Statistic Name | Statistic Value |
|---|---|
| R-squared | 0.000 |
| Adj. R-squared | 0.001 |
| Log-Likelihood | -3,225.10 |
| AIC | 6,454.19 |
| BIC | 6,464.46 |
| No. Observations | 1,255 |
| omega | 9.0944 |
| alpha[1] | 0.1139 |
To analyze the financial risk of a $10,000 investment in e.l.f. Beauty, Inc. (ELF) over a one-year period, a combination of volatility modeling and machine learning predictions is deployed. This analytical approach accentuates the multifaceted nature of stock investment risk, involving both the unpredictability of stock price fluctuations and the challenge of forecasting future returns.
Volatility modeling is integral to understanding the nature of e.l.f. Beauty, Inc.'s stock price movements. It is specifically designed to capture the time-varying volatility inherent in financial time series data. By fitting this model to the historical return data of ELF, we extract a measure of the stock's volatility over time, which is crucial for risk assessment. This method allows us to quantify the expected range of variation in ELF's stock price.
On the other hand, machine learning predictions employ ensemble techniques to forecast future stock returns based on historical data. By analyzing patterns within the historical price data, the ensemble algorithm makes forward-looking predictions, helping investors gauge potential future stock performance. It's not intended to precisely forecast stock prices; rather, it provides a probabilistic assessment of what returns might look like going forward, which when combined with the volatility model, results in a more robust risk assessment framework.
When conducting risk analysis, particularly with volatile securities like individual stocks, the Value at Risk (VaR) metric is often employed to encapsulate the potential loss in value of a risk asset or portfolio over a defined period for a given confidence interval. For our $10,000 investment in ELF, the volatility modeling provides the standard deviation of the stock returns and the machine learning predictions contribute to recognizing the expected return. With these inputs, the VaR calculation for a 95% confidence interval can be performed.
The calculated VaR for the investment at this confidence level amounts to $496.28. This implies that, with 95% confidence, the maximum expected loss over a one-year horizon should not exceed this amount under normal market conditions. However, it is critical to understand that VaR is only a statistical estimate, and it does not capture extreme events that fall outside the 95% confidence interval, often referred to as "tail risk." Additionally, actual future performance may vary, which means the actual loss could be larger or smaller than the VaR suggests.
This comprehensive view of risk clearly delineates the potential downside of the investment in e.l.f. Beauty, Inc., blending the insights from volatility modeling of historical returns with the predictive capacity of advanced machine learning techniques. By unifying these analytical methods, investors can approach equity investments with a more nuanced and informed perspective on the associated financial risks.
Similar Companies in Household & Personal Products:
The Procter & Gamble Company (PG), Colgate-Palmolive Company (CL), Coty Inc. (COTY), Kenvue Inc. (KVUE), Hims & Hers Health, Inc. (HIMS), Newell Brands Inc. (NWL), Grove Collaborative Holdings, Inc. (GROV), The Estee Lauder Companies Inc. (EL), The Honest Company, Inc. (HNST), The Beauty Health Company (SKIN), Kimberly-Clark Corporation (KMB), Unilever PLC (UL), The Clorox Company (CLX), Natura &Co Holding S.A. (NTCO), Inter Parfums, Inc. (IPAR), Coty Inc. (COTY), Estee Lauder Companies Inc. (EL), Revlon, Inc. (REV), Ulta Beauty, Inc. (ULTA), L'Oreal USA, Inc. (LRLCY), LVMH Moet Hennessy Louis Vuitton SE (LVMUY)
https://www.zacks.com/commentary/2193407/4-cosmetics-stocks-worth-watching-amid-industry-headwinds
https://seekingalpha.com/article/4657607-elf-beauty-upgrading-to-buy-as-estimates-remain-too-low
https://www.zacks.com/stock/news/2198300/e-l-f-beauty-elf-laps-the-stock-market-here-s-why
https://www.fool.com/investing/2024/01/03/2-disruptors-i-love-right-now/
https://finance.yahoo.com/news/3-best-russell-2000-stocks-123841552.html
https://finance.yahoo.com/m/fc166287-5600-35c2-aa43-ea642b438971/beauty-is-skin-deep-for-this.html
https://www.zacks.com/commentary/2208641/best-growth-stocks-to-buy-for-january-11th
Copyright © 2024 Tiny Computers (email@tinycomputers.io)
Report ID: yArO36
https://reports.tinycomputers.io/ELF/ELF-2024-01-17.html Home