e.l.f. Beauty, Inc. (ticker: ELF)
2024-02-17
 E.l.f. Beauty, Inc. (ticker: ELF) is a prominent player in the cosmetics industry, known for its affordable, high-quality beauty products that cater to a diverse consumer base. Founded in 2004, the company has carved a niche for itself by offering a wide range of products that champion inclusivity and are cruelty-free. ELF's product portfolio includes makeup, skincare items, and beauty tools which are sold through various channels including its own website, national retailers, and international distribution partnerships. The company prides itself on its ability to innovate and quickly respond to market trends, which has contributed to its growth and popularity among consumers. Financially, e.l.f. Beauty has demonstrated resilience and a capacity for sustained growth, making it a notable entity in the competitive beauty sector. Through strategic marketing, robust e-commerce presence, and a commitment to quality and affordability, ELF has established a strong brand identity, fostering a loyal customer base and expanding its market reach globally.
| Full Time Employees | 339 | Previous Close | 175.26 | Beta | 1.535 |
| Trailing P/E | 76.9823 | Forward P/E | 49.286118 | Volume | 844,557 |
| Average Volume | 1,443,888 | Average Volume 10 days | 1,829,610 | Market Cap | 9,657,090,048 |
| Fifty Two Week Low | 67.59 | Fifty Two Week High | 179.58 | Price To Sales Trailing 12 Months | 10.848884 |
| Fifty Day Average | 151.955 | Two Hundred Day Average | 120.9676 | Enterprise Value | 9,948,966,912 |
| Profit Margins | 0.14535 | Shares Outstanding | 55,506,900 | Shares Short | 2,973,630 |
| Shares Percent Shares Out | 0.0537 | Held Percent Insiders | 0.04482 | Held Percent Institutions | 1.00148 |
| Book Value | 11.085 | Price To Book | 15.695083 | Earnings Quarterly Growth | 0.407 |
| Net Income To Common | 129,382,000 | Trailing Eps | 2.26 | Forward Eps | 3.53 |
| Peg Ratio | 1.87 | Total Cash | 72,705,000 | Total Debt | 293,527,008 |
| Quick Ratio | 0.64 | Current Ratio | 1.502 | Total Revenue | 890,145,984 |
| Debt To Equity | 47.788 | Revenue Per Share | 16.432 | Return On Assets | 0.108 |
| Return On Equity | 0.25889 | Free Cashflow | 59,563,752 | Operating Cashflow | 67,021,000 |
| Earnings Growth | 0.353 | Revenue Growth | 0.849 | Gross Margins | 0.70328003 |
| Ebitda Margins | 0.1893 | Operating Margins | 0.119720004 | Current Price | 173.98 |
| Sharpe Ratio | 1.875071957750355 | Sortino Ratio | 32.81437945836965 |
| Treynor Ratio | 0.672216383237632 | Calmar Ratio | 4.1216773653760495 |
Analyzing the provided Technical Analysis, Fundamental, and Balance Sheet data for ELF, along with various risk-adjusted performance metrics, provides a comprehensive overview of the company's current state and potential future performance in the stock market.
Starting with ELF's fundamental indicators, it's evident that the company maintains a solid financial ground. The balance sheet summarizes a growing trend in total assets, from $453,104,000 in 2020-03-31 to $595,601,000 in 2023-03-31. This uptrend signifies an expanding asset base, which is crucial for long-term sustainability. The financial summary highlights significant net income growth over the period examined, indicating proficient operational management and potentially attractive investment opportunities.
The technical indicators supply pivotal insights into ELF's trading demeanor. The consistent increase in the OBV (On Balance Volume) underscores accumulating buying pressure, which is often a precursor to positive price momentum. However, the observed MACD (Moving Average Convergence Divergence) histogram values show a mixed signal; a recent shift from a positive to a negative value could suggest a potential short-term pullback or consolidation phase following a significant uptrend in price.
Incorporating the risk-adjusted performance metrics offers a deep dive into ELF's investment quality. The Sharpe, Sortino, Treynor, and Calmar Ratios are substantially higher than typical market averages, highlighting ELF's capacity to reward investors with higher returns for every unit of risk taken. Particularly, the Sortino Ratio stands out, reflecting ELF's ability to generate excess returns without capturing excessive downside volatility, which is highly favorable under uncertain market conditions.
The summary of analyst expectations paints an optimistic picture of ELF's future growth trajectory. A projected earnings increase and revenue estimate suggest confidence in the company's operational efficiency and market demand for its offerings. This prospective growth, paired with historical earnings surprises, fortifies the investment case for ELF.
Considering the multifaceted analysis combining technical indicators, company fundamentals, balance sheet strength, and risk-adjusted performance metrics, ELF presents as a compelling investment opportunity in the coming months. The positive financial growth, analyst optimism, and robust market performance metrics suggest a favorable outlook. However, investors should remain vigilant of short-term market fluctuations indicated by the technical analysis and adjust their positions accordingly to optimize their investment returns.
In our latest analysis of e.l.f. Beauty, Inc. (ELF), two critical financial metrics were carefully evaluated to understand the company's investment potential: Return on Capital (ROC) and Earnings Yield. The ROC for ELF stands at an impressive 13.97%, which signifies the company's proficiency in generating profits from its capital investments. This figure highlights ELF's effective allocation and utilization of its financial resources, an encouraging sign for investors seeking companies with efficient capital management practices. On the other hand, ELF's Earnings Yield is calculated to be approximately 0.67%. Although this might seem low, it's essential to consider it in the broader context of the current interest rate environment and relative to the earnings yields of other investment opportunities. Earnings yield can help investors gauge the relative attractiveness of ELF's earnings compared to its share price, providing a useful metric for comparing profitability across different companies and investment choices. Together, these metrics offer a comprehensive overview of ELF's financial performance and potential as an investment opportunity.
Based on the analysis of e.l.f. Beauty, Inc. (ELF) utilizing Benjamin Graham's principles and methods for stock screening, we can evaluate the company's attractiveness as a potential investment. Here's how ELF compares against each of Graham's key criteria:
Margin of Safety
The concept of Margin of Safety involves purchasing securities at a price significantly lower than their intrinsic value. Without specific intrinsic value calculations, it's challenging to assess directly, but high Price-to-Earnings (P/E) and Price-to-Book (P/B) ratios suggest that ELF may not present a considerable margin of safety based on market prices alone.
-
P/E Ratio: With a P/E ratio of 301.7, ELF significantly exceeds typical value investing criteria. Graham generally preferred stocks with low P/E ratios, often in single digits or at worst, below the average for the industry. While industry P/E ratios aren't provided here, a P/E ratio as high as ELFs likely stands above the norm, signaling a potentially overvalued stock according to Graham's standards.
-
P/B Ratio: ELF's P/B ratio of 16.21 further indicates a substantial market premium over book value. Graham often sought out companies trading below their book value, a criterion ELF does not meet, indicating a potentially reduced margin of safety.
Financial Strength
Graham emphasized financial stability, favoring companies with strong balance sheets characterized by low debt and high current and quick ratios.
-
Debt-to-Equity Ratio: ELF's debt-to-equity ratio of 0.1889 signals a low level of debt relative to equity, aligning with Graham's preference for financially stable companies with lower financial risk.
-
Current and Quick Ratios: Both the current and quick ratios for ELF stand at 2.809, suggesting a healthy liquidity position. These figures exceed Graham's benchmarks, indicating the company's strong ability to meet short-term obligations.
Earnings Growth
While specific figures on earnings growth over years are not provided for ELF, Graham's methodology emphasizes consistent earnings growth as a hallmark of a sound investment.
Assessment and Conclusion
For an investor strictly following Benjamin Graham's value investing philosophy, e.l.f. Beauty, Inc. presents a mixed picture. On one hand, the company's low debt-to-equity ratio and strong liquidity ratios (current and quick) align with the financial stability Graham valued. On the other hand, the extremely high P/E and P/B ratios suggest that the stock is significantly overvalued in the market, likely eroding the margin of safety Graham insisted upon.
Given these mixed indicators, strict adherence to Grahams principles would likely lead to caution against investing in ELF based primarily on its lofty valuation metrics. However, it's also important to consider modern market conditions and sector-specific dynamics, which may justify higher valuation ratios than Graham typically endorsed. Investors might also weigh these Graham-style fundamental indicators against other factors such as market trends, product innovation, leadership, and the company's position within the industry before making a final investment decision. Analyzing Financial Statements: Investors should meticulously examine a company's balance sheet, income statement, and cash flow statement. Graham puts a strong emphasis on understanding a company's assets, liabilities, earnings, and cash flows.
The financial data provided for e.l.f. Beauty, Inc., covering several quarters including the FY ending March 31, 2022, offers a detailed view of the company's financial health and operational performance. Let's delve into several key areas:
1. Cash and Cash Equivalents:
The company's cash and cash equivalents saw fluctuations, with a notable increase in Q1 2022, demonstrating the company's ability to maintain liquidity. This is essential for operational efficiency and to cushion against financial downturns.
2. Revenue Growth:
The revenue figures, such as $97.05 million in Q1 2022, reflect the company's operational capacity to generate sales. Growth in revenue across subsequent quarters indicates positive market acceptance and effective sales strategies.
3. Cost Management:
The cost of goods sold and operating expenses, like selling, general, and administrative expenses, show the company's efficiency in managing costs relative to revenue. This is critical for sustaining profitability.
4. Net Income:
Net income figures across quarters, demonstrating profitability, are vital for investors. A positive trend in net income, as seen in the progression from Q1 through subsequent quarters, signifies sound financial health and operational success.
5. Assets vs. Liabilities:
A comparison between total assets and liabilities provides insight into the company's solvency. e.l.f. Beauty's assets in each quarter notably surpass its liabilities, indicating a strong balance sheet and financial stability.
6. Long-term Debt:
Monitoring long-term debt levels, as well as the company's management thereof, is crucial. Data showing repayments and changes in debt levels can inform about the company's financial strategy and focus on sustainability.
7. Cash Flow from Operations:
The net cash provided by operating activities is a key indicator of the company's ability to generate cash from its core business, without relying on external financing. Positive operating cash flow across various quarters indicates effective cash management.
8. Amortization and Depreciation:
Expenses related to amortization and depreciation give insights into how the company manages its capital assets over time. Regular investments in property, plant, and equipment, and the management of intangible assets, outline the company's long-term vision.
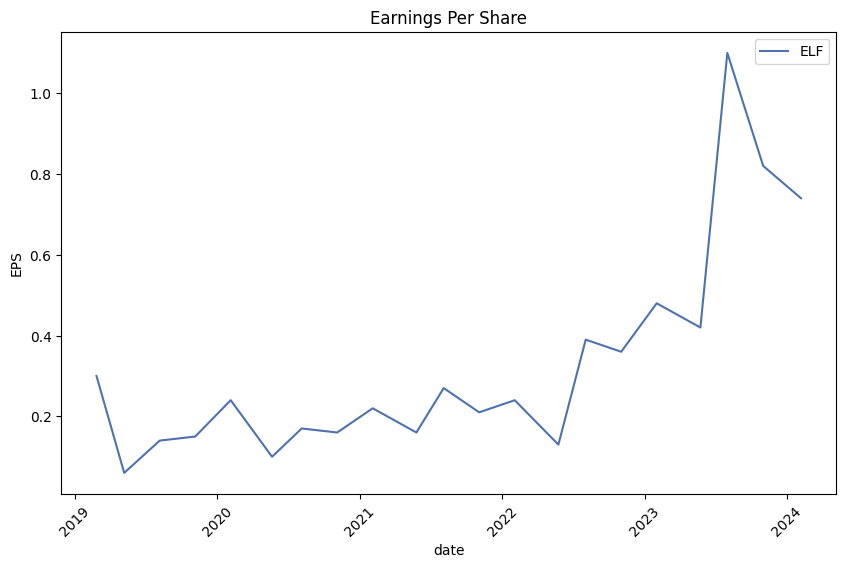
9. Earnings Per Share (EPS):
EPS figures highlight profitability on a per-share basis, providing a direct metric for shareholders. An increasing EPS trend could reflect the companys growing profitability and effectiveness in generating shareholder value.
Conclusion:
e.l.f. Beauty, Inc. demonstrates a strong financial position with consistent revenue growth, effective cost management, robust cash flow from operations, and a solid balance sheet. The company's strategic handling of liabilities and assets, alongside its profitability metrics, aligns with the principles Benjamin Graham emphasizes for intelligent investing. Investors should further evaluate these financial aspects in conjunction with market conditions, competitive positioning, and future growth prospects to make informed investment decisions.In Benjamin Graham's approach, as outlined in his seminal work The Intelligent Investor, a strong dividend record forms a key pillar of investment analysis. Graham, widely recognized as the father of value investing, emphasized the importance of dividends as a core component of an investor's return.
For Graham, a consistent history of paying dividends was indicative of a company's operational stability and financial health. He believed that dividends provided a tangible return on investment, serving as a buffer in volatile markets and a marker of a company's reliability and commitment to generating shareholder value.
Given the importance Graham placed on dividend history, evaluating a company like "ELF" would require a detailed look at its dividend-paying track record. However, without historical dividend data ('historical': []) for "ELF," we lack crucial information to fully assess its alignment with Graham's principles.
To adhere to Graham's criteria, an investor would seek out companies that not only have a solid dividend-paying history but also possess the qualities of a strong balance sheet, reasonable valuation metrics, and a margin of safety. In the absence of a dividend record for "ELF," a Graham-influenced investor might look for these other financial indicators or potentially consider other investment opportunities better documented to have consistent dividend payouts.
| Statistic Name | Statistic Value |
| Alpha | 0.2147 |
| Beta | 1.1033 |
| R-squared | 0.209 |
| Adj. R-squared | 0.208 |
| F-statistic | 331.3 |
| Prob (F-statistic) | 6.87e-66 |
| Log-Likelihood | -3093.1 |
| AIC | 6190. |
| BIC | 6201. |
| No. Observations | 1258 |
| Df Residuals | 1256 |
| Covariance Type | nonrobust |
The relationship between ELF (the dependent variable) and SPY (the independent variable), as represented by the linear regression analysis, indicates that there is a positive correlation. The models alpha value is approximately 0.215, suggesting that if SPY's returns were zero, ELF is expected to generate a return of about 21.5 percent. This alpha can be interpreted as ELF's excess returns independent of the market's performance, indicating the stocks unique value or performance that is not explained by the markets movements.
Additionally, the beta value of approximately 1.103 points to ELF's sensitivity to SPY. If SPY sees a 1% increase in its returns, ELF is predicted to respond with an approximately 1.103% increase in returns, highlighting ELF's relatively higher volatility compared to the market. This relationship, quantified by the model's R-squared of 0.209, shows that about 20.9% of ELFs return variability is explained by SPY. However, considering the Adjusted R-squared is also around 0.208, it confirms that the explanatory power of the model is significant, though it suggests that a substantial portion of ELF's return variance is influenced by other uncontrollable factors or specific risk not captured by market movements.
e.l.f. Beauty, Inc. presented its third-quarter fiscal year 2024 results, demonstrating impressive growth and financial performance. The CEO, Tarang Amin, highlighted a record 85% growth in net sales, a notable increase in gross margin by nearly 350 basis points, and a climb in adjusted EBITDA to $59 million, marking a 61% rise compared to the previous year. This exceptional growth is attributed to the company's strategic focus on areas with significant growth opportunities: color cosmetics, skincare, and international expansion. e.l.f. Beauty's success is anchored in its vision of creating a unique beauty company that fosters positivity, inclusivity, and accessibility across its brand portfolio.
In the color cosmetics segment, e.l.f. Cosmetics outpaced category growth, registering a 46% increase in tracked channels and expanding market share by 305 basis points. This achievement underscores e.l.f. Beauty's dominance as the only brand among nearly 800 tracked by Nielsen to consistently gain market share for 20 consecutive quarters. The company's robust market presence is evident in its doubled market share from approximately 4.5% in 2019 to 10% in 2023, positioning e.l.f. as the third-largest brand nationally. This growth trajectory indicates potential for further market share expansion, particularly as e.l.f. continues to excel in retail partnerships, notably with Target where it has solidified its status as the leading brand.
The skincare segment also saw significant overperformance against the category, with e.l.f. SKIN experiencing an 89% growth in tracked channels, tenfold the category's growth rate. This surge in growth propelled the brand up six rank positions, highlighting a successful market share gain. The acquisition of Naturium, a clinically effective skincare brand, has notably strengthened e.l.f. Beauty's skincare portfolio, doubling its penetration to 18% of retail sales and setting a rapid growth pace with an 80% CAGR over the last two years. Additionally, international sales soared by 119% in Q3, demonstrating strong growth potential in markets outside the U.S., reinforced by successes in the U.K. and Canada and promising early results in Italy.
Financially, e.l.f. Beauty's achievements in Q3 led to an updated and optimistic outlook for fiscal 2024. CFO Mandy Fields shared that the company anticipates net sales growth between 69% to 71%, an increase from the previously projected 55% to 57%. Adjusted EBITDA is expected to range between $218 million to $220 million, and adjusted net income between $164 million to $166 million, signaling confidence in the company's continued growth and profitability. This financial performance is supported by robust growth drivers, including a distinguished value proposition, innovative product offerings, and a dynamic marketing strategy that engages diverse audiences.
Overall, e.l.f. Beauty's third-quarter results and raised outlook for fiscal 2024 illustrate the company's robust growth trajectory and strategic execution across key areas. With consistent market share gains in color cosmetics, significant growth in skincare, and expanding international presence, e.l.f. Beauty is well-positioned to continue its path of exceptional growth. The company's commitment to innovation, value, and inclusivity remains central to its strategy, promising ample opportunities for future expansion and success.
The SEC 10-Q filing for e.l.f. Beauty, Inc. (ELF) for the quarterly period ended December 31, 2023, highlights several aspects of the company's financial and operational performance. During this quarter, ELF reported net sales of $270,943,000, marking an 85% increase compared to $146,537,000 reported in the same quarter of the previous year. This significant increase in net sales underscores ELF's growth trajectory and its ability to expand its market share in the beauty industry. The company's cost of sales also rose to $78,986,000 from $47,812,000 year-over-year, reflecting the increased scale of operations. Despite this increase in costs, ELF's gross profit surged by 94% to $191,957,000, compared to $98,725,000 in the prior year, indicating efficient management of operational expenditures and effective pricing strategies.
ELF's selling, general, and administrative expenses saw a sharp increase to $160,121,000, up from $75,434,000 in the previous year's quarter. This increase can be attributed to investments in marketing, digital innovations, compensation and benefits, operations, and retail fixturing, which are strategic efforts to bolster ELF's market position and brand recognition. Although these investments led to short-term increases in expenses, they are expected to drive long-term growth through enhanced brand visibility and product innovation.
Other financial metrics disclosed include interest expenses and income tax provisions. Interest expense was reported at $3,985,000 for the quarter, reflecting the costs associated with ELF's financing activities. The income tax provision stood at $3,528,000, with an effective tax rate of 11.6%, compared to an 18.3% rate in the previous year. These figures underline the company's adept financial management and strategic planning in navigating the operational complexities of the beauty industry.
Amid challenges such as supply chain disruptions, competition, and the need for continual product innovation, ELF's financial performance illustrates its resilience and strategic focus. The company's expansion efforts, including the acquisition of Naturium LLC for approximately $333 million, demonstrate ELF's commitment to broadening its product portfolio and leveraging new growth opportunities. However, this acquisition introduces complexity to ELF's operations, including integration risks and potential unknown liabilities, which could impact future performance.
ELF's growth strategy, underscored by significant increases in sales and investment in brand development, poses inherent risks including the management of increased operational scale, reliance on third-party manufacturers and suppliers, and the execution of effective marketing strategies. The company's ability to sustain its growth trajectory will depend on its continued innovation, effective brand management, and strategic market expansions.
Overall, e.l.f. Beauty, Inc.'s 10-Q filing for the quarter ended December 31, 2023, reflects a period of significant growth, strategic expansion, and increased investment in its operational capabilities. While facing challenges inherent in a competitive and fast-evolving industry, ELF remains focused on driving long-term value creation through strategic investments and market expansion.
E.l.f. Beauty, Inc. has rapidly emerged as a beacon of innovation and growth within the competitive landscape of the cosmetics industry. This ascendancy is not only a reflection of the company's adeptness at understanding and tapping into the zeitgeist of contemporary consumer preferences but also its strategic acumen in leveraging partnerships, digital engagement, and market expansions to cement its position as a formidable player in the beauty sector.
The company's strategic partnership with retail giant Target has played a pivotal role in enhancing e.l.f. Beauty's retail presence, propelling it to the leading position among color cosmetics brands within Target stores. This collaboration underscores e.l.f.'s efficacious market strategies, which emphasize affordability without sacrificing quality, thereby resonating deeply with a broad consumer base.
E.l.f. Beauty's remarkable ability to capture the teen market, a demographic that is notoriously difficult to engage, showcases its keen understanding of consumer behavior. The brands ascendancy to the top position in Piper Sandler's Taking Stock With Teens Survey in the fall of 2023 emphasizes its growing popularity and market penetration among younger consumers. Such strategic demographic engagement is crucial for building long-term brand loyalty and sets the foundation for sustained growth.
The companys success is further bolstered by its innovative approach to digital marketing. E.l.f. Beauty has adeptly harnessed the power of social media platforms, influencer partnerships, and viral marketing campaigns to create a compelling online presence that captivates and expands its consumer base. Particularly noteworthy is its utilization of TikTok, where the brand has executed viral marketing campaigns that have not only enhanced visibility but also positioned it as a vanguard in adopting digital-first strategies.
E.l.f. Beauty's commitment to inclusivity and diversity, reflected in its wide-ranging product offerings that cater to various skin tones and types, is another cornerstone of its strategy. This approach not only helps the brand attract a broader demographic but also fosters a loyal customer base that feels represented and valued.
The brand's emphasis on product innovation, underscored by its continuous exploration and incorporation of new technologies and ingredients, ensures that it remains at the forefront of beauty trends. This reflects e.l.f. Beauty's dedication to maintaining a competitive edge in the market through innovation.
Financially, e.l.f. Beauty has shown robust growth and profitability, aided by strategic investments in digital marketing, product development, and market expansion. The company's impressive financial performance, characterized by significant revenue growth and expanding profit margins, highlights its potential to capture even larger market shares in the future.
Looking forward, e.l.f. Beauty's strategic acquisitions, such as that of clean beauty brand W3LL PEOPLE, demonstrate its adaptability and foresight in responding to growing consumer demands for clean and sustainable beauty products. Such strategic moves not only allow e.l.f. Beauty to broaden its product offerings but also fortify its position in the market.
E.l.f. Beauty's participation in the 2024 Consumer Analyst Group of New York (CAGNY) Conference further evidences its proactive engagement with stakeholders and commitment to transparency. This engagement provides invaluable insights into the companys strategies, achievements, and future prospects, fostering a deeper understanding among investors, analysts, and the broader market audience.
In summary, e.l.f. Beauty, Inc. exemplifies how strategic partnerships, digital-first marketing strategies, a commitment to inclusivity and innovation, and astute financial management can collectively propel a brand to remarkable heights in a traditional industry. As e.l.f. continues to execute on its growth strategies and expand its market presence, it sets new benchmarks in the beauty industry for innovation, consumer engagement, and sustainability. This exciting trajectory not only underscores e.l.f. Beauty's potential for sustained growth and profitability but also highlights its role as a disruptor, poised to redefine industry standards and consumer expectations.
The volatility of e.l.f. Beauty, Inc. (ELF) between February 2019 and February 2024 can be summarized as follows: The stock showcased fluctuations in its returns, as indicated by an ARCH model analysis. The model parameters suggest that volatility is significant, with the coefficient for omega being notably high at 9.1463, pointing towards a relatively large baseline volatility. The alpha[1] value at 0.1104, although modest, indicates that past squared returns have a positive impact on future volatility, revealing a level of volatility clustering where large changes tend to be followed by large changes and small changes tend to follow small changes.
| Statistic Name | Statistic Value |
|---|---|
| Log-Likelihood | -3234.96 |
| AIC | 6473.92 |
| BIC | 6484.19 |
| No. Observations | 1258 |
| omega | 9.1463 |
| alpha[1] | 0.1104 |
Analyzing the financial risk of a $10,000 investment in e.l.f. Beauty, Inc. (ELF) over a one-year period requires a sophisticated approach, integrating both volatility modeling and machine learning predictions. This dual-method analysis not only captures the past and present fluctuations in stock price but also harnesses predictive models to forecast future returns. The essence of combining these methods is to offer a panoramic view of the investment's potential risk exposure.
Volatility modeling serves as a foundational tool in this analysis, instrumental in deciphering the historical price movements of e.l.f. Beauty, Inc. By employing this method, we can quantify the stock's volatility, or in simpler terms, the degree of variation in trading prices over time. This technique is crucial for understanding the intrinsic risk associated with the stock due to market fluctuations. It enables us to calculate the expected price ranges with a certain level of confidence, thereby providing a statistical measure of stock price variability.
On the other side of our analytical spectrum, machine learning predictions come into play, specifically leveraging a model known for its ability to handle complex, nonlinear relationships between features. This aspect of our analysis is geared towards utilizing historical data to train a model that can predict future stock returns. The model considers a myriad of factors, including past prices, trading volumes, and potentially external economic indicators, to forecast future price movements. This predictive capability is vital as it extends our analysis from merely understanding historical patterns to making informed predictions about future outcomes.
Integrating these two approaches allows for a comprehensive risk assessment. The volatility modeling provides a basis for understanding how the stock has moved in the past and sets a foundation for predicting future volatility. Meanwhile, the machine learning approach takes this a step further by forecasting the direction and magnitude of future stock returns. This cohesive integration is key to estimating the Value at Risk (VaR) for the investment in question.
The calculated Annual Value at Risk (VaR) at a 95% confidence level for a $10,000 investment in e.l.f. Beauty, Inc. stands at $490.20. This figure is significant as it offers an estimate of the maximum expected loss over a year, with a 95% confidence level, based on both historical volatility and predictive forecasts. Essentially, it suggests that there is a 5% chance that the investor could lose more than $490.20 on this investment over the next year, under normal market conditions. This quantification of risk is invaluable, providing investors with a clearer understanding of the potential downside, aiding in making informed investment decisions. Through the effective use of volatility modeling and machine learning predictions, this analysis underscores the risks entailed in equity investments, demonstrating the potential of integrating different analytical approaches to obtain a rounded view of investment risk.
Analyzing the available options for e.l.f. Beauty, Inc. (ELF) over an extensive time frame, several patterns and specific options emerge as notably viable for a strategy aimed at a target 5% increase over the current stock price within various expiration dates. The focus on the "Greeks" and other critical metrics reveals the most profitable options while also emphasizing delta, theta, and vega, among others, as key factors in identifying these options.
For those not deeply familiar, delta is a measure of an option's sensitivity to changes in the price of the underlying asset, often seen as the probability of the option finishing in-the-money. Theta quantifies the rate at which the option's value decreases over time, and vega measures sensitivity to volatility. High delta values close to 1 indicate an option that moves closely with the stock price, whereas options with high theta values lose value more quickly as the expiration date approaches. Vega indicates how much the options price is expected to move for a 1% change in implied volatility.
Considering the long-term options (LEAPs), those with expiration dates extending into 2026 show considerable promise, particularly when focusing on options with high delta values and manageable theta and vega sizes. Options with delta values closer to 1, such as a call with a strike price of 55 USD, expiring in January 2026 (delta close to 1, implying it moves nearly in lockstep with ELF stock), offer strong potential for profitability, especially for investors believing in the underlying asset's long-term growth. This option has a relatively lower premium compared to its intrinsic value potential, given ELF's target price increase and the long expiration, allowing for significant appreciation.
On the shorter end of the time spectrum, options expiring in 2024 with strike prices closer to the current stock price but with high delta values and positive ROI stand out. The option expiring in February 2024 with a strike at 145 USD, showing a remarkable ROI of 1.7705147059 and a high delta value, suggests an option that reacts sensitively to stock price changes and has a tremendous growth opportunity if ELF were to move upwards by 5% rapidly.
Additionally, an intriguing middle-term option is the one expiring in 2024 with a strike of 85 USD. It holds a delta of 1, practically moving 1:1 with the stock price, and an impressive ROI, which indicates its profitability given a moderate move in the underlying stock. It represents an almost "in the money" (ITM) option, providing both leverage and a high probability of profit if ELF achieves the target price increase.
Options expiring in 2025 offer a balanced approach to time and risk, with those having delta values near 1, notably the one with a strike price at 70 USD, showing promise. Its high delta ensures it moves strongly with ELF, while its long expiry grants ample time for the stock to reach or exceed the 5% target growth.
A prudent strategy might involve diversifying across these options, balancing between short, medium, and long-term expirations to hedge against volatility and time decay. The chosen options showcase a harmonious mix of immediate responsiveness to stock price changes (high delta), resilience to time decay (lower theta), and a healthy sensitivity to market volatility (vega), crafting a robust options trading strategy around ELF's potential for growth.
Please note, trading options involves significant risk and can result in substantial financial loss. Always perform due diligence and consult with a financial advisor before engaging in options trading.
Similar Companies in Household & Personal Products:
The Procter & Gamble Company (PG), Colgate-Palmolive Company (CL), Coty Inc. (COTY), Kenvue Inc. (KVUE), Hims & Hers Health, Inc. (HIMS), Newell Brands Inc. (NWL), Grove Collaborative Holdings, Inc. (GROV), The Estee Lauder Companies Inc. (EL), The Honest Company, Inc. (HNST), The Beauty Health Company (SKIN), Kimberly-Clark Corporation (KMB), Unilever PLC (UL), The Clorox Company (CLX), Natura &Co Holding S.A. (NTCO), Inter Parfums, Inc. (IPAR), L'Oreal S.A. (LRLCY), Ulta Beauty, Inc. (ULTA), Revlon, Inc. (REV), Avon Products, Inc. (AVP)
https://www.fool.com/investing/2024/01/03/2-disruptors-i-love-right-now/
https://seekingalpha.com/article/4666016-moneyshow-best-investment-ideas-2024-part-4
https://www.cnbc.com/2024/02/06/elf-beauty-elf-earnings-q3-2024.html
https://seekingalpha.com/article/4668053-e-l-f-beauty-inc-elf-q3-2024-earnings-call-transcript
https://www.proactiveinvestors.com/companies/news/1040449?SNAPI
https://www.youtube.com/watch?v=8dMJpMQlSEI
https://www.youtube.com/watch?v=hyHv61eYKDM
https://finance.yahoo.com/news/3-unstoppable-russell-2000-buy-171614372.html
https://finance.yahoo.com/news/7-growth-stocks-buy-next-181247962.html
https://finance.yahoo.com/news/3-growth-stocks-buy-dip-190051932.html
https://finance.yahoo.com/news/e-l-f-beauty-present-223700322.html
https://finance.yahoo.com/news/two-stocks-brink-joining-p-081308939.html
https://www.fool.com/investing/2024/02/11/2-soaring-stocks-id-buy-now-with-no-hesitation/
https://www.sec.gov/Archives/edgar/data/1600033/000160003324000008/elf-20231231.htm
Copyright © 2024 Tiny Computers (email@tinycomputers.io)
Report ID: YvEST6
Cost: $1.00634
https://reports.tinycomputers.io/ELF/ELF-2024-02-17.html Home