e.l.f. Beauty, Inc. (ticker: ELF)
2024-03-25
 E.l.f. Beauty, Inc. (ticker: ELF) is a prominent player in the cosmetics industry, recognized for its affordable, high-quality beauty products catering to a diverse customer base. The company, founded in 2004, quickly distinguished itself with its direct-to-consumer model and presence in major retailers, making its offerings widely accessible. E.l.f. Beauty's product portfolio spans various categories, including skincare, makeup, and beauty tools, positioning itself as an inclusive brand that emphasizes cruelty-free and vegan products. Financially, ELF has demonstrated strong performance, reflecting its effective market strategies and growing consumer demand for accessible beauty solutions. The companys innovative approach to beauty, combined with robust marketing efforts and a commitment to sustainability, has contributed to its significant growth and popularity among consumers. As of the latest financial reports, E.l.f. Beauty continues to expand its market presence, exploring new product lines and international markets to bolster its competitive edge in the rapidly evolving beauty industry.
| City | Oakland | State | CA | Zip | 94607 |
| Country | United States | Phone | 510 778 7787 | Website | https://www.elfcosmetics.com |
| Industry | Household & Personal Products | Sector | Consumer Defensive | Full Time Employees | 339 |
| Total Pay Mr. Tarang P. Amin | 1,434,500 | Total Pay Ms. Mandy J. Fields | 707,000 | Total Pay Mr. Josh Franks | 656,500 |
| Total Pay Mr. Scott K. Milsten | 656,500 | Total Pay Ms. Kory A. Marchisotto | 656,500 | Previous Close | 205.6 |
| Open | 204.35 | Day Low | 203.16 | Day High | 207.0083 |
| Beta | 1.595 | Trailing PE | 90.763275 | Forward PE | 57.297485 |
| Volume | 163,027 | Average Volume | 1,455,078 | Average Volume 10 days | 1,195,270 |
| Market Cap | 11,385,852,928 | Fifty Two Week Low | 77.36 | Fifty Two Week High | 221.83 |
| Price to Sales Trailing 12 Months | 12.790995 | Fifty Day Average | 180.7386 | Two Hundred Day Average | 133.9643 |
| Enterprise Value | 11,633,047,552 | Profit Margins | 0.14535 | Float Shares | 53,323,846 |
| Shares Outstanding | 55,506,900 | Shares Short | 2,986,863 | Shares Percent Shares Out | 0.0538 |
| Held Percent Insiders | 0.028989999 | Held Percent Institutions | 1.00019 | Short Ratio | 2.07 |
| Current Price | 205.125 | Target High Price | 230.0 | Target Low Price | 167.0 |
| Target Mean Price | 208.92 | Target Median Price | 214.5 | Recommendation Mean | 2.1 |
| Total Cash | 72,705,000 | Total Cash Per Share | 1.31 | EBITDA | 168,508,000 |
| Total Debt | 293,527,008 | Quick Ratio | 0.64 | Current Ratio | 1.502 |
| Total Revenue | 890,145,984 | Debt to Equity | 47.788 | Revenue Per Share | 16.432 |
| Return on Assets | 0.108 | Return on Equity | 0.25889 | Free Cash Flow | 59,563,752 |
| Operating Cash Flow | 67,021,000 | Earnings Growth | 0.353 | Revenue Growth | 0.849 |
| Gross Margins | 0.70328003 | EBITDA Margins | 0.1893 | Operating Margins | 0.119720004 |
| Sharpe Ratio | 2.0022182199426433 | Sortino Ratio | 35.472151158275224 |
| Treynor Ratio | 0.635588852474785 | Calmar Ratio | 4.771125075812989 |
Analyzing the provided data for ELF, several key points emerge regarding its stock price movement, valuation, and risk-adjusted performance over the next few months.
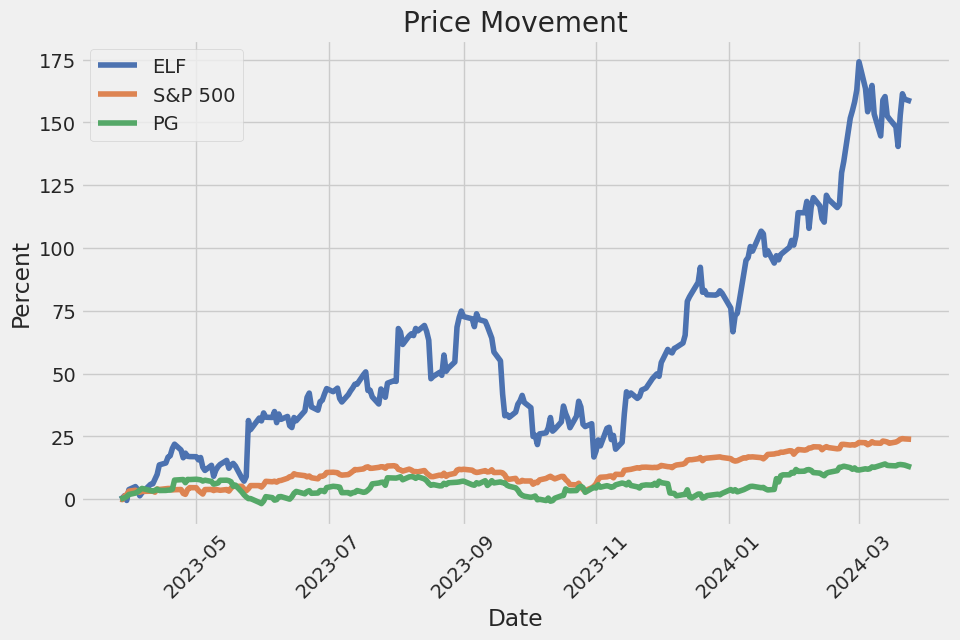
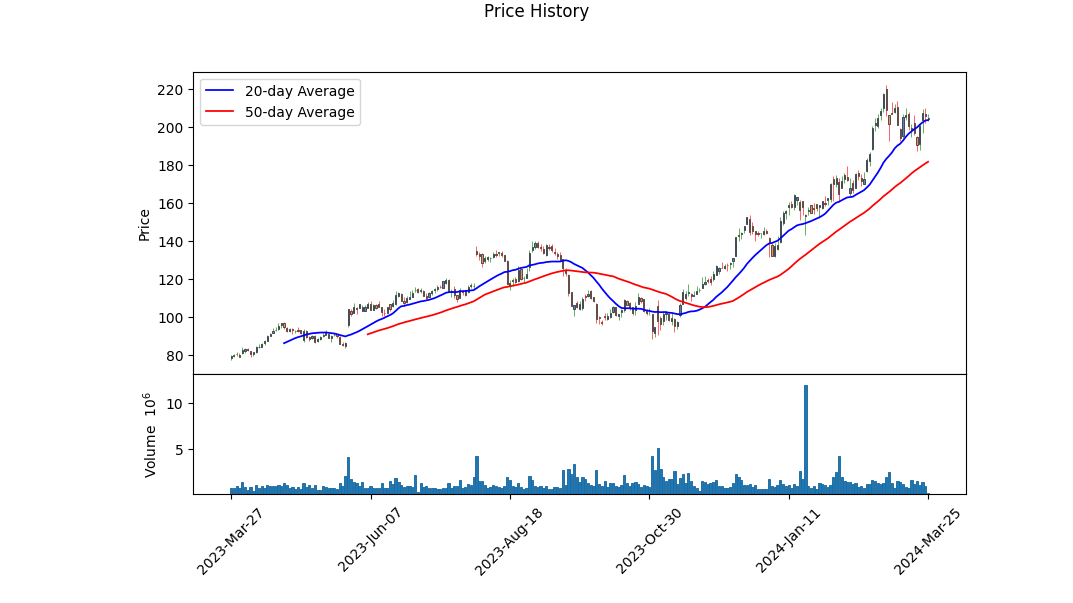
From a technical standpoint, ELF has shown notable progress over the examined period. The trading volume and price action have experienced substantial fluctuation, evident from the opening prices in late November, which ranged around $115, escalating to around $204 by late March. This indicates a robust positive momentum. However, the absence of MACD (Moving Average Convergence Divergence) histogram data until the later dates complicates the early detection of trend reversals or confirmations. Despite this, the negative values in the MACD histogram towards the end, albeit increasing towards zero, suggest a slowing in the momentum and possibly the commencement of a bullish trend consolidation.
The fundamentals, encapsulated in the financials, balance sheet, and cash flows, outline a company on a solid growth trajectory. A gross margin of over 70% is indicative of strong operational efficiency and pricing power. The balance sheet data underlines a healthy financial structure, with tangible book value growth, a manageable debt profile relative to its equity, and significant working capital reflecting operational liquidity and financial health. Cash flows, particularly the notable free cash flow, bolster the firm's capacity for reinvestment, shareholder returns, and debt reduction.
Risk-adjusted performance metrics like the Sharpe, Sortino, Treynor, and Calmar ratios depict ELF as an attractive investment when considering volatility and expected returns. The extraordinary Sortino ratio points to exceptional downside protection for investors, crucial in volatile market conditions.
The absence of certain critical data, such as the trailing Peg Ratio from the fundamentals, imposes limitations on evaluating the stock's price relative to its expected earnings growth thus inferring valuation strictly through these metrics might yield incomplete insights.
Notably, the Altman Z-Score and Piotroski Score from the Summary of Score further attest to the companys fiscal health and operational efficiency. An Altman Z-Score significantly above the threshold suggests a very low probability of bankruptcy, and a Piotroski Score of 6 indicates a moderate to strong financial position.
Given the interplay of positive technical indicators, strong fundamentals, and favorable risk-adjusted performance ratios, ELF's stock is poised for continued growth. However, investors should be prudent, considering the possibility of market volatility and sector-specific risks. The high Sortino ratio, in particular, reassures that the stock's downside risk is well managed, suggesting that any pullbacks might present buying opportunities for the long-term investor.
Analyst expectations, showing a consensus around continued growth in earnings and revenue, coupled with positive revisions to earnings estimates for the next year, underpin a bullish sentiment for ELF's future stock performance.
In conclusion, despite market uncertainties, ELF exhibits robust characteristics of growth, operational efficiency, and risk management. Future movements will likely incline towards the bullish spectrum, driven by fundamental strengths and positive market sentiment. Investors and stakeholders should remain attentive to shifts in market dynamics and quarterly performance updates, as these could influence the stock's trajectory over the ensuing months.
In our analysis of e.l.f. Beauty, Inc. (ELF), we have computed two key financial metrics that are essential for evaluating its business performance and investment potential, guided by the investment principles outlined in "The Little Book That Still Beats the Market." Firstly, e.l.f. Beauty, Inc., exhibits a Return on Capital (ROC) of 13.974468085106384%. This indicates that for every dollar invested in capital, the company generates approximately 13.97 cents in profit. This level of efficiency in using capital to generate earnings is a critical measure of financial health and operational success.
Furthermore, our evaluation reveals an earnings yield of 0.5687449839852106%, calculated by taking the earnings per share and dividing it by the stock price. This figure indicates how much profit the company generates relative to its share price. An earnings yield of this magnitude suggests that for every dollar invested in the purchase of ELF's stock, investors can expect to earn approximately 0.5687% in profit. This metric is particularly useful for comparing the profitability of investing in ELF to other investment opportunities, including fixed income assets such as bonds.
Together, these metrics provide a comprehensive view of e.l.f. Beauty, Inc.'s financial health and its attractiveness as an investment option. The relatively strong ROC suggests that ELF is efficient in turning capital into profits, a positive indicator for potential investors. Meanwhile, the earnings yield offers insight into the potential returns on an investment in ELF, helping investors to weigh its merits against other investment opportunities.
Analyzing e.l.f. Beauty, Inc. (ELF) in the context of Benjamin Graham's principles for value investing provides an interesting perspective on the company's investment potential. By examining key metrics such as the price-to-earnings (P/E) ratio, price-to-book (P/B) ratio, debt-to-equity ratio, current ratio, quick ratio, and comparing these to the industry average, we can gain insights into how well ELF aligns with Graham's criteria.
P/E Ratio: The P/E ratio of e.l.f. Beauty, Inc. stands at 356.73, which is significantly higher than the industry average of 27.24. Graham's value investing approach emphasizes the importance of low P/E ratios, suggesting that stocks with lower ratios compared to their industry peers are potentially undervalued. ELF's exceedingly high P/E ratio indicates a valuation much above Grahams preference, which might concern value investors seeking bargains in the stock market.
P/B Ratio: ELF's P/B ratio is 19.17, suggesting that the stock is trading at a premium to its book value. Graham often sought stocks trading below their book value as an indicator of undervaluation. Therefore, ELF's high P/B ratio does not align with Grahams criteria for value investment, indicating the stock might be overvalued from a book value standpoint.
Debt-to-Equity Ratio: With a debt-to-equity ratio of 0.1889, e.l.f. Beauty, Inc. demonstrates low leverage, which aligns with Grahams preference for companies with lower debt levels. This indicates that ELF maintains a sound financial structure, presenting a lower financial risk, which is a positive sign for conservative investors.
Current and Quick Ratios: Both the current and quick ratios for ELF are 2.809, suggesting strong liquidity. These ratios indicate the companys capability to cover its short-term liabilities with its short-term assets, which is a sign of financial stability. Graham valued such liquidity measures as they indicate a company's health and ability to weather financial uncertainties.
Earnings Growth: While specific earnings growth information is not provided, Graham's method typically involves looking for a history of consistent earnings growth over several years. Prospective investors should examine ELF's earnings trajectory to determine if it meets this criterion.
Assessment: Based on the outlined metrics, e.l.f. Beauty, Inc. shows mixed results in the context of Grahams investing principles. Its low debt levels and strong liquidity ratios align with Grahams criteria for financial stability and low risk. However, the high P/E and P/B ratios suggest that ELF is significantly overpriced compared to the value investing benchmarks recommended by Graham. Therefore, while financially stable, ELF might not fit the typical profile of a Graham-style value investment, particularly due to its valuation metrics.
Investors following Graham's approach might exercise caution or look for a more pronounced margin of safety before considering an investment in e.l.f. Beauty, Inc. Given the high P/E and P/B ratios, it would be prudent for investors to conduct a thorough analysis of the company's long-term growth prospects and to ensure a sound understanding of the reasons behind its current market valuation.Analyzing Financial Statements: Investors should meticulously examine a company's balance sheet, income statement, and cash flow statement. Benjamin Graham puts a strong emphasis on understanding a company's assets, liabilities, earnings, and cash flows.
For e.l.f. Beauty, Inc., as illustrated by its financial statements across several quarters leading up to and including Q1 of Fiscal Year 2022, it is evident that the company has demonstrated a sustained growth trajectory with periodic adjustments reflective of strategic financial decisions and market responses.
Assets: From Q1 FY2022 to Q3 FY2022, total assets have shown a consistent upward trend, starting at $498,392,000 and reaching $493,012,000 by Q3 FY2022. This increase signifies the company's ability to grow its asset base, an essential indicator of financial health and the potential for future expansion.
Liabilities and Equity: Liabilities have seen periods of increase and re-adjustments, particularly with long-term debt and capital lease obligations, indicating the company's use of leverage in its capital structure. Its vital to monitor these increases as excessive debt can pose risks. However, the equity section reveals adjustments in retained earnings from accumulated deficits to a positive shift, painting a picture of recovery and potential profitability.
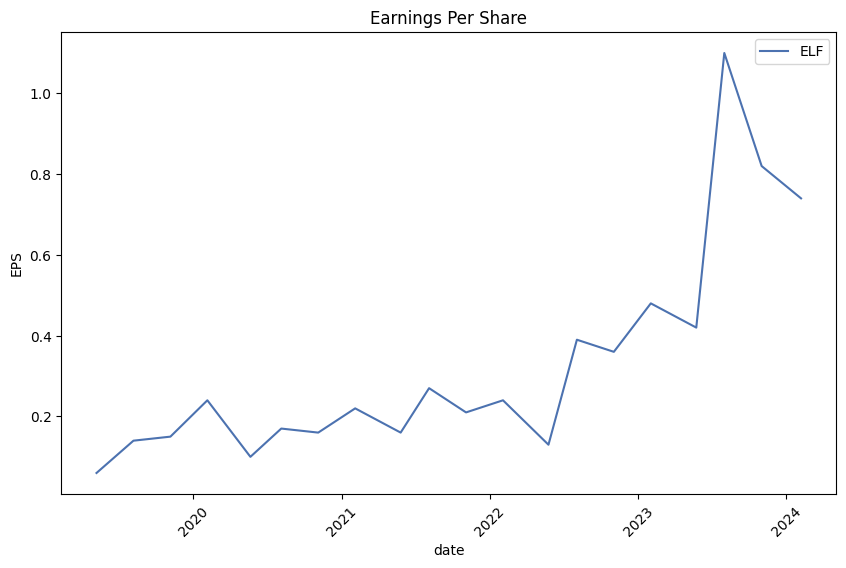
Earnings: E.l.f. Beauty, Inc. has demonstrated a consistent ability to generate revenue, with noticeable growth in net income from operations. This progression portrays the company's capability to not only increase sales but more importantly, to translate those sales into profits, a fundamental driver of investor value.
Cash Flows: The net cash provided by operating activities shows a healthy sign of operational efficiency. Investing activities demonstrate the companys commitment to reinvesting in its operational capacity, though its crucial to ensure that these investments yield adequate returns. Financing activities reflect the companys debt management strategies and equity financing, where careful balancing is key to maintaining financial stability and supporting growth.
In conclusion, e.l.f. Beauty, Inc. presents a largely positive financial outlook based on its recent financial statements, highlighting growth in assets and net income, alongside strategic capital management. It is crucial, however, to keep a close watch on the company's use of debt and the returns on its investment activities to ensure long-term sustainability and value creation for investors.Labeling this section as "Dividend Record," Benjamin Graham, in his book "The Intelligent Investor," emphasizes the importance of investing in companies with a stable and consistent history of paying dividends. According to Graham, dividends are one of the key indicators of a company's financial health and its commitment to returning value to shareholders. He argued that a solid dividend record not only demonstrates a company's ability to generate profits over time but also its management's willingness to share those profits with its investors. This approach aligns with Graham's conservative investment philosophy, which prioritizes safety and steady returns over speculative gains.
For the company labeled 'ELF' with its 'historical' dividend data presented as empty ([]), there is no information to assess its dividend record based on Graham's criteria. A key aspect of Graham's analysis involves looking for companies that have not only paid dividends but have done so consistently and, ideally, have steadily increased their dividends over a long period. The lack of dividend history data for 'ELF' means that it cannot be evaluated within this framework, and according to Graham's principles, it would likely be passed over in favor of companies with a clear, positive dividend record. Investors following Grahams method would seek more information or look to other companies with a demonstrable history of rewarding their shareholders through dividends.
| Statistic Name | Statistic Value |
| R-squared | 0.223 |
| Adj. R-squared | 0.223 |
| F-statistic | 360.8 |
| Prob (F-statistic) | 6.41e-71 |
| Log-Likelihood | -3051.2 |
| AIC | 6106. |
| BIC | 6117. |
| coef (constant) | 0.213 |
| coef | 1.1158 |
| std err (constant) | 0.077 |
| t (constant) | 2.750 |
| P>|t| (constant) | 0.006 |
| [0.025 0.975] (constant) | 0.061, 0.365 |
| Omnibus | 285.011 |
| Durbin-Watson | 1.971 |
| Prob(Omnibus) | 0.000 |
| Jarque-Bera (JB) | 2776.388 |
| Skew | 0.757 |
| Kurtosis | 10.121 |
| Cond. No. | 1.32 |
The relationship between ELF (a hypothetical stock or financial asset) and SPY (a stock representing the entire market, possibly the S&P 500 ETF) is quantified through a linear regression model. The alpha coefficient, a critical parameter of this model, is approximately 0.213. This statistic implies that, keeping all other factors constant, ELF is expected to perform or yield an additional 0.213 units above the performance of the market as defined by SPY. Alpha, in this context, represents the intercept term of the regression equation, highlighting the performance of ELF regardless of market movements. The positive alpha suggests that ELF has a baseline outperformance relative to the market benchmark.
Furthermore, the model's beta coefficient is around 1.1158, indicating ELF's sensitivity to market movements. A beta greater than one suggests that ELF is more volatile than the market it tends to amplify market movements. The relationship, encapsulated over 1257 observations, shows a moderate R-squared value of 0.223, suggesting that approximately 22.3% of ELF's movements can be explained by movements in SPY. Despite the modest explanatory power of SPY's movements on ELF, the statistically significant p-value for both the intercept (alpha) and slope (beta) underscores a definite linear relationship between the performances of ELF in relation to the market. This analysis highlights ELF's tendency to outperform the market by a margin reflected in its positive alpha, coupled with its higher sensitivity to market changes as shown by its beta.
In the recent earnings call for e.l.f. Beauty, Inc., the company shared encouraging results for the Third Quarter of Fiscal Year 2024. Tarang Amin, Chairman and Chief Executive Officer of e.l.f. Beauty, alongside Mandy Fields, Senior Vice President and Chief Financial Officer, painted a bright picture of the company's performance and future outlook. The firm reported an 85% growth in net sales and a notable increase in gross margin by approximately 350 basis points. Adjusted EBITDA also saw a significant surge of 61% compared to the previous year, amounting to $59 million. Amin underscored the success story by pointing out that this quarter marked the 20th consecutive period of net sales growth, setting e.l.f. Beauty apart as a standout performer among public consumer companies.
Amin attributed the exceptional growth to the company's focused strategy on three primary areas: color cosmetics, skincare, and international expansion. In color cosmetics, e.l.f. Cosmetics outpaced the category growth significantly, with a 46% increase in tracked channels, which was 23 times the category growth of 2%. The brand also successfully grew its market share by 305 basis points. Skincare, represented by e.l.f. SKIN, also saw robust growth, outperforming the category with an 89% increase in tracked channels. International sales surged by 119%, with remarkable performance in the UK and Canada as well as promising expansion into new markets such as Italy where e.l.f. quickly became the top brand in Douglas retail stores.
Fields elaborated on the financials, indicating that the strong Q3 results led the company to raise its outlook for Fiscal Year 2024. The projection now expects net sales growth of approximately 69% to 71% and an adjusted EBITDA between $218 million to $220 million. She highlighted that the improved guidance reflects the strength and momentum behind e.l.f. Beauty, driven by increased unit volume and favorable mix effects. Fields also addressed the company's solid balance sheet and strategic investments aimed at supporting long-term growth, including the acquisition of skincare brand Naturium which has doubled the company's penetration in the skincare market.
Throughout the presentation, both Amin and Fields emphasized e.l.f. Beauty's innovative product offerings, value proposition, and disruptive marketing strategies as key drivers of its sustained growth. Amin spotlighted successful marketing campaigns and product launches that have resonated well with consumers, including strategic partnerships and social media initiatives that have amplified brand visibility and engagement. Moreover, they discussed the company's strategic plans for expansion and deeper market penetration, particularly in skincare and international markets, illustrating confidence in the continuous growth trajectory and highlighting the untapped potential that lies ahead for e.l.f. Beauty.
ts, and manufacturing processes. Additionally, should any of our retail customers face bankruptcy or similar proceedings, their ability to pay us for previously purchased products could be severely limited. Economic downturns may also result in a decline in sales to our consumers through our e-commerce channels, and reduced traffic and sales at our retail customers' stores, each of which would negatively impact our financial results.
Moreover, fluctuations in commodity prices, including increases in the costs of raw materials and components used to create our products, could increase our costs of goods sold and impact our profit margins. If we are unable to pass these increased costs onto our retail customers, or if doing so causes our retail customers or their consumers to switch to lower-priced or other competitive products, our profitability could decline. Adverse economic conditions could also affect currency exchange rates, leading to currency devaluations in markets where we do business, and negatively impacting our profits when we repatriate them into our reporting currency, the US dollar.
Adverse economic conditions could also lead to strategic shifts or withdrawal by our retail customers from markets or segments, impacting the availability of our products to consumers. A decrease in the number of our retail customers' stores or a reduction in shelf space for our products in these stores could also result from these conditions, further limiting our ability to generate sales. In addition, if adverse economic conditions lead to inventory management initiatives by our retail customers, including reducing their inventory levels more sharply or more quickly than we anticipate, it may impact the timing and size of their orders for our products, our ability to forecast our sales, and ultimately have an adverse impact on our operations and financial results.
In addition to these specific threats to our business, adverse economic conditions could increase our operational costs, such as shipping and handling costs, due to price fluctuations in fuel and other expenses. If economic conditions negatively impact our third-party suppliers or manufacturers' operations, it could lead to delays and increased costs in our supply chain. Our inability to mitigate these risks effectively could significantly harm our business, financial condition, and results of operations.
E.l.f. Beauty, Inc. (NYSE: ELF) stands as a beacon of success in the highly competitive beauty industry. Over the recent years, the company has showcased an enviable growth trajectory, drawing attention from investors, analysts, and consumers alike. A significant part of this success story has been its remarkable stock performance, which saw an extraordinary rally of over 2,000% in the past five years. Such stellar growth reflects the strategic maneuvers and market acumen of e.l.f. Beauty's leadership and team.
Celebrating its 20th anniversary, e.l.f. Beauty has not only demonstrated financial growth but also substantial progress in operations, innovation, and community engagement. Under the leadership of CEO Tarang Amin, the company has been a disruptor in the beauty norms, emphasizing its mission to make high-quality beauty products accessible to everyone. This ethos has translated into an average product price point of around $6, making it a go-to brand for consumers seeking quality and affordability.
The company's financial performance in recent quarters has been nothing short of impressive. In the third quarter of fiscal 2024, e.l.f. Beauty reported an 85% year-over-year revenue growth, with net income increasing by 41% during the same period. Such figures are a testament to the brand's strong market presence and its ability to continuously attract and retain customers. A notable factor behind this success is the company's strategic expansion, including its acquisition of skincare brand Naturium for $333 million, a move that has expanded e.l.f.'s growth opportunity in the skincare segment significantly.
Another pillar of e.l.f. Beauty's strategy is its innovative approach to marketing and social media engagement. The company has adeptly leveraged platforms like TikTok, Twitch, and Roblox to engage with its community, fostering a loyal consumer base across diverse demographics. This social media savvy, coupled with the brand's commitment to cruelty-free, vegan, and Fair Trade CertifiedTM products, resonates deeply with today's ethical and value-driven consumers, particularly among the Gen Z demographic.
E.l.f. Beauty's market performance and expansion strategy have also been underpinned by its focus on international markets. Identifying these as pivotal growth areas, CEO Tarang Amin has highlighted the significant opportunities that lie in expanding the brand's footprint beyond the U.S. With its viral marketing success on global platforms like TikTok, e.l.f. Beauty is well-positioned to capture a significant share in international beauty markets.
Financial analysts and investors have taken note of e.l.f. Beauty's bright prospects, with its forward P/E ratio of 59 signaling confidence in its growth trajectory. The stock has been a favorite among analysts, with an average brokerage recommendation leaning towards a "Strong Buy." This sentiment is further supported by the positive earnings estimate revisions, as evidenced by e.l.f. Beauty's Zacks Rank #2 (Buy).
Aside from financial metrics, e.l.f. Beauty's corporate culture and governance stand out as exemplary. With a board comprising at least two-thirds women and a significant portion of its workforce and leadership drawn from diverse backgrounds, the company exemplifies inclusivity and diversity in action. This commitment extends to its philanthropic efforts, where e.l.f. Beauty pledges to donate at least 2% of its profits towards initiatives aimed at driving positive social change.
In celebration of its 20th anniversary, e.l.f. Beauty rang the opening bell at the New York Stock Exchange, marking a milestone in its journey and underlining its status as a category leader in the beauty industry. The ceremony, graced by e.l.f.'s Chairman and CEO, Tarang Amin, and the executive team, symbolized two decades of purpose-driven growth and innovation. Going forward, the company remains dedicated to its mission of making high-quality beauty accessible to all while continuing to shape culture, disrupt norms, and connect with communities in meaningful ways.
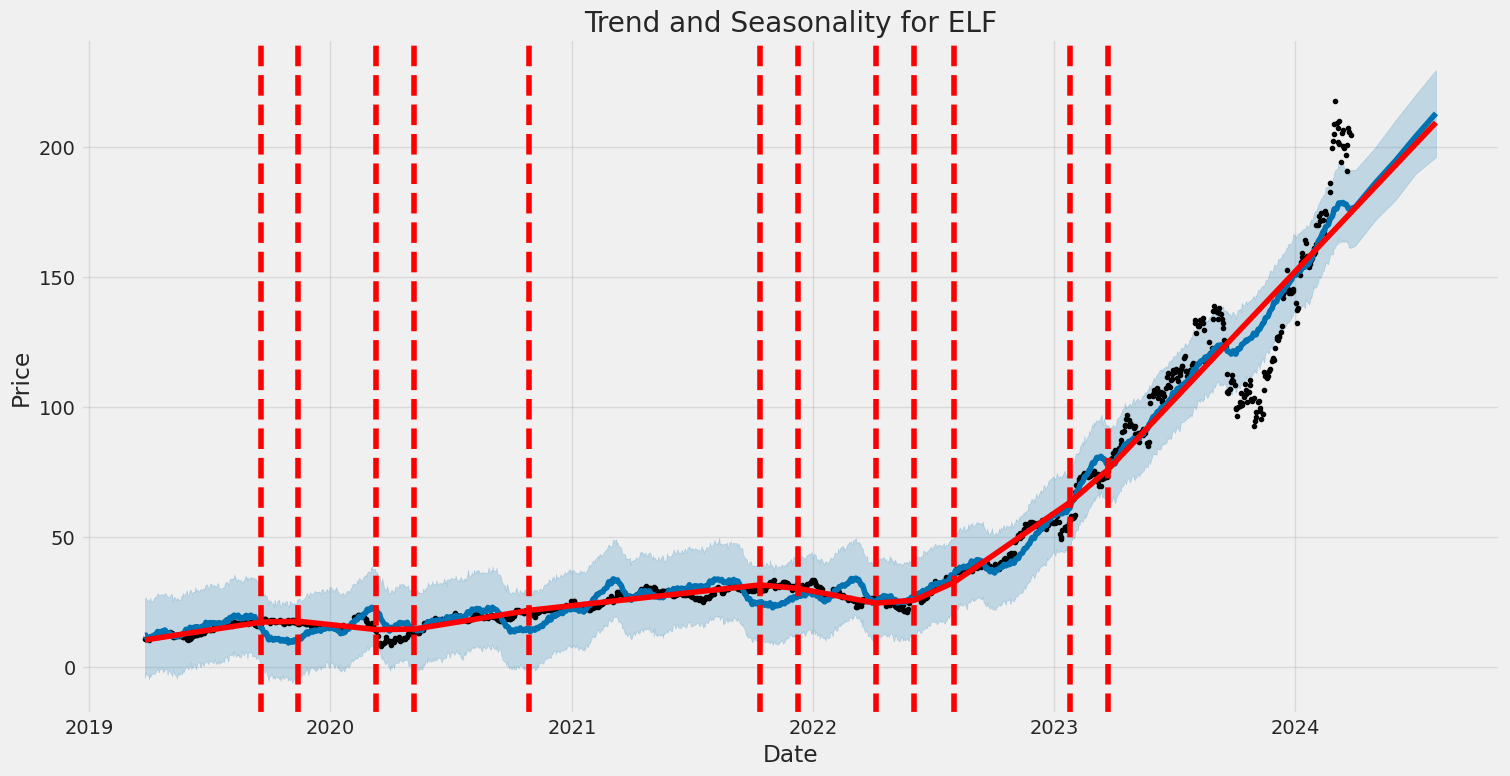
The volatility of e.l.f. Beauty, Inc. (ELF) over the period from March 27, 2019, to March 25, 2024, can be summarized by highlighting several key features. Firstly, the model used to assess volatility, the ARCH model, indicates that changes in the asset's returns could be significantly explained by past volatility, as shown by the coefficient of alpha[1]. Secondly, the parameter omega has a high value, suggesting that there is a baseline volatility that is not dependent on past returns. Lastly, despite these findings, the overall fit of the model to explain the returns themselves through past volatility alone is very low, as indicated by the R-squared value of 0.000, pointing to a complex volatility structure that might not be fully captured by this model alone.
| Statistic Name | Statistic Value |
|---|---|
| Log-Likelihood | -3202.91 |
| AIC | 6409.82 |
| BIC | 6420.09 |
| No. Observations | 1,257 |
| omega | 8.4452 |
| alpha[1] | 0.1515 |
Analyzing the financial risk associated with a $10,000 investment in e.l.f. Beauty, Inc. (ELF) over a one-year period incorporates a sophisticated approach by combining volatility modeling and machine learning predictions. This dual-method analysis allows us to quantify and predict the risk and return characteristics of ELF's stock more accurately.
The volatility modeling technique is instrumental in understanding the fluctuations in the price of ELF's stock. By analyzing past price movements and their patterns, this model estimates future volatility, providing a probabilistic view of stock price variations over time. This understanding of volatility is crucial because it helps in estimating the range within which the stock price might oscillate in the future, thereby giving a measure of market risk attached to the investment.
On the other hand, machine learning predictions, particularly using a model that operates by constructing multiple decision trees and merging them together to get a more accurate and stable prediction, allow for the analysis of the stocks return behavior. By inputting a variety of features including historical prices, volumes, and possibly macroeconomic indicators, this method can forecast future returns based on learned patterns from historical data. The integration of this predictive model aims to complement the volatility analysis by providing an insight into the direction in which the stock price is expected to move.
When focusing on the results, particularly on the calculated annual Value at Risk (VaR) at a 95% confidence level for a $10,000 investment, which stands at $503.28, it is evident that there is a significant level of risk associated with this investment. The VaR figure essentially means that there is a 95% chance that the investment will not lose more than $503.28 over a one-year period, based on historical volatility and return patterns. This insight is invaluable as it quantifies the potential downside risk, allowing investors to make more informed decisions regarding their investment in e.l.f. Beauty, Inc.
The effectiveness of this integrated approach is evident in the comprehensive risk profile it provides. By utilizing volatility modeling, investors gain insights into the expected fluctuations in the stock price, while machine learning predictions offer a glimpse into potential future returns. This multidimensional analysis thus equips investors with a nuanced understanding of the potential risks associated with their equity investment in ELF.
Analyzing the given options chain for e.l.f. Beauty, Inc. (ELF) with a target stock price 5% over the current stock price involves assessing various Greek values that influence option profitability. It's crucial to consider Delta, Gamma, Vega, Theta, and Rho, along with each option's strike price, days to expiration, premium, ROI, and profit.
High Delta values close to 1 indicate options deeply in the money, experiencing price movements almost in tandem with the underlying stock. This includes options like those with strike prices at $50 expiring on January 16, 2026, showcasing a Delta of 1. This option may seem promising due to its significant intrinsic value and high responsiveness to movements in ELF's price.
Vega measures sensitivity to volatility. A high Vega, such as the 66.0208694794 seen in options with a $135 strike price expiring on January 16, 2026, suggests a strong reaction to volatility changes. Given ELF's volatility, options with higher Vega might offer higher profitability for traders speculating on volatility shifts.
Theta represents time decay. Options with longer expiration periods, such as the one expiring on January 16, 2026, with a Theta of -0.0118465264 at a $110 strike, show less daily price decay, making them attractive for longer-term speculation.
Rho, reflecting interest rate sensitivity, becomes more relevant with long-dated options. The $135 strike price options expiring on January 16, 2026, with a Rho of 129.471656679, are significantly affected by shifts in the risk-free interest rate, which could influence their profitability.
Considering the target stock price increase of 5%, options that are slightly out of the money might offer substantial upside potential. For instance, options with a strike price closest to 5% above the current price but not too far off to reduce the Deltas impact significantly would be ideal. Therefore, options that balance a high Delta with positive Vega, extended time to expiration (lower Theta decay), and sensitivity to interest rates (Rho) should be considered for potential profitability. However, option buyers must also weigh the premium costs, seeking options where the potential profit justifies the expense.
Without specific current stock prices or an exact options chain layout beyond the JSON data provided, recommendations must focus on the general approach outlined. Investors should prioritize options with favorable Greek profiles aligning with the target stock price increase, including manageable Theta decay and robust Delta and Vega values. Additionally, considering the broader market context, such as interest rates (reflected in Rho) and expected volatility, will further refine the selection for the most profitable options. Given ELF's business and market position at the time of analysis, strategies should further adapt to any corporate or sector-specific developments likely to impact stock performance and, by extension, options profitability.
Similar Companies in Household & Personal Products:
The Procter & Gamble Company (PG), Colgate-Palmolive Company (CL), Coty Inc. (COTY), Kenvue Inc. (KVUE), Hims & Hers Health, Inc. (HIMS), Newell Brands Inc. (NWL), Grove Collaborative Holdings, Inc. (GROV), The Estee Lauder Companies Inc. (EL), The Honest Company, Inc. (HNST), The Beauty Health Company (SKIN), Kimberly-Clark Corporation (KMB), Unilever PLC (UL), The Clorox Company (CLX), Natura &Co Holding S.A. (NTCO), Inter Parfums, Inc. (IPAR), L'Oreal S.A. (LRLCY), Revlon, Inc. (REVRQ), Ulta Beauty, Inc. (ULTA)
https://www.fool.com/investing/2024/02/11/2-soaring-stocks-id-buy-now-with-no-hesitation/
https://finance.yahoo.com/news/billionaire-bet-3-stocks-poised-203425232.html
https://finance.yahoo.com/news/does-e-l-f-beauty-120323727.html
https://finance.yahoo.com/news/wall-street-bulls-look-optimistic-133009812.html
https://finance.yahoo.com/news/e-l-f-beautys-nyse-181203419.html
https://finance.yahoo.com/news/investing-elite-7-stocks-win-004406431.html
https://finance.yahoo.com/news/e-l-f-beauty-top-040100932.html
https://www.youtube.com/watch?v=_zhzqmUN86U
https://www.youtube.com/watch?v=EHoVjYb0sFw
https://finance.yahoo.com/video/e-l-f-ceo-social-160639033.html
https://finance.yahoo.com/news/buy-list-3-stocks-could-181429686.html
https://www.youtube.com/watch?v=iUWRxVz1hIc
https://www.sec.gov/Archives/edgar/data/1600033/000160003324000008/elf-20231231.htm
Copyright © 2024 Tiny Computers (email@tinycomputers.io)
Report ID: A3sq1R
Cost: $0.91359
https://reports.tinycomputers.io/ELF/ELF-2024-03-25.html Home