General Dynamics Corporation (ticker: GD)
2024-02-02
 General Dynamics Corporation (ticker: GD) stands as a pivotal player in the global aerospace and defense sector, providing a broad spectrum of products and services that cater to a diverse range of markets, including military, commercial aviation, and information technology sectors. With its roots tracing back to 1899, the company has evolved through numerous transformations to establish a robust portfolio that encompasses combat vehicles, nuclear-powered submarines, and communications systems, among others. Notably, General Dynamics is renowned for its production of the Virginia-class submarines and the Abrams main battle tank, which underscore the company's vital role in supporting national defense initiatives. The corporation's consistent commitment to innovation, quality, and sustainability has not only fortified its market position but also ensured its resilience in the face of fluctuating defense budgets and geopolitical challenges. Its financial health, demonstrated through a solid track record of revenue growth and shareholder returns, underscores General Dynamics' strategic capacity to navigate the complexities of the global defense and aerospace landscape.
| Full Time Employees | 100,000 | Dividend Rate | 5.28 | Dividend Yield | 0.0198 |
| Payout Ratio | 0.4393 | 5 Year Avg Dividend Yield | 2.37 | Beta | 0.69 |
| Trailing PE | 22.127394 | Forward PE | 16.26377 | Volume | 1,277,706 |
| Market Cap | 72,522,375,168 | 52 Week Low | 202.35 | 52 Week High | 269.5 |
| Price to Sales Trailing 12 Months | 1.7156126 | 50 Day Average | 253.6492 | 200 Day Average | 230.17815 |
| Enterprise Value | 80,233,144,320 | Profit Margin | 0.07842 | Short Percent of Float | 0.0073 |
| Held Percent Insiders | 0.00471 | Held Percent Institutions | 0.87057 | Book Value | 77.987 |
| Price to Book | 3.4076192 | Net Income to Common | 3,315,000,064 | Trailing EPS | 12.01 |
| Forward EPS | 16.34 | Peg Ratio | 1.44 | Total Cash | 1,912,999,936 |
| Total Debt | 9,260,999,680 | Revenue Per Share | 154.786 | Return on Assets | 0.04987 |
| Return on Equity | 0.1663 | Free Cash Flow | 2,822,749,952 | Revenue Growth | 0.075 |
| Gross Margins | 0.10042 | EBITDA Margins | 0.12084 | Operating Margins | 0.11038999 |
| Sharpe Ratio | 0.7915678159120986 | Sortino Ratio | 15.146138615167832 |
| Treynor Ratio | 0.2728343290276844 | Calmar Ratio | 1.4246153679062432 |
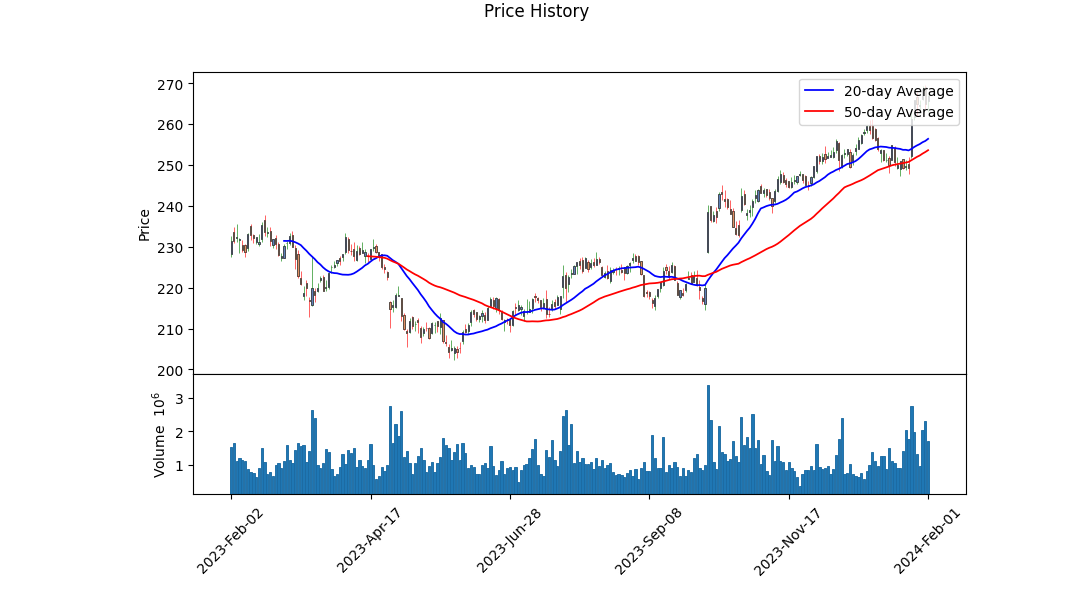
Technical Analysis Overview: The historical price data reveals a notable uptrend, with the stock price moving from $216.75 to $266.869995 over the analyzed period. This indicates a strong bullish sentiment backed by increasing volume, evidenced by the OBV indicator's movement from 0.08201 to 0.74461 million. The Parabolic SAR, MACD histogram, and various other indicators suggest an ongoing uptrend with potential continuance. Given the recent closing price higher than the opening price on 2024-02-01, alongside positive indications from both PSAR and MACD trends, the signal is predominantly bullish.
Fundamental Analysis: The company maintains a healthy financial posture, showcasing consistent revenue and net income growth over the past three years. The growth in earnings, alongside solid management of operating and gross margins, places the company in a strong position vis-a-vis its competitors. The improvement in Net Income from Continuing Operations and a considerable amount in cash excess from operating activities underscore the company's adeptness at sustaining profitability and liquidity. The EBITDA and operating margins are manifesting a stable operational efficiency, implying a robust underlying business model.
Risk-Adjusted Return Measures: The favorable Sharpe, Sortino, Treynor, and Calmar ratios underscore a commendable risk-adjusted performance. Particularly, the Sortino ratio at 15.146138615167832 points towards an excellent ability to generate returns above the risk-free rate while minimizing downside volatility, a pivotal aspect for risk-averse investors. Such metrics indicate a well-balanced risk-return profile, suggesting that the stock could be a worthwhile addition to diversified portfolios seeking growth with controlled risk.
Analyst Expectations and Growth Estimates: Analysts are showing a positive forecast for the forthcoming quarters, restating increased EPS and revenue projection for the next years. The upsurge in analysts' expectations, depicted by the positive revisions in EPS estimates and growth rates, echoes a strong market confidence in the company's growth trajectory. Moreover, the anticipated sales growth further compounds the optimistic outlook for the stock. The Increment in earnings and revenue projections for the current and following years signals underlying corporate growth potential and market confidence.
Based on the provided data and considering the company's solid financial condition, positive technical indicators, and auspicious growth projections, the stock is marked by a bullish outlook for the forthcoming months. The technical indicators align with the companys robust fundamentals, suggesting sustained growth. Investors are likely greeted with a promising growth trajectory, augmented by the firm's compelling financials and positive market sentiment. The alignment of technical analysis with strong fundamental data likely portends a continuation of the upward trend in the stock price.
Investors and stakeholders are encouraged to consider these insights while acknowledging the inherently uncertain nature of the stock markets. The company's strong position, backed by consistent financial performance, positive analyst outlook, and healthy risk-adjusted return ratios, set a persuasive case for potential continued appreciation in its stock value.
In my analysis of General Dynamics Corporation (GD), I have meticulously calculated key financial metrics that are pivotal in assessing the company's performance and attractiveness as an investment. The Return on Capital (ROC) for General Dynamics stands at 11.712283412426885 percent. This figure is indicative of how efficiently the company converts its capital into profits; a higher ROC suggests that the company is using its capital effectively to generate returns for its investors. In General Dynamics case, an ROC of over 11% demonstrates a commendable level of operational efficiency and profitability, which is generally seen positively by investors.
Additionally, the Earnings Yield for General Dynamics has been calculated at 4.570352941176471 percent. Earnings yield is essentially the inverse of the Price-to-Earnings (P/E) ratio and offers insight into the relative value of a company's shares. A higher earnings yield indicates that an investor is paying less for each dollar of a company's earnings, making it a potentially more attractive investment. With an earnings yield of approximately 4.57%, General Dynamics presents itself as a company that offers a reasonable balance between its market price and earnings, suggesting that it could be an appealing option for investors looking for value in the defense sector.
In conclusion, the ROC and earnings yield metrics for General Dynamics reveal a company that not only utilizes its capital efficiently to generate profits but also maintains a balance between price and performance from an investor's perspective. These insights should prove valuable in making informed decisions regarding the inclusion of General Dynamics in an investment portfolio.
Summary of General Dynamics Corporation (GD) Financial Metrics and Stock Performance:
Key Financial Ratios (Based on Recent Data):
- P/E Ratio: 22.23
- P/B Ratio: 1.41
- Debt-to-Equity Ratio: 0.57
- Current Ratio: 1.37
- Quick Ratio: 1.37
- Industry P/E Ratio: 18.32
Dividend History Analysis:
- General Dynamics Corporation has consistently paid dividends, with noticeable incremental increases over several reporting periods. For instance, starting from an adjusted dividend of $0.62 in January 2015, the dividend payout has risen steadily to $1.32 by January 2024. This pattern reflects the company's strong commitment to returning value to shareholders and its financial robustness to sustain such payments.
Financial Performance Overview:
-
Earnings Growth: General Dynamics Corporation has demonstrated consistent earnings growth, crucial for long-term investment considerations.
-
Profitability and Efficiency: The company's current and quick ratios signify a healthy liquidity position, capable of meeting short-term obligations. A relatively low debt-to-equity ratio indicates a manageable level of debt, which is essential for stability and growth.
-
Valuation Metrics: The company's P/E ratio is slightly above the industry average, which could indicate that the stock is slightly overvalued compared to its peers, or it might reflect investors' confidence in GD's future growth prospects. The P/B ratio aligns with Benjamin Graham's principles of value investing, potentially indicating that the stock is reasonably valued in terms of its book value.
Conclusion and Recommendation:
General Dynamics Corporation shows solid financial health, with consistent dividend payments that have gradually increased, reflecting its commitment to shareholder values. The company maintains a strong liquidity position, manageable debt levels, and demonstrates steady earnings growth. However, the P/E ratio being slightly above the industry average warrants careful consideration; it might suggest the stock is somewhat overpriced or alternatively could hint at market confidence in its future growth trajectory.
Given these factors, GD could be a favorable option for investors seeking a mix of growth and stability, with a noteworthy emphasis on those prioritizing dividend income. Potential investors are advised to consider their investment strategy, risk tolerance, and the broader market conditions when evaluating GD's suitability for their portfolio.
| Statistic Name | Statistic Value |
| R-squared | 0.440 |
| Adjusted R-squared | 0.439 |
| F-statistic | 985.4 |
| Prob (F-statistic) | 4.02e-160 |
| Log-Likelihood | -1999.4 |
| No. Observations | 1257 |
| AIC | 4003. |
| BIC | 4013. |
| coef (const) | 0.0061 |
| coef (0) | 0.7989 |
| std err (const) | 0.034 |
| std err (0) | 0.025 |
| t (const) | 0.180 |
| t (0) | 31.391 |
| P>|t| (const) | 0.857 |
| P>|t| (0) | 0.000 |
| [0.025 (const) | -0.060 |
| 0.975] (const) | 0.072 |
| [0.025 (0) | 0.749 |
| 0.975] (0) | 0.849 |
| Omnibus | 133.284 |
| Prob(Omnibus) | 0.000 |
| Jarque-Bera (JB) | 827.143 |
| Skew | 0.255 |
| Prob(JB) | 2.44e-180 |
| Kurtosis | 6.941 |
| Cond. No. | 1.32 |
In evaluating the linear regression model between GD (General Dynamics) and SPY (which represents the overall market), one of the key insights is the value of alpha (), calculated here as approximately 0.0061. This number indicates the intercept of the regression line, or more plainly, the expected return of GD when SPY's return is zero. Given that the alpha value is positive, it suggests that GD is expected to generate a slight positive return independent of the market's movements, although the statistical significance of this alpha, as indicated by its P>|t| value of 0.857, suggests that this intercept is not highly reliable for predictions.
The beta () coefficient of GD relative to SPY is another critical parameter, found to be around 0.7989. This implies that for every one percent change in the SPY's return, GD's return is expected to change by roughly 0.7989 percent in the same direction, indicating that GD moves in the same direction as, but less volatile than, the market. The model's R-squared value of 0.440 reveals that approximately 44% of the variations in GD's returns are explained by movements in SPY, emphasizing a moderately strong correlation between GD and the overall market performance. However, with the given alpha's low statistical significance, the predictive power of this model primarily hinges on the relationship defined by beta rather than alpha.
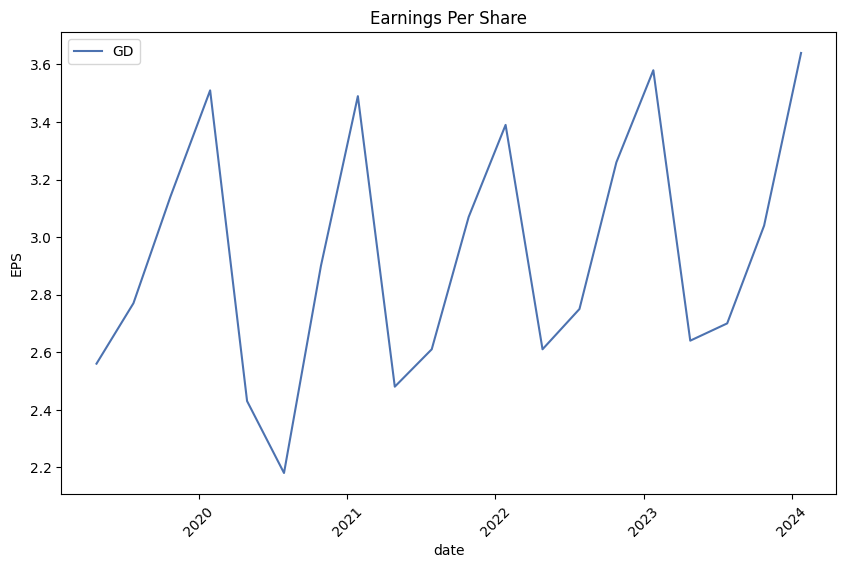
General Dynamics Corporation (GD) held its fourth quarter and full-year 2023 earnings conference call, providing insights into its financial performance and future outlook. During the call, Phebe Novakovic, the Chairman and CEO, reported a strong financial performance for the quarter, showcasing an increase in earnings per diluted share to $3.64, with revenues soaring to $11.668 billion. This marked a substantial revenue increase of $817 million (7.5%) compared to the fourth quarter of the previous year, and operating earnings saw a $61 million rise. The quarter's results exhibited considerable growth, especially in revenue and operating earnings, continuing a trend of sequential improvement throughout the year. Despite missing consensus expectations slightly due to delays in Gulfstream G700 certifications, the year wrapped up with robust order activity, leading to a total backlog of $93.6 billion.
Chief Financial Officer, Jason Aiken, provided detailed financial metrics, highlighting strong cash performance and significant order activity across the business segments. The aerospace segment led with a 1.2 to 1 book-to-bill ratio, ending the year with a backlog of $20.5 billion. The defense segments showcased steady performance with a book-to-bill ratio of 0.7 times in Q4 and one-to-one for the full year. Total operating cash flow for the year was noted at $4.7 billion, with free cash flow of $3.8 billion after capital expenditures, demonstrating the company's solid financial health. Despite challenges, such as delayed G700 certification, the company anticipated capital expenditures between 2% to 2.5% of sales for the following year and maintained a net debt position of $7.3 billion by year-end.
Novakovic elaborated on the aerospace sector's significant achievements and challenges. Despite the delayed certification of the G700 impacting deliveries, aerospace revenues increased to $2.74 billion in the quarter, with operating earnings up 33%. Looking forward, the company anticipates substantial growth in aerospace, with revenue expectations of about $12 billion in 2024, approximately 40% higher than 2023. This is anticipated despite supply chain issues and impacts from geopolitical events, such as the conflict in Gaza affecting deliveries of the G280 model. The combat systems and marine segments were also highlighted, showcasing robust growth and strong order activity, particularly in response to increased demand and programs expanding production volumes.
In summary, General Dynamics presented a solid financial outlook for 2024, driven by continued demand across its business segments and proactive operational strategies to address supply chain challenges. With ambitious revenue growth projections of approximately 9.5%, translating to around $46.3 to $46.4 billion, and an aim for an operating margin of 11%, the company is poised for strong performance. Despite facing supply chain issues and delays in certain aircraft certifications, General Dynamics remains focused on executing its strategic plans to ensure sustained growth and margin improvement.
udgments and estimates associated with revenue recognition on long-term contracts, customer claims and requests for equitable adjustment, pension and other post-retirement benefit plan assumptions, valuation of goodwill and definite-lived intangible assets, environmental liabilities, and litigation and other contingencies have the greatest potential impact on our financial statements. Therefore, we consider these to be our critical accounting policies and estimates.
Revenue recognition on long-term contracts can significantly affect our financial results. Our contracts often span multiple years, and revenue recognition involves estimating the total revenue and cost of a contract. Changes in these estimates can affect the profitability of our contracts. Similarly, customer claims and requests for equitable adjustment involve judgment to determine the potential impact on contract value and revenue. Adjustments in contract estimates are recognized under the cumulative catch-up method, meaning the impact of the adjustment on profit recorded to date on a contract is recognized in the period the adjustment is identified.
Pension and other post-retirement benefit plans are influenced by assumptions including discount rates, expected return on plan assets, and health care cost trend rates. Changes in these assumptions can have a significant effect on the amounts reported in our financial statements. For example, a change in the discount rate used to measure pension obligations can result in a significant increase or decrease in the pension liability reported.
Valuation of goodwill and definite-lived intangible assets involves assessing whether these assets are impaired. This requires judgment in determining the fair value of the reporting units and whether it is less than the carrying amount. Any impairment identified must be recorded, which can impact our financial results.
Environmental liabilities and the related provision require judgment in the estimation of the timing and amount of costs to be incurred. These estimates are based on an ongoing assessment of historical cleanup costs, the particular characteristics of each site, existing technology, laws and regulations, and under the perspective of an ongoing and responsible management attitude towards these matters.
Lastly, litigation and other contingencies require us to make judgments about the potential outcome of various legal and tax proceedings. We recognize liabilities for these matters when a loss is considered probable and the amount can be reasonably estimated.
The specific impacts of these critical accounting policies and estimates on our financial statements can greatly depend on future events, changes in market conditions, or changes in the regulatory environment, among other factors. We continually review our estimates and assumptions to ensure they reflect current conditions and any new information that becomes available. Updates to our judgments and estimates could have a material effect on our results of operations and financial condition in future periods.
General Dynamics Corporation (GD) experienced notable financial and operational achievements in the fourth quarter of 2023, distinguishing itself within the defense and aerospace industry. Amid a complex global geopolitical scenario characterized by increasing tensions and a rising demand for defense capabilities, GDs performance stands out, particularly due to its significant contracts and growth in key business areas such as combat systems, marine systems, and aerospace.
In the combat systems domain, General Dynamics' capabilities are underscored by the heightened global demand for its Abrams main battle tanks. The company's capacity to leverage international markets, evidenced by a 13% revenue increase in this segment for the year, speaks volumes about its strategic positioning and operational efficiency. The combat systems segment, notably facilitating international defense needs, showcases GD's adaptability to global demands while contributing substantially to its revenue stream.
The marine systems segment experienced robust growth, driven by significant contracts with the Navy for submarine and shipbuilding. These contracts not only highlight General Dynamics' expertise in naval systems but also its pivotal role in supporting the strategic capabilities of the U.S. Navy. Challenges such as supply chain disruptions and vendor quality control issues were navigated with strategic foresight, ensuring continued progress and operational integrity in this critical defense sector.
Aerospace, particularly through the performance of Gulfstream aircraft, remains a cornerstone of General Dynamics' portfolio. Despite the delayed certification of the Gulfstream G700, the companys resilience is evident in its robust backlog and the enduring demand for its aircraft. The anticipation for this segment's significant revenue and margin increase in 2024, driven by expected increased deliveries, underscores the strategic importance of the aerospace sector to GD's overall business strategy.
The acquisition of CSRA has notably fortified General Dynamics IT solutions portfolio, addressing advanced technological needs like cybersecurity for U.S. government clients. This strategic move not only diversifies GD's service offerings but also opens up avenues for growth through cross-selling opportunities in the ever-important domain of government IT services.
Looking ahead, General Dynamics is poised for continued growth across its diverse portfolio. The company's optimistic outlook for 2024, with a focus on aerospace revenue increase and margin growth, is supported by a strategic emphasis on operational execution and margin improvement. GD's ability to navigate the complexities of the defense and aerospace market, combined with its strategic acquisitions and a strong contract backlog, offers a robust foundation for sustainable growth and shareholder value enhancement.
In the broader context, General Dynamics' performance and strategic positioning reflect a deep understanding of the evolving defense landscape and the importance of maintaining a diversified and technologically advanced portfolio. The company's commitment to operational excellence, strategic growth initiatives, and shareholder value, coupled with its anticipation of market needs and global defense trends, positions it as a notable entity in the defense and aerospace industry. With a positive outlook and strategic focus areas identified for 2024, General Dynamics continues to demonstrate its ability to thrive amidst challenges and seize opportunities for growth and innovation.
General Dynamics Corporation (GD) exhibited notable volatility from 2019 to 2024, as indicated by statistical analysis. The ARCH model, which is a method used to understand and predict financial market volatilities, reveals that the company's asset returns fluctuate significantly, showing a tendency for returns to vary in a way that's unpredictable based on past variances alone. Key features of this volatility include a coefficient (omega) at 1.5672, suggesting a base level of volatility in the market, and an alpha[1] value of 0.3594, indicating the impact of past returns on current volatility is significant, highlighting the reactive nature of the stock's movements to its own historical performance.
| Statistic Name | Statistic Value |
|---|---|
| Log-Likelihood | -2255.33 |
| AIC | 4514.65 |
| BIC | 4524.93 |
| omega | 1.5672 |
| alpha[1] | 0.3594 |
To assess the financial risk associated with a $10,000 investment in General Dynamics Corporation (GD) over a one-year period, an integrated approach combining volatility modeling with machine learning predictions was adopted. This dual-faceted analysis not only captures the inherent price fluctuations of GD's stock but also forecasts future returns, offering a comprehensive view of potential investment risks.
Volatility modeling, commonly associated with the GARCH (Generalized Autoregressive Conditional Heteroskedasticity) method, plays a pivotal role in understanding the dynamic nature of stock volatility. By examining General Dynamics Corporation's historical price data, the volatility model can estimate the level of risk associated with the stock's returns. This model captures the clustering of volatility, a characteristic feature of financial time series data, indicating periods of high and low volatility that are fundamental to assessing investment risk.
On the other hand, the machine learning predictions facet utilizes the RandomForest algorithm, a type of ensemble learning method, to forecast future stock returns based on historical data. By analyzing patterns in the past performance of GD's stock, the machine learning model can predict the direction of future returns with a certain degree of accuracy. Combining these predictions with the volatility model allows for a nuanced understanding of both the expected returns and the risks involved.
The calculated Annual Value at Risk (VaR) at a 95% confidence interval for the $10,000 investment in General Dynamics Corporation is $181.12. This VaR metric encapsulates the potential loss in value of the investment, under normal trading conditions, with a 95% certainty. Essentially, it suggests that there is only a 5% chance that the investment will lose more than $181.12 over the one-year period. This quantification of risk is pivotal in providing investors with a clear benchmark of potential financial exposure.
By interlinking volatility modeling with machine learning predictions, this analysis not only identifies the inherent price volatility of General Dynamics Corporation's stock but also offers insight into how future returns might behave. Through the lens of sophisticated analytical tools, investors are equipped with a detailed understanding of the risks associated with their investment, guided by both historical volatility patterns and predictive analytics. The computed VaR further solidifies this analysis by quantifying the maximal potential loss, thereby presenting a critical parameter for informed investment decision-making.
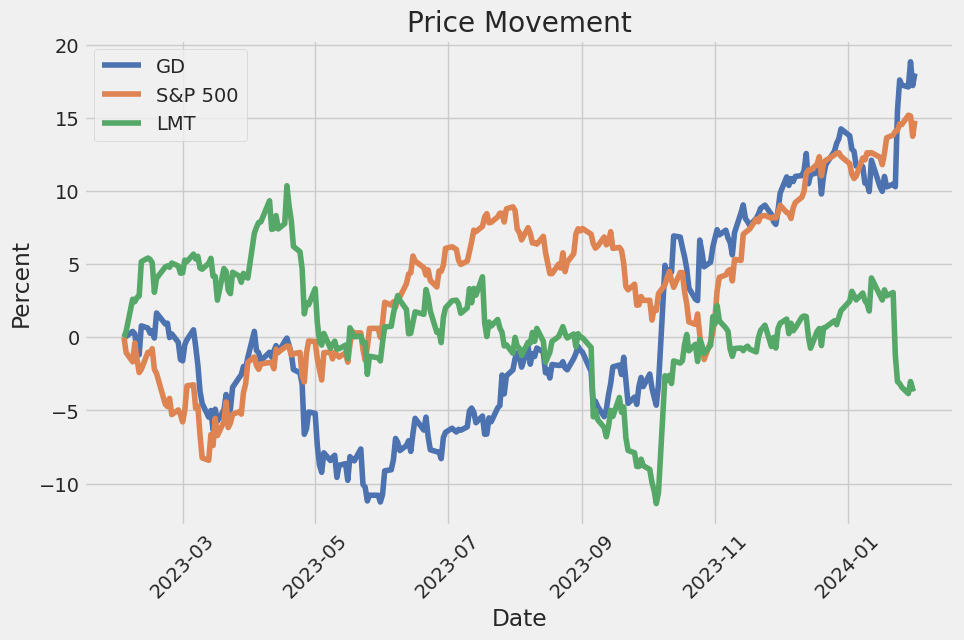
Similar Companies in Aerospace & Defense:
Lockheed Martin Corporation (LMT), Raytheon Technologies Corporation (RTX), L3Harris Technologies, Inc. (LHX), Huntington Ingalls Industries, Inc. (HII), Northrop Grumman Corporation (NOC), The Boeing Company (BA), Curtiss-Wright Corporation (CW), Hexcel Corporation (HXL), Textron Inc. (TXT)
https://seekingalpha.com/article/4664690-general-dynamics-gd-q4-2023-earnings-call-transcript
https://finance.yahoo.com/news/q4-2023-general-dynamics-corp-040440493.html
https://finance.yahoo.com/news/company-news-jan-25-2024-142500294.html
https://finance.yahoo.com/news/growth-investor-1-stock-could-144507058.html
https://finance.yahoo.com/news/general-dynamics-corporation-nyse-gd-144559519.html
https://finance.yahoo.com/m/d460801e-d276-3eec-9052-0455f3712b9d/booz-allen-breaks-out%2C.html
https://finance.yahoo.com/news/general-dynamics-ceo-speak-cowen-220000903.html
https://finance.yahoo.com/news/15-navies-most-submarines-world-230237301.html
https://www.sec.gov/Archives/edgar/data/40533/000004053323000070/gd-20231001.htm
Copyright © 2024 Tiny Computers (email@tinycomputers.io)
Report ID: eb6ql3A
Cost: $1.15803