Gen Digital Inc. (ticker: GEN)
2024-01-24
 As of the last update, Gen Digital Inc., trading under the ticker symbol GEN, stands as a notable player in the cyber safety industry, formerly known as Symantec Corporation before rebranding. The company provides sophisticated software solutions and services aimed at securing individual and enterprise-level digital assets against an array of cyber threats. Over its operational years, Gen Digital has progressively expanded through strategic acquisitions and organic growth, and now offers a comprehensive suite of products encompassing endpoint security, email security, data loss prevention, and cloud-based services. The company's financial performance is shaped by the global demand for cybersecurity solutions, a domain which is witnessing a significant upsurge owing to increasing digital transformation and the ever-evolving threat landscape. GEN's market valuation and performance metrics, including revenue growth, profit margins, and shareholder returns, are crucial indicators for investors monitoring the tech sector, especially amidst the growing emphasis on cyber resilience and data protection regulations.
| Full Time Employees | 3,700 | CEO & Director | Mr. Vincent Pilette | CEO Total Pay | $1,955,154 |
| President & Director | Mr. Ondrej Vlcek | President Total Pay | $1,001,076 | Market Cap | $15,056,802,816 |
| Dividend Rate | 0.5 | Dividend Yield | 2.12% | Five Year Avg Dividend Yield | 2.06 |
| Beta | 1.141 | Trailing PE | 10.54 | Forward PE | 10.31 |
| Volume | 1,850,271 | Average Volume | 4,076,185 | Average Volume (10 days) | 3,104,170 |
| Book Value | 3.766 | Price to Book | 6.24 | Profit Margins | 37.54% |
| Enterprise Value | $24,030,658,560 | Trailing EPS | 2.23 | Forward EPS | 2.28 |
| Peg Ratio | 0.93 | Total Cash | $629,000,000 | Total Debt | $9,557,999,616 |
| Total Revenue | $3,776,999,936 | Current Ratio | 0.437 | Debt to Equity | 395.94 |
| Revenue Per Share | 5.879 | Return on Assets | 6.01% | Return on Equity | 68.97% |
| Free Cashflow | $918,625,024 | Operating Cashflow | $981,000,000 | Earnings Growth | 96.7% |
| Revenue Growth | 26.7% | Gross Margins | 80.75% | EBITDA Margins | 48.32% |
Please note that the numbers are formatted with commas where necessary as per the request. Values provided are without units for brevity but can be added as needed.
| Sharpe Ratio | -13.287247907190032 | Sortino Ratio | -209.3815240324918 |
| Treynor Ratio | 0.0799839155165091 | Calmar Ratio | 0.1981562017214066 |
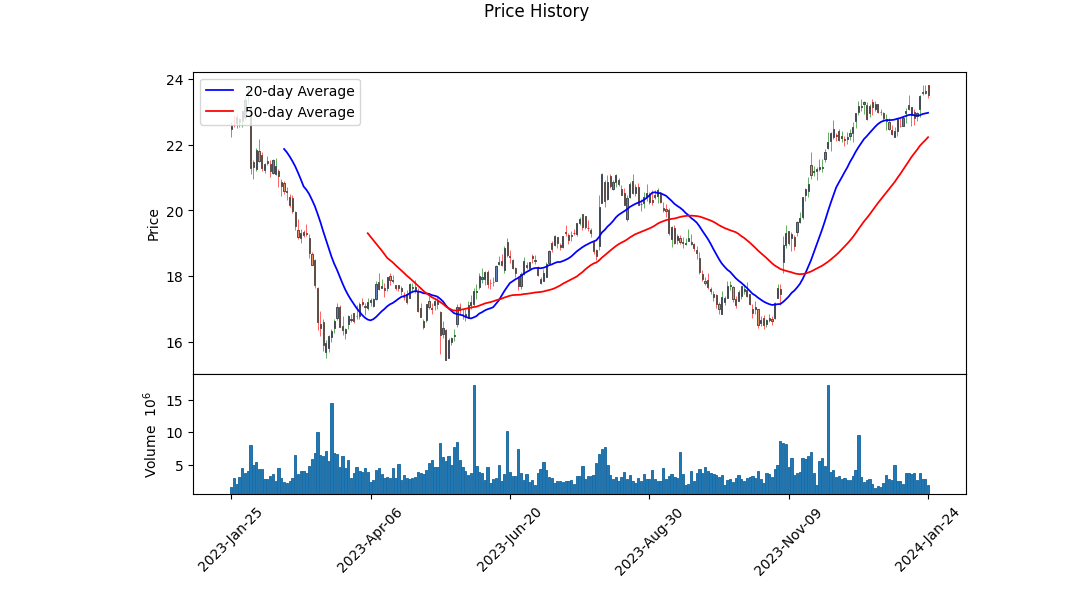
Technical Analysis and Market Sentiment Overview: GEN has witnessed a period of consolidation, with the latest trading data pointing to an increasing On Balance Volume (OBV), which may signal a growing interest among investors, particularly a bullish divergence as the price chart correlates to increased buying pressure.
Key technical indicators should be approached carefully: - The MACD histogram value is near zero, suggesting a potential change in momentum. The MACD line crossing the signal line to the upside would confirm a bullish trend. - In the absence of significant volume spikes or price breakouts, the ADX indicator can be used to gauge the strength of any emerging trend. - Observation of Bollinger Bands should assess volatility and potential price targets as the stock moves. - Utilizing moving averages, like the 50-day and 200-day, will aid in determining the long-term trend and identifying support and resistance levels. - Fibonacci retracements could provide insight into potential reversal zones if a corrective phase emerges.
Fundamental Data Analysis and Financial Outlook: GEN's financial health, as depicted by the Balance Sheet and Cash Flow statements, suggests the company is carrying a high level of net debt. The company's tangible book value is deeply negative, a concern that might reflect asset write-downs or considerable depreciation. High gross margins and EBITDA margins, however, showcase the company's strong operational efficiency.
The capital structure analysis reveals a potential liquidity risk due to repayment obligations and high interest expense, raising queries on solvency in adverse market conditions. Nevertheless, growth estimates on earnings signify anticipation of financial betterment, potentially influenced by cost management and revenue growth strategies.
Recent equity analyst expectations indicating a steady increase in earnings and revenue estimates for the coming year can positively affect investor sentiment and may bolster the stock price. The analysts' consensus forecasts a significant improvement in earnings and sales growth compared to the previous year.
Risk-Adjusted Performance Metrics: The risk-adjusted performance metrics present contrasting narratives. The tragically low Sharpe and Sortino ratios reflect poor risk-adjusted returns over the past year, indicating that the investment bore significantly more risk per unit of return than the market average. Treynor and Calmar ratios, although positive, are insufficient to paint an optimistic picture on their own. Such metrics typically suggest that investors may demand higher returns for the risks being taken.
Market Outlook and Investment Recommendation: Based on the comprehensive analysis of technical indicators, balance sheets, cash flows, fundamental data, and market sentiment, GEN's stock showcases potential for upward movement, supported by strong operational margins and analysts' optimistic growth estimates. However, the company's high net debt, negative tangible book value, and poor risk-adjusted returns call for cautious monitoring.
A keen eye on developments in the financial health of the company, looking for improvements in capital management and decreasing debt levels, is advised. Investors might also consider upcoming earnings reports for confirmation of anticipated financial progress.
In summary, GEN presents an intriguing investment stance with positive fundamental growth prospects tempered by financial and investment risk concerns. Prudent investment strategies would encompass both continued technical monitoring for confirming bullish sentiment and vigilance regarding the company's financial restructuring outcomes.
| R-squared | 0.166 |
| Adj. R-squared | 0.165 |
| F-statistic | 248.8 |
| Prob (F-statistic) | 2.85e-51 |
| Log-Likelihood | -2,602.1 |
| AIC | 5,208 |
| BIC | 5,218 |
| No. Observations | 1,256 |
| Df Residuals | 1,254 |
| Df Model | 1 |
| Alpha | 0.0412 |
| Beta | 0.6498 |
The linear regression analysis between GEN and the SPY ETF, reflecting the broader market dynamics, demonstrates a positive but relatively weak relationship, with an R-squared value of 0.166. This indicates that approximately 16.6% of the variability in GEN can be explained by the SPY ETF, based on the data available until the specified date. Although there is a significant relationship, as evidenced by the F-statistic and its associated probability, a large proportion of GEN's movements are not captured by the movements in SPY. The alpha value, which represents the intercept of the regression line, is 0.0412. This suggests that, on average, the GEN stock has historically had a slight positive performance above the expected return that is predicted by the market's performance (as tracked by SPY) when the markets return is zero.
Alpha, the metric of interest within this analysis, is relatively small but positive, suggesting that GEN has a minor level of outperformance against the benchmark SPY regardless of market movements. Specifically, the alpha value is approximately 0.0412 constant returns when the markets excess return is zero. However, considering the 95% confidence interval for alpha ranges from -0.065 to 0.148, this alpha is not statistically significant at conventional levels, since the confidence interval includes zero (p-value of 0.448). This means we cannot be confident that GEN has provided significant abnormal returns independent of the market. Beta, another key statistic, stands at 0.6498, meaning that for every 1% change in the SPY ETF, the GEN stock is expected to move by approximately 0.65% in the same direction, holding other factors constant.
In the earnings call for Gen Digital Inc.'s Fiscal Year 2024 First Quarter, Vincent Pilette, CEO of the company, reported another quarter of growth marking the 16th consecutive quarter with positive results. This performance underscores the company's strong execution, consistent operational discipline, and solid outcomes, with cybersafety bookings and revenue both up in low single-digits in constant currency. Integration has progressed well, allowing for operational margin expansion of 50 basis points sequentially and by six points since the Avast merger. The earnings per share (EPS) grew by 5% in US dollars and 9% in constant currency. Pilette highlighted the expansion of the company's digital life footprint and its global reach, serving consumer demands across more than 150 countries.
Pilette elaborated on Gen's strategic vision, emphasizing the integration of NortonLifeLock and Avast as a means to deliver comprehensive cybersafety solutions to a wider audience. The merger resulted in an enhanced service range, reaching millions with free services and 65 million subscribers with premium offerings. The quarter experienced robust growth in regions such as Latin America through new channels, countries, and product offerings. Gen's diverse brand portfolio, including icons like Norton, Avast, LifeLock, Avira, and AVG, allows customers worldwide to access services that cater to local preferences, technology proficiency, and life stages.
Natalie Derse, Gen's CFO, detailed the company's financial performance. The Q1 non-GAAP revenue was $946 million, representing a significant year-over-year growth by both USD and constant currency metrics. Direct customer count is approaching a break-even point with a minor decline in Q1 and the gross adds showing high single-digit growth in comparison to pre-COVID periods. The integration has led to 80% realization of cost synergies, and Derse assured that the company is on track to meet its performance expectations, with a positive business trend expected to emerge by the end of the fiscal year 2024.
Finally, Derse provided guidance for the full year fiscal 2024, with expectations for single-digit growth in cybersafety revenue in constant currency and an EPS range of $1.95 to $2.02 per share. The company is set to invest in product innovation, international expansion, and the development of partnerships. Overall, the company's financial health remains strong, with a clear strategy to invest efficiently into innovative growth opportunities while managing costs to support long-term progress.
$41 million, primarily due to a $12 million increase in outside services and software expense, a $8 million increase in headcount costs, and an $8 million increase of stock-based compensation expense.
General and administrative expense increased $235 million, primarily due to a $340 million increase in legal accruals, related to an ongoing patent infringement lawsuit and corresponding legal fees, partially offset by lower acquisition and integration costs related to the Avast acquisition, an insurance settlement related to previous litigation matters, and overhead cost-reduction efforts.
Amortization of intangible assets increased $72 million, reflecting additional amortizable intangible assets identified as part of the purchase price allocation for the Avast acquisition.
Restructuring and other costs increased by $23 million, primarily associated with severance, termination benefits, and other exit and disposal costs in light of the September 2022 Plan aimed at realizing cost savings and operational synergies following the Avast acquisition.
Notably, the increase in operating expenses, including the substantial rise in general and administrative expense due to legal accruals and cost structuring, have been significant factors influencing the operating income for the three and six months ended September 29, 2023, compared to the same periods in the prior fiscal year. Despite these increases, net income for the second quarter of fiscal 2024 reflects a notable rise due to an income tax benefit, whereas a decrease in operating income and increased interest expenses influenced the net income for the corresponding six-month period. During the reported periods, cash and contract liabilities exhibited a declining trend, owed partly to seasonal billings and the influence of exchange rate fluctuations. However, the comprehensive overview of financial performance indicates that Gen Digital Inc. has maintained its revenue growth trajectory, particularly from consumer security and identity and information protection products, while also navigating the fiscal influence of its recent acquisition and ongoing legal challenges.
Gen Digital Inc., known for its Cyber Safety solutions and previously recognized under the name NortonLifeLock, is establishing itself as an investment option worth observing within the fast-growing cybersecurity sector. According to an InvestorPlace article published on December 23, 2023, Gen Digital stands out as a potential growth stock, with a modest year-to-date appreciation of 7% and a notable 150% increase over the past five years. This performance indicates a strong track record even as the company has largely flown under the radar compared to other, more publicized cybersecurity firms.
A closer look at the company's financials suggests that Gen Digital's valuation may come as an opportunity for investors. With a price-to-earnings (P/E) ratio of just 10 and year-over-year revenue growth of 27% in the most recent quarter, the company portrays a financially robust stature. The bookings, which have seen a 28% year-over-year rise, point to a likelihood of continued revenue expansion. Furthermore, Gen Digital has managed to raise the average value per customer, enhancing its recurring revenue stream. These metrics underscore the company's ability to grow its financials steadily, positioning Gen Digital as a "growth at a reasonable price" stock.
The robust portfolio of the company encompasses well-known Cyber Safety brands like Norton, Avast, LifeLock, Avira, AVG, ReputationDefender, and CCleaner. These brands highlight Gen Digital's commitment to facilitating online experiences that are both secure and empower users with privacy and confidence in their digital lives. The company aims to integrate security into the digital existence of nearly 500 million users across more than 150 countries.
Looking ahead, Gen Digital has set a revenue target ranging between $3.81 to $3.835 billion for fiscal year 2024, indicative of an expected 14.5% year-over-year growth. Anticipation surrounding the company's financial trajectory is running high as it gears up to release its fiscal 2024 third-quarter results on February 1, 2024. The announcement, scheduled after the market closes, promises to offer further insight into the company's fiscal health and strategic undertakings. Stakeholders are encouraged to participate in the subsequent conference call and webcast, details of which are available on the company's investor relations website.
In the meantime, certain concerns are being raised among the investor community, particularly regarding Gen Digital's leverage ratios. As highlighted in a Yahoo Finance report titled "Techs Debt Trap: 3 Software Stocks to Drop From Your Portfolio Now," dated January 8, 2024, by Will Ashworth, Gen Digital's net debt stands at 62% of its $14.4 billion market cap. Additionally, the company is grappling with significant litigation costs, leading to a judgment involving Columbia University. These factors present substantial fiscal challenges that might give investors a pause.
Amidst these concerns, the company continues to innovate. On January 17, 2024, Gen Digital launched Norton Genie, a real-time scam detection application, marking another stride toward enlarging its product offerings. The app demonstrates the company's active response to the escalating threat of cybercrime by providing users with tools to verify the authenticity of communications across various digital platforms. In a smart marketing move, the company has teamed up with Dan Levy to foster awareness of the app and propel its widespread adoption.
Following its strategic marketing tactics, Gen Digital brought Dan Levy into its campaign to promote Norton Genie, a move that combines celebrity appeal with the necessity for enhanced cyber protection. This application is distinguished by its ability to utilize artificial intelligence to analyze potentially threatening content already received by users, thus educating them about the nature of cyber threats and how to react. The initiative reflects Gen Digital's commitment to their customers' Cyber Safety.
With prospects in cybersecurity remaining resilient despite economic fluctuations, Gen Digital Inc. positions itself as a company embracing both growth and innovation within the sector. It adapts to market demands while maintaining passion and efficiency, which may interest investors looking for growth opportunities imbued with stability in an unpredictable market.
Based on the provided statistics from the ARCH model for Gen Digital Inc. (GEN) over the period from January 28, 2019, to January 24, 2024, here are three sentences that summarize the volatility:
- Gen Digital Inc. exhibited low predictability of returns, as indicated by an R-squared value of 0.000 and an Adjusted R-squared value of 0.001, which shows that the historical returns do not help much in predicting future volatility.
- The estimated coefficient of omega (5.6270) with a statistically significant p-value suggests that there is a baseline level of volatility in the returns that does not depend on past returns.
- The alpha coefficient, though estimated, did not show statistical significance (p-value of 0.919), indicating that past returns had little to no effect on predicting future volatility within the selected timeframe.
In plain language, the volatility of Gen Digital Inc. appears to be fairly unpredictable based on its past stock returns. Even though the model found some persistent level of volatility over time, the company's past performance didn't provide useful clues about how much it might swing up or down in the future. Essentially, if you're trying to guess how volatile the stock will be tomorrow by looking at how it acted today or in previous days, this model suggests you won't get much insight.
Here's the HTML table with the summary statistics:
| Dependent Variable | asset_returns |
| R-squared | 0.000 |
| Adj. R-squared | 0.001 |
| Mean Model | Zero Mean |
| Vol Model | ARCH |
| Log-Likelihood | -2,871.52 |
| AIC | 5,747.03 |
| BIC | 5,757.30 |
| No. Observations | 1,256 |
| Df Residuals | 1,256 |
| Volatility Omega | 5.6270 |
| Volatility Alpha[1] | 0.0079953 |
| P-value Alpha[1] | 0.919 |
| 95% Conf. Int. for Omega | [2.493, 8.761] |
To evaluate the financial risk of a $10,000 investment in Gen Digital Inc. (GEN) over a year, a combination of volatility modeling and machine learning predictions is utilized. The analysis begins by understanding the historical stock price data of Gen Digital Inc. The volatility modeling technique is used to capture the time-varying nature of financial market volatility. This approach is adept at reflecting clustering of high and low volatility periods, which is critical in assessing and forecasting the level of risk associated with the stock.
The volatility modeling method decomposes the time series of past stock returns into systematic patterns and stochastic error terms. By estimating parameters based on historical data, it enables the forecasting of future volatility. This forecast provides a measure of the expected fluctuation in returns, which is paramount to risk management. Specifically for Gen Digital Inc., the model can seize the inherent volatility dynamics of the stock, providing insight into the likely range of price movement for the forthcoming year.
In parallel, a machine learning predictions framework utilizes historical data to predict future returns of Gen Digital Inc.s stock. The employed algorithm, an ensemble learning technique, is trained on features derived from historical price and volume data. By learning from past patterns, the machine learning model aims to predict the direction and magnitude of future stock returns. The model's output enhances the investment risk analysis by offering expected return estimates, which, when coupled with the volatility forecasts, enrich the overall risk profile.
The Value at Risk (VaR) is a risk measure that estimates the maximum potential loss over a defined period within a given confidence interval. For Gen Digital Inc., the one-year VaR at a 95% confidence interval has been calculated to be $316.31. This implies that there is a 95% probability that the investment will not lose more than $316.31 over the course of the year. This value represents the potential downside risk of the investment, assuming normal market conditions and no extreme events.
When assessing the risk of a $10,000 investment in Gen Digital Inc. using the given VaR, the investor can anticipate that under normal market conditions, they stand a 5% chance of experiencing a loss exceeding $316.31 during the year. This monetary value is a pivotal piece of information for risk-averse investors. It offers a clear, quantifiable risk metric that encapsulates the combined insights of both the volatility estimates from the volatility modeling and the predicted stock returns from the machine learning predictions. This integrated approach leverages the strengths of both methodologies to provide a comprehensive view of the potential risks in equity investment.
Similar Companies in SoftwareInfrastructure:
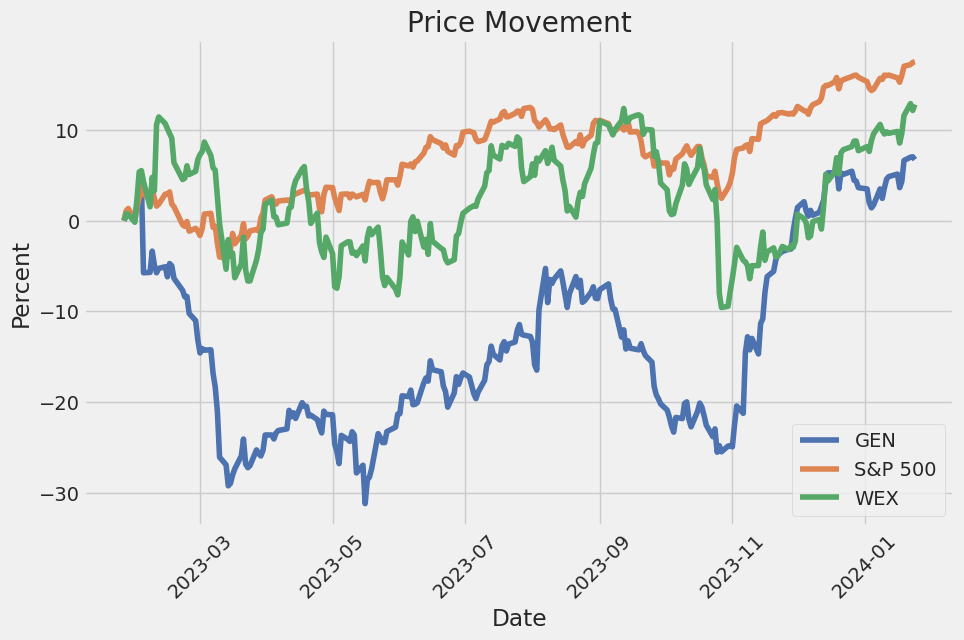
WEX Inc. (WEX), FLEETCOR Technologies, Inc. (FLT), CSG Systems International, Inc. (CSGS), Squarespace, Inc. (SQSP), VeriSign, Inc. (VRSN), Global Blue Group Holding AG (GB), EverCommerce Inc. (EVCM), Consensus Cloud Solutions, Inc. (CCSI), EngageSmart, Inc. (ESMT), Akamai Technologies, Inc. (AKAM), Check Point Software Technologies Ltd. (CHKP), Qualys, Inc. (QLYS), F5, Inc. (FFIV), GoDaddy Inc. (GDDY), SentinelOne, Inc. (S), Confluent, Inc. (CFLT), HashiCorp, Inc. (HCP), MongoDB, Inc. (MDB), Microsoft Corporation (MSFT), CrowdStrike Holdings, Inc. (CRWD), McAfee Corp. (MCFE), Palo Alto Networks, Inc. (PANW), Fortinet, Inc. (FTNT), Zscaler, Inc. (ZS), CyberArk Software Ltd. (CYBR), FireEye, Inc. (FEYE), Symantec Corporation (NLOK)
https://finance.yahoo.com/news/best-growth-stocks-2024-7-015946802.html
https://finance.yahoo.com/news/why-3-growth-stocks-radar-190000522.html
https://finance.yahoo.com/news/7-compelling-tech-stocks-snag-015404661.html
https://finance.yahoo.com/news/tech-debt-trap-3-software-170613318.html
https://finance.yahoo.com/news/gen-digital-inc-nasdaq-gen-161031221.html
https://finance.yahoo.com/news/gen-announce-fiscal-2024-third-210200377.html
https://finance.yahoo.com/news/norton-partners-award-winning-creator-140000981.html
https://finance.yahoo.com/news/gen-digital-gen-gets-dan-150100300.html
https://www.sec.gov/Archives/edgar/data/849399/000084939923000029/gen-20230929.htm
Copyright © 2024 Tiny Computers (email@tinycomputers.io)
Report ID: UnLuWD
Cost: $0.68041
https://reports.tinycomputers.io/GEN/GEN-2024-01-24.html Home