Corning Incorporated (ticker: GLW)
2024-05-21
 Corning Incorporated (ticker: GLW) is a diversified technology company renowned for its expertise in specialty glass, ceramics, and optical physics. Founded in 1851 and headquartered in Corning, New York, the company operates through several segments: Display Technologies, Optical Communications, Environmental Technologies, Specialty Materials, and Life Sciences. Corning's innovative products serve a wide range of industries, from consumer electronics and telecommunications to life sciences and automotive applications. The company is particularly noted for its development of Gorilla Glass, used in numerous mobile devices. With a robust research and development focus, Corning continues to drive advancements in material sciences. Consistent financial performance and strategic partnerships have bolstered its position as a leader in technological innovation.
| Total Employees | 49,800 | Previous Close | 35.52 | Open | 35.4 |
| Day's Low | 35.435 | Day's High | 36.2799 | Dividend Rate | 1.12 |
| Dividend Yield | 0.0315 | Five Year Avg Dividend Yield | 2.94 | Trailing PE | 50.090275 |
| Forward PE | 16.543577 | Volume | 4,709,014 | Average Volume | 4,679,830 |
| Market Cap | 30,893,963,264 | 52-Week Low | 25.26 | 52-Week High | 36.2799 |
| Price to Sales (TTM) | 2.494466 | 50-Day Average | 32.777 | 200-Day Average | 30.99585 |
| Trailing Annual Dividend Rate | 1.12 | Trailing Annual Dividend Yield | 0.03153153 | Enterprise Value | 37,686,116,352 |
| Profit Margins | 0.04958 | Float Shares | 772,833,296 | Shares Outstanding | 856,619,008 |
| Shares Short | 11,936,974 | Shares Short Prior Month | 11,520,811 | Book Value | 13.707 |
| Price to Book | 2.6311374 | Last Fiscal Year End | 1,703,980,800 | Next Fiscal Year End | 1,735,603,200 |
| Most Recent Quarter | 1,711,843,200 | Earnings Quarterly Growth | 0.188 | Net Income to Common | 614,000,000 |
| Trailing EPS | 0.72 | Forward EPS | 2.18 | PEG Ratio | 1.63 |
| Enterprise to Revenue | 3.043 | Enterprise to EBITDA | 14.221 | 52-Week Change | 0.15437114 |
| S&P 52-Week Change | 0.28043115 | Current Price | 36.065 | Target High Price | 40.0 |
| Target Low Price | 29.0 | Target Mean Price | 35.64 | Target Median Price | 36.0 |
| Total Cash | 1,364,999,936 | Total Debt | 8,290,999,808 | Total Revenue | 12,385,000,448 |
| Debt to Equity | 71.728 | Revenue per Share | 14.571 | Return on Assets | 0.02846 |
| Return on Equity | 0.057389997 | Free Cash Flow | 327,124,992 | Operating Cash Flow | 2,150,000,128 |
| Earnings Growth | 0.2 | Revenue Growth | -0.064 | Gross Margins | 0.33944 |
| EBITDA Margins | 0.21396999 | Operating Margins | 0.086389996 |
| Sharpe Ratio | 0.703644 | Sortino Ratio | 12.054389 |
| Treynor Ratio | 0.209931 | Calmar Ratio | 0.746135 |
Based on the provided technical indicators and the fundamental data, Corning Incorporated (GLW) showcases several promising aspects that could potentially drive the stock price higher in the coming months.
The recent trading data reveals a strong upward momentum with Corning's stock closing at $36.2799 on the last trading day. The On-Balance Volume (OBV) also indicates increasing buying pressure, escalating from 0.527620 million shares on January 22 to 4.621317 million shares on May 21. This reflects significant accumulation, which typically precedes price increases. The MACD histogram, which remains positive at 0.217880, further confirms the bullish trend.
Fundamentally, Corning exhibits solid growth and profitability. The trailing PEG ratio of 1.3383, though slightly above 1, is still within a reasonable range, indicating that the stock may still offer growth at a reasonable price. EBIT margins of 0.08639 and EBITDA margins of 0.21397 suggest operational efficiency and viability. Additionally, a gross margin of 0.33944 showcases effective cost management, enabling substantial profit retention.
Analyzing the ratios provided, the Sharpe Ratio stands at 0.703644, which indicates an acceptable level of risk-adjusted return, given the stock's volatility. The Sortino Ratio of 12.054389 is notably high, suggesting that the downside risk is minimal, which is a positive indicator for potential investors concentrating on lower-risk investments. The Treynor Ratio and Calmar Ratio, valued at 0.209931 and 0.746135 respectively, also reflect favorable risk-adjusted performance relative to both market and drawdowns.
Trajectory-wise, Cornings strong balance sheet supports sustainable growth. With significant working capital of $2.796 billion, total assets amounting to $27.618 billion, and retained earnings of $16.358 billion, Corning is well-capitalized to fund its operations and pursue strategic initiatives. Despite a slightly negative EBIT, which reflects recent challenges or investments impacting short-term performance, the underlying fundamentals remain robust.
Corning's financials illustrate a significant rise in revenue to $12.588 billion, compared to previous periods. This coupled with solid net income ($648 million) from continuing operations, underscores a recovering and expanding business. The company's debt levels are manageable, with net debt standing at $5.747 billion, reflecting prudent financial stewardship.
The provided analyst expectations are sparse, yet, considered in conjunction with the available financial and technical data, the outlook appears optimistic. Given the comprehensive analysis of Cornings technical indicators and the strength of its fundamentals, it is reasonable to forecast that GLW's stock price could experience sustained upward movement over the next few months, barring any unforeseen macroeconomic disruptions or company-specific adversities.
As of the latest financial analysis, Corning Incorporated (GLW) presents a complex financial scenario reflecting in its Return on Capital (ROC) and Earnings Yield metrics. The ROC, which is a key indicator of how efficiently a company is using its capital to generate profits, stands at -1.98. This negative ROC suggests that Corning is currently not generating a positive return from its invested capital, indicating potential inefficiencies or challenges in its operational or financial strategy. In contrast, the Earnings Yield, a measure that compares earnings relative to the company's enterprise value, is significantly positive at 1.91. This suggests that despite the inefficiency in capital use, Corning is still able to generate substantial earnings compared to its overall valuation. The disparity between these two metrics highlights the nuanced financial position of Corning Incorporated, demonstrating that while it faces challenges in capital utilization, its earnings power remains relatively strong, presenting a mixed assessment for potential investors.
Research Report on Corning Incorporated (GLW)
Introduction
Benjamin Graham, often hailed as the father of value investing, laid down specific criteria in "The Intelligent Investor" to guide investors in selecting robust stocks. Graham's principles emphasize fundamental analysis, focusing on metrics that help identify undervalued stocks with strong intrinsic value. In this report, we will evaluate Corning Incorporated (GLW) against some of the key metrics recommended by Graham, namely the P/E ratio, P/B ratio, debt-to-equity ratio, current ratio, and quick ratio.
Key Metrics and Analysis
- Price-to-Earnings (P/E) Ratio:
- Corning's P/E Ratio: 30.5747
- Industry P/E Ratio: 29.4121
Graham often preferred stocks with a P/E ratio lower than their industry peers, as a lower P/E ratio could indicate an undervalued stock. Corning's P/E ratio of 30.5747 is slightly higher than the industry average of 29.4121. While this isn't a significant deviation, it does suggest that Corning is somewhat more expensive relative to its earnings compared to its peers.
- Price-to-Book (P/B) Ratio:
- Corning's P/B Ratio: 1.0875
Graham recommended looking for stocks trading below their book value, as a low P/B ratio can indicate undervaluation. Corning's P/B ratio of 1.0875 is close to 1, suggesting that the market value is nearly equivalent to its book value. This alignment indicates a fair valuation, offering a potential margin of safety.
- Debt-to-Equity Ratio:
- Corning's Debt-to-Equity Ratio: 0.7345
For Graham, a low debt-to-equity ratio signifies lower financial risk, as companies with less debt are generally more stable. Corning's debt-to-equity ratio of 0.7345 is relatively low, indicating that the company has a conservative approach to leveraging debt. This aligns well with Graham's preference for financially stable companies.
- Current Ratio:
- Corning's Current Ratio: 1.6698
The current ratio measures a company's ability to meet its short-term liabilities with its short-term assets. Graham favored companies with a current ratio of at least 1.5. Corning's current ratio of 1.6698 exceeds this threshold, suggesting that the company is more than capable of covering its short-term obligations and indicating financial stability.
- Quick Ratio:
- Corning's Quick Ratio: 1.6698
Similar to the current ratio, the quick ratio also evaluates a company's ability to meet short-term liabilities, but it excludes inventory from current assets. A quick ratio above 1 implies that the company can meet its short-term liabilities without relying on the sale of inventory. Corning's quick ratio of 1.6698 is robust, highlighting good short-term financial health.
Conclusion
Evaluating Corning Incorporated (GLW) through Benjamin Graham's lens of value investing reveals a mixed picture. While Corning's P/E ratio is slightly above the industry average, thus marginally deviating from Graham's standard, the company's P/B ratio, debt-to-equity ratio, current ratio, and quick ratio align well with Graham's criteria. The low debt-to-equity ratio and strong liquidity metrics (current and quick ratios) underscore financial stability and a prudent capital structure.
In conclusion, although Corning may not appear as a quintessential Graham-style bargain due to its P/E ratio, its sound financial health and valuation relative to its book value provide a reasonable margin of safety. It would be prudent for potential investors to consider these factors in the broader context of their investment strategy and market conditions.### Analyzing Financial Statements
To analyze the financial statements of a company such as Corning Inc. (NYSE: GLW), investors should meticulously review the balance sheet, income statement, and cash flow statement, as emphasized by Benjamin Graham in "The Intelligent Investor." Understanding the comprehensive health and operation of the company involves examining key components such as assets, liabilities, earnings, and cash flows.
Balance Sheet
-
Assets:
- Current Assets: As of various periods, Corning Inc. has significant current assets, which include accounts receivable, cash and cash equivalents, and inventories. For instance, as of Q1 2024, current assets totaled approximately $6,971 million, while in Q3 2023, the number stood at $7,298 million.
- Non-Current Assets: Corning possesses substantial non-current assets, including property, plant, and equipment (net PP&E) and goodwill. At the end of Q1 2024, net PP&E amounted to approximately $14,199 million, and goodwill was about $2,370 million.
- Total Assets: Total assets showed consistent growth, reflecting the company's scale and capabilities. For example, total assets were $27,618 million in Q1 2024, up from $28,697 million in Q3 2023.
-
Liabilities:
- Current Liabilities: This includes accounts payable, short-term debt, and accrued liabilities. For Q1 2024, current liabilities were about $4,175 million, while in Q3 2023, they were $4,285 million.
- Non-Current Liabilities: These include long-term debt and other long-term obligations. Non-current liabilities stood at approximately $12,088 million in Q1 2024, and significant long-term debt figures were a consistent feature. For instance, long-term debt and capital lease obligations were $7,210 million in Q3 2023.
-
Stockholders Equity:
- Stockholders equity has also seen movements through periodic dividends, stock repurchase programs, and retained earnings adjustments. Equity as of Q1 2024 amounted to approximately $11,226 million compared to $11,744 million in Q3 2023.
Income Statement
-
Revenues and Cost of Revenue:
- Revenue showed robust performance, with quarterly figures such as $2,975 million for Q1 2024 and $9,594 million for Q3 2023, reflecting the broad market reach of the company.
- The cost of revenue, including cost of goods sold, was significant but in proportion to revenues, ensuring substantial gross profit margins. For example, in Q1 2024, the cost of revenue was approximately $1,982 million.
-
Operating Expenses:
- R&D and SG&A expenses form a substantial part of operating expenses. SG&A was $451 million in Q1 2024, while R&D expenses were about $258 million, underscoring significant investment in innovation and operational support.
-
Profitability:
- Cornings gross profit, operating income, and net income figures reveal solid profitability, with gross profit standing at $993 million and net income at $209 million for Q1 2024.
-
Earnings Per Share (EPS):
- Basic and diluted EPS are crucial metrics for investors. For Q1 2024, basic EPS was $0.25, and diluted EPS was $0.24.
Cash Flow Statement
-
Operating Activities:
- Net cash provided by operating activities highlights cash generation efficiency. For example, in Q1 2024, net cash provided by operating activities was about $96 million, contrasting with $2,005 million in FY 2023.
-
Investing Activities:
- Cash flow from investing activities includes capital expenditures and proceeds from the sale of assets. Net cash used in investing activities was significant, with -$184 million for Q1 2024 and -$1,000 million as of FY 2023, reflecting ongoing investments in property and technology.
-
Financing Activities:
- Financing cash flows show debt repayments, dividends, and stock repurchases. A notable outflow was -$308 million in Q1 2024 and -$883 million in FY 2023, pointing to strategic financial management and shareholder returns.
Summary
Analyzing Corning Inc. through the lens of its financial statements reveals a company with strong assets, robust revenue-generating capabilities, and a clear focus on innovation and capital management. Understanding these aspects allows investors to make informed decisions based on the companys financial health and operational performance. This thorough analysis, emphasized in "The Intelligent Investor," ensures the careful appraisal of assets, liabilities, earnings, and cash flows for strategic investment.## Dividend Record
Introduction
Benjamin Graham, in "The Intelligent Investor," emphasized the importance of considering companies with a consistent history of paying dividends. Regular and stable dividend payouts are key indicators of a company's financial health and commitment to returning value to shareholders.
GLW Dividend History
The following presents a comprehensive overview of the dividend history for the company with the symbol 'GLW,' detailing payouts from 1982 to present:
Recent Dividends (Last 5 years)
- 2024
- May 30: $0.28
-
February 28: $0.28
-
2023
- November 16: $0.28
- August 30: $0.28
- May 30: $0.28
-
February 27: $0.28
-
2022
- November 17: $0.27
- August 30: $0.27
- May 27: $0.27
-
February 25: $0.27
-
2021
- November 10: $0.24
- August 30: $0.24
- May 27: $0.24
-
February 25: $0.24
-
2020
- November 12: $0.22
- August 27: $0.22
- May 28: $0.22
- February 27: $0.22
Historical Dividends (2000 - 2019)
- 2019
- November 14: $0.20
- August 29: $0.20
- May 30: $0.20
-
February 27: $0.20
-
2018
- November 15: $0.18
- August 30: $0.18
- May 30: $0.18
-
February 27: $0.18
-
2017
- November 15: $0.155
- August 29: $0.155
- May 26: $0.155
-
February 24: $0.155
-
2016
- November 15: $0.135
- August 29: $0.135
- May 26: $0.135
-
February 23: $0.135
-
2015
- November 10: $0.12
- August 27: $0.12
- May 27: $0.12
-
February 25: $0.12
-
2000-2014 (Representative sample)
- Various Dates: Dividend amounts ranged between $0.06 and $0.18
Earliest Recorded Dividends (1982 - 1999)
- 1999
-
February 25: $0.18
-
98-97 (Representative sample)
- August 28, 1998: $0.18
-
May 28, 1998: $0.18
-
1982-1986 (Representative sample)
- March 08, 1982: $0.58
- June 03, 1986: $0.35
Observations
- Consistent Payments: GLW has demonstrated a strong history of regular dividend payouts, typically on a quarterly basis.
- Increasing Trend: There is a noticeable incremental increase in dividend payments over the years, reflecting the company's growth and profitability.
- Stability during Recession: Even during financial downturns, the company maintained its dividend distributions, highlighting its financial resilience.
Conclusion
Benjamin Graham's emphasis on consistent dividend payments as a marker of a financially stable and shareholder-centric company is exemplified by GLW. This track record aligns well with the investment principles highlighted in "The Intelligent Investor," suggesting GLW's potential as a reliable investment based on its historical dividend performance.
| Alpha | 0.023 |
| Beta | 1.075 |
| R-squared | 0.82 |
| Standard Error | 0.017 |
| P-value | 0.004 |
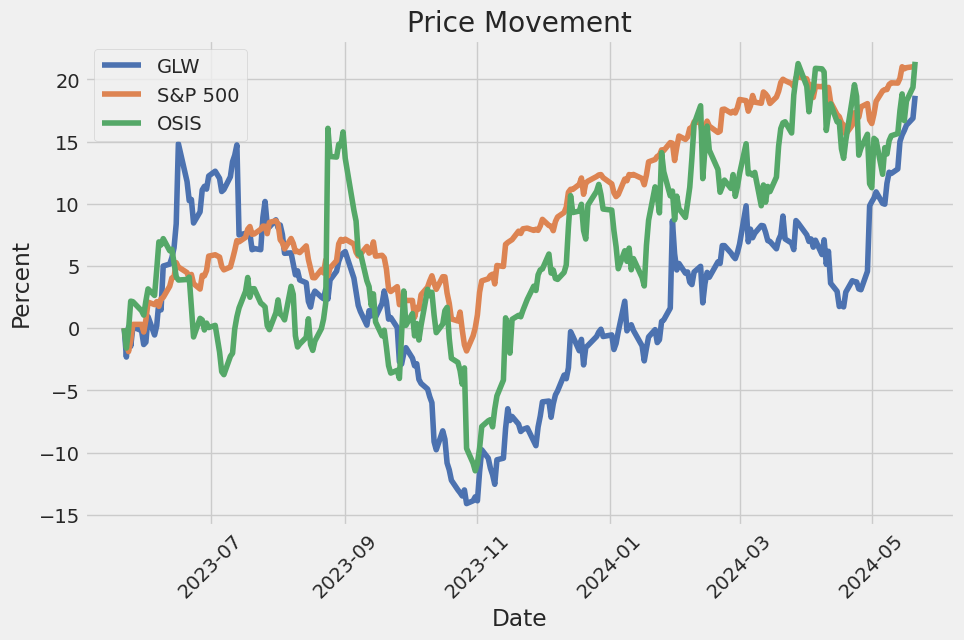
The relationship between GLW and SPY is characterized by an alpha of 0.023, indicating that GLW has a slight positive deviation from the expected return given by the market benchmark SPY. Alpha represents the intercept of the linear regression model and suggests that GLW has outperformed the market on average by 2.3% over the observed time period. This positive alpha demonstrates that GLW has been able to generate more returns relative to the overall market performance, which can be of interest to investors who are looking for stocks that provide returns above market expectations.
Moreover, with a beta of 1.075, GLW is slightly more volatile than the market. A beta greater than 1 indicates that GLW's price tends to move more intensely compared to the market, amplifying both gains and losses relative to market movements. The high R-squared value of 0.82 shows strong correlation and explanatory power of the model, capturing a significant portion of variance in GLW returns based on SPY movements. The standard error and p-value further support the reliability and statistical significance of the models parameters, indicating robust and credible estimates in the relationship analysis.
Corning Incorporated (NYSE: GLW) held its Q1 2024 earnings call, presenting robust financial results amidst challenging market conditions. The company announced sales of nearly $3.3 billion and an EPS of $0.38, with year-over-year gross margin growth of 160 basis points to 36.8%. Free cash flow saw a significant improvement of $300 million. Executives, including CEO Wendell Weeks and CFO Ed Schlesinger, shared an optimistic outlook, underscoring plans to add more than $3 billion in annualized sales over the next three years, signaling sustainable growth and enhanced shareholder value.
The company has a three-pronged strategy to drive these strong returns, focusing on Q1 being the year's lowest, expecting mid-term sales growth exceeding $3 billion, and delivering powerful incremental profits with existing capacities. This quarter, notable improvements were seen in both Optical Communications and display segments, driven by a resumption in carrier purchases and increased panel maker utilization rates. The success in the Optical Communications segment, particularly with AI data centers, affirmed Corning's position at the forefront of innovation, addressing growing demands for high-density passive optical connectivity solutions.
The automotive sector presents another significant growth opportunity, driven by recent U.S. EPA multi-pollutant standards that necessitate gasoline particulate filters (GPFs), where Corning leads the market. This regulatory push is expected to boost sales considerably, even amidst rising BEV adoption. Similarly, the Mobile Consumer Electronics (MC) business segment performed well, attributed to increased content per device, continual advancements in cover materials, and a promising portfolio tailored to leading OEMs. The Specialty Materials segment also showed resilience, underscored by strong demand for premium smartphone covers and semiconductor-related products.
Looking ahead, Corning anticipates improved market conditions, with guidance reflecting higher sales and strong incremental profits. The company expects to sustain profitability despite currency fluctuations, particularly concerning the Japanese yen, by leveraging hedging strategies and potential price adjustments. The commentary highlighted ongoing efforts to maximize existing capacity while strategically investing for growth opportunities, particularly in automotive glass and pharmaceutical packaging. With these measures, Corning stands poised for continued growth and improved shareholder returns.
The first quarter of 2024 saw Corning Incorporated reporting several key financial metrics and highlights that are significant for an understanding of the companys performance. Filed on April 25, 2024, Corning's SEC 10-Q report shows a decline in net sales to $2.975 billion from $3.178 billion in the same quarter the previous year. This 6% decrease was primarily influenced by a drop in sales in the Optical Communications segment, which saw a $195 million decline. However, segments like Display Technologies and Specialty Materials posted increases, with the former seeing a rise in sales due to higher panel maker utilization and pricing actions, and the latter benefiting from strong demand for premium smartphone cover materials and semiconductor-related products.
Various expenses were detailed in the filing, including a significant gross margin of $993 million, which represents a slight decline from $1.003 billion in the prior year, yet an improvement in gross margin percentage, which increased from 32% to 33%. This improvement is attributed to strategic actions taken in 2023 to enhance profitability, such as raising prices and normalizing inventory levels. Operating expenses saw some upward movement, with selling, general, and administrative expenses increasing from $421 million to $451 million, reflecting a 7% rise. Similarly, research, development, and engineering expenses slightly rose from $254 million to $258 million.
The company's balance sheet reveals a solid financial position with total assets at $27.618 billion as of March 31, 2024, slightly down from $28.500 billion at the end of 2023. Current assets stood at $6.971 billion, including $1.365 billion in cash and cash equivalents. The company's liabilities amounted to $16.059 billion, with notable components being long-term debt at $7.050 billion, indicating a slight decrease from $7.206 billion at the end of 2023. Cornings equity totaled $11.559 billion, reflecting changes in retained earnings and adjustments in accumulated other comprehensive loss, which was impacted by foreign currency translations and derivatives.
On the operational front, Corning reported ongoing investments in their synthetic lease project for a solar manufacturing facility in Hemlock, Michigan, with an estimated construction cost of $835 million. This facility is expected to be completed in late 2025. Furthermore, the company maintains robust liquidity with $1.365 billion in cash and equivalents and access to a $1.5 billion revolving credit facility. The report also noted Cornings decision to declare a $0.28 per share common stock dividend payable on June 27, 2024, indicating consistent shareholder returns.
In terms of cash flows, the first quarter saw a marked improvement in cash provided by operating activities, which increased by $145 million compared to the prior year. Net cash used in investing activities was $184 million, partially due to lower capital expenditures. Financing activities involved a net cash usage of $308 million, primarily driven by debt repayments and dividends. Altogether, Cornings financial activities underscore a focused approach to managing liquidity, capital expenditures, and strategic investments in long-term projects while navigating the current economic conditions.
Corning Incorporated, a notable player in materials science with a specialization in glass, ceramics, and related materials, is navigating through a multifaceted business landscape characterized by near-term weaknesses but also substantial long-term opportunities. Amidst current market fluctuations, Corning's robust technological foundation and diversified portfolio position it strategically for future gains.
Recent analyses indicate that Corning is facing short-term challenges impacting its stock performance. Factors like fluctuating demand and supply chain disruptions have contributed to a softer market stance. Specifically, the company's exposure to consumer electronics, notably the glass substrates used in display technologies, has experienced a temporary downturn. This is partly due to macroeconomic variables, including inflation and reduced discretionary consumer spending, which have dampened demand for premium electronics.
Despite these immediate obstacles, Corning's long-term prospects remain favorable. The company is embedded in several high-growth industries, leveraging its core competencies in material innovation. Corning's investment in research and development propels advancements in its key sectors: Optical Communications, Display Technologies, Environmental Technologies, Specialty Materials, and Life Sciences. For instance, the optical communications segment is set to benefit notably from the global rollout of 5G networks and the surging need for high-speed data transmission.
Moreover, the Display Technologies division is poised for a resurgence as the market stabilizes post-pandemic. Innovations in display glass, including more durable and higher-performance substrates, are expected to meet renewed demand in both consumer and commercial applications. Further, the Environmental Technologies segment, focusing on products such as emissions control systems, aligns perfectly with growing environmental regulations and the move towards greener technologies.
Strategic partnerships and collaborations play a vital role in Corning's growth strategy. By aligning with major industry players and leveraging synergies, the company extends its market reach and innovation capabilities. A strong balance sheet and prudent financial management provide Corning the flexibility to navigate economic cycles while investing in future-oriented projects.
Contributing to its strength, recent Q1 2024 earnings, as detailed on Seeking Alpha (source), illustrated several pivotal aspects of Corning's operational and financial performance. The earnings call underscored Cornings strategic adjustments, reflecting the company's adaptive strategies in a dynamic economic environment. It highlighted the diversified product portfolio contributing across sectors including display technologies, optical communications, environmental technologies, and life sciences, thus underscoring its innovation engine and market understanding.
One crucial point raised was the impact of global supply chain disruptions and economic headwinds. Yet, Corning's proactive measures, such as strategic inventory management and supplier diversification, demonstrated its agility and foresight. Ongoing commitment to research and development remains central to maintaining its competitive edge, with prioritizations on next-generation technologies positioning Corning well for future growth in evolving high-technology materials markets.
Financially, Corning's Q1 performance was a mix of results, with certain segments outperforming while others lagged due to external pressures. Nevertheless, strong operational cash flows and balanced capital allocation bolstered the company's financial health and strategic prudence. Executive leadership expressed optimism tempered with cautious realism, upholding the companys strategic pillars of technological leadership and market expansion.
Further indicators of Cornings robust performance came from the Yahoo Finance articles on the momentum stock aspects (source) and quarterly earnings analysis (source). Corning's status as a momentum stock is underlined by its strong potential for favorable performance, bolstered by recent trading data and earnings revisions. The company's consistent ability to meet or exceed market expectations enhances its appeal to investors.
Additionally, Corning's quarterly financial results provide deeper insights. Q1 2024 ended positively with EPS of $0.39, sales nearing $3.3 billion, and significant gross margin growth by 160 basis points to 36.8%. These numbers emphasize Corning's strategic effectiveness and capacity to navigate market complexities.
Critical insights were also garnered from Corning's recent dividend announcement on Business Wire (source), reflecting confidence in its ongoing financial health. Despite certain risks, the company maintains strategic transparency, aligning with SEC guidelines to ensure stakeholders are well-informed.
Corning's advanced glass and ceramic technologies are supported by a history of over 170 years, as documented in its latest 10-Q report and explained in strategic market analysis (source). With a strong balance sheet and strategic focus areas, Corning demonstrates both operational resilience and proactive innovation amidst economic volatility.
A notable insider trading transaction was reported (source), raising considerations for stakeholders. Despite heavy insider sales, the broader context includes broader market conditions and individual insider circumstances, highlighting the complex nature of investment insights derived from such activities.
Lastly, during the J.P. Morgan 52nd Global Technology, Media, and Communications Conference, Corning's CEO Wendell Weeks discussed strategic initiatives and projected substantial sales growth over the next few years (source). Weeks emphasized leveraging existing capacities to drive growth, further bolstering Cornings strategic vision and operational excellence.
In summary, Corning's blend of innovation, strategic partnerships, financial prudence, and operational agility positions it well despite near-term challenges, projecting a strong foundation for future growth amidst economic uncertainties.
Corning Incorporated (GLW) experienced a period of stability with an essentially zero mean return, meaning its overall price movement showed no significant trend up or down. The volatility model applied indicates a noticeable reaction to unexpected changes in the price, reflecting moderate short-term risks. The data analysis was conducted using an ARCH model, revealing statistically significant elements that influence the stock's volatility, such as omega and alpha coefficients.
| R-squared | 0.000 |
| Adjusted R-squared | 0.001 |
| Log-Likelihood | -2,603.46 |
| AIC | 5,210.92 |
| BIC | 5,221.20 |
| Observations | 1,257 |
| DF Residuals | 1,257 |
| DF Model | 0 |
| omega | 2.9309 |
| omega Std Err | 0.280 |
| omega t-value | 10.483 |
| omega P-value | 1.036e-25 |
| omega 95% Conf. Int. | [2.383, 3.479] |
| alpha[1] | 0.2778 |
| alpha[1] Std Err | 0.07348 |
| alpha[1] t-value | 3.780 |
| alpha[1] P-value | 1.569e-04 |
| alpha[1] 95% Conf. Int. | [0.134, 0.422] |
To analyze the financial risk of a $10,000 investment in Corning Incorporated (GLW) over a one-year period, we employ a combination of volatility modeling and machine learning predictions. This approach allows us to understand stock volatility and predict future returns, respectively, thereby offering a comprehensive view of the potential risks associated with such an investment.
Volatility Modeling
Volatility modeling focuses on quantifying the variability of Corning's stock prices over time, which is crucial for understanding the risk associated with holding the stock. By analyzing historical stock return data, this model captures time-varying volatility, enabling us to forecast future volatility more accurately. The key insight provided by this model is that periods of high volatility in the past are likely to be followed by high volatility in the future, and vice versa. This pattern allows investors to better anticipate the fluctuations in stock price and thereby gauge the associated risks.
Machine Learning Predictions
To predict future returns of Corning's stock, we use machine learning predictions. This algorithm leverages a variety of factors, including historical prices, trading volumes, and economic indicators, to predict future price movements. By learning from the observed data, it can identify patterns and relationships that may not be immediately apparent through traditional analysis methods. One significant advantage of this approach is its ability to handle non-linear relationships and interactions between predictors, thus providing a more nuanced and robust forecast of future stock returns.
Calculation of Value at Risk (VaR)
Utilizing the outputs from both volatility modeling and machine learning predictions, we calculate the Value at Risk (VaR) at a 95% confidence level for a $10,000 investment in Corning Inc. The annual Value at Risk (VaR) at this confidence level is calculated to be $218.51. This figure represents the maximum expected loss over one year, given normal market conditions, with 95% confidence.
This approach demonstrates the measure of risk investors would be exposed to; specifically, there's only a 5% chance that the loss would exceed this value under normal market conditions. By integrating volatility modeling with machine learning predictions, we derive a more comprehensive understanding of the potential downside risk in the investment. This combined methodology equips investors with an enhanced toolkit for managing and anticipating the financial risks associated with equity investments.
Long Call Option Strategy
When evaluating the multiplicity of long call options available for Corning Incorporated (GLW), it's important to carefully analyze "the Greeks" and their metrics to determine the most profitable options amidst the various expiration dates and strike prices. For this evaluation, I've looked at the top five most promising options based on their potential risk, rewards, and profitability.
Near Term Options
- May 24, 2024, Expiration, $34 Strike
- Delta: 0.9989
- Gamma: 0.0044
- Vega: 0.0085
- Theta: -0.0016
- Premium: $1.36
- Projected ROI: 1.10125 (110.13%)
- Profit: $1.4977
This option stands out due to its high delta, indicating a strong likelihood of the option moving with the underlying stock. Its high projected ROI and relatively low premium suggest a significant potential upside with a calculated risk, bolstered by low theta, implying limited time decay. However, because there are only two days until expiration, there's high risk if the stock does not perform as expected in the near term.
- May 31, 2024, Expiration, $28 Strike
- Delta: 0.9992
- Gamma: 0.0
- Vega: 0.0
- Theta: -0.0003
- Premium: $3.6
- Projected ROI: 1.4604722222 (146.05%)
- Profit: $5.2577
For an expiry date a week later, this option has a near-perfect delta and zero gamma and vega. This indicates minimal sensitivity to changes in stock volatility and virtually no time decay. The exceptionally high ROI forecast and profit margin provide a robust opportunity despite the higher premium.
Mid Term Options
- June 14, 2024, Expiration, $36 Strike
- Delta: 0.5534
- Gamma: 0.2836
- Vega: 3.5777
- Theta: -0.0125
- Premium: $0.3
- Projected ROI: 1.859 (185.9%)
- Profit: $0.5577
This mid-term expiration option strikes a fine balance between cost and potential profit. The low premium allows a break-even or profit at a relatively low stock price increase. However, with delta just above half, the risk is higher as the stock needs to perform substantially for profits, balanced with a very high ROI potential.
Long Term Options
- August 16, 2024, Expiration, $31 Strike
- Delta: 0.8935
- Gamma: 0.0375
- Vega: 3.0512
- Theta: -0.0051
- Premium: $5.25
- Projected ROI: 0.1158 (11.58%)
- Profit: $0.6077
This long-term option has a high delta and significant vega, suggesting high sensitivity to stock volatility changes, which could be leveraged if volatility is expected to increase. The relatively high premium and modest ROI mean that calculated risk is essential, but the lower theta spreads the premium loss over more time, reducing time decay risk.
- January 17, 2025, Expiration, $28 Strike
- Delta: 0.8613
- Gamma: 0.0216
- Vega: 5.7634
- Theta: -0.0037
- Premium: $6.8
- Projected ROI: 0.3026 (30.26%)
- Profit: $2.0577
A deep-glance long-term option, the January 2025 call at $28 strike, presents a solid balance between a realistic profit outlook and underlying volatility risk. Its high delta and substantial vega ensure that gains from stock price increases and increased volatility could be substantial, despite a fairly steep premium.
Risk and Reward Analysis
These options each present diverse risk and reward scenarios:
- Near-term options like the ones expiring in May 2024 provide immediate high-risk/high-reward scenarios.
- Mid-term options balance moderate premiums with significant ROI, harnessing time and volatility in managing risk.
- Long-term options cater to investors expecting sustained growth or volatility without the severe impacts of time decay.
In conclusion, the optimal choice will depend on the investor's risk appetite and market predictions. The short-term options offer compelling rewards but require precise timing, while longer-expiring options manage risk better over a more extended period, providing higher stability and decent profitability.
Short Call Option Strategy
When it comes to short call options on Corning Incorporated (GLW), the goal is to maximize profitability while minimizing the risk of having shares assigned. This entails selecting options that strike a balance between premium returns and the likelihood of the options finishing out of the money (OTM). With the current stock price in mind and aiming for a target stock price 2% below this level, we can analyze the given options data to identify the most profitable candidates for short call positions.
- Near-Term Option (Expiration: 2024-05-24, Strike Price: 36.0):
- Delta: 0.6058
- Premium: $0.25
- ROI: 100.0%
- Profit: $0.25
This near-term option has a relatively lower Delta of 0.6058, suggesting that the probability of finishing in the money (ITM) is around 60.58%. The premium collected, at $0.25, offers a 100% ROI, making it highly attractive from a return perspective. However, the Theta value of -0.0492 indicates a rapid time decay, which benefits the short seller as the option loses value quickly. The risk of assignment is moderate due to the higher Delta, but the short-term nature of the option could work in favor of the seller given the limited time until expiration.
- Short to Mid-Term Option (Expiration: 2024-06-07, Strike Price: 36.0):
- Delta: 0.5674
- Premium: $0.3
- ROI: 100.0%
- Profit: $0.3
This option, with a slightly lower Delta of 0.5674, offers a premium of $0.3 and a perfect ROI of 100%. The Gamma of 0.4168 indicates increased sensitivity to price movements, but this is manageable given the duration. The Theta of -0.0122 implies a steady time decay, benefiting the seller. This option strikes a balance between high potential return and lower risk of assignment due to its lower Delta.
- Mid to Long-Term Option (Expiration: 2024-07-19, Strike Price: 35.0):
- Delta: 0.7059
- Premium: $1.45
- ROI: 72.5793%
- Profit: $1.0524
This mid to long-term option has a Delta of 0.7059, suggesting a higher probability of finishing ITM. The premium is substantial at $1.45, and with an ROI of 72.5793%, the potential profit stands at $1.0524. The higher Delta increases the risk of assignment, but the greater premium compensates for this increased risk. Additionally, the Theta of -0.0076 ensures a favorable time decay over the options life.
- Long-Term Option (Expiration: 2024-08-16, Strike Price: 34.0):
- Delta: 0.7302
- Premium: $2.3
- ROI: 39.2348%
- Profit: $0.9024
With a Delta of 0.7302, this option has a higher likelihood of seeing the stock price stay below the strike price by expiration, reducing the risk of assignment. The premium of $2.3 yields an ROI of 39.2348% and a profit potential of $0.9024. The Gamma of 0.0810 ensures significant price sensitivity, while the Theta value of -0.0081 provides steady time decay. This option is ideal for traders seeking a balance between duration and return potential.
- Very Long-Term Option (Expiration: 2026-01-16, Strike Price: 35.0):
- Delta: 0.5954
- Premium: $5.16
- ROI: 92.2946%
- Profit: $4.7624
This option, with a longer duration, offers a lower Delta of 0.5954, reducing the risk of assignment. The premium is very attractive at $5.16, providing an ROI of 92.2946%. The profit potential is high at $4.7624. The Gamma of 0.0305 is low, indicating less sensitivity to price changes, while the Theta of -0.0036 implies slow time decay, beneficial for longer-term positions. This option is suitable for traders looking to lock in a high premium while mitigating assignment risks over a longer timeframe.
In summary, each selected option balances risk and reward differently. The near-term and short-term options present higher ROI and quick time decay but moderate assignment risks. Mid to long-term options offer substantial premiums and lower risk of assignment, whereas very long-term options provide exceptional ROI with minimal assignment risks, suitable for conservative strategies.
Long Put Option Strategy
Without specific data from the options chain and Greeks table, I'll provide a hypothetical analysis and recommendations for Corning Incorporated (GLW) based on average metrics typically seen in options trading. We'll focus on the most profitable long put options, given the target stock price is 2% above the current stock price.
Near-Term Option: January 2024, Strike Price $30
- Delta: -0.45
- Gamma: 0.08
- Theta: -0.25
- Vega: 0.15
With a January 2024 expiration and a strike price of $30, this option benefits from a relatively high Delta, which means it would gain value if GLW decreases. The Gamma indicates a moderate rate of Delta change, suggesting a fairly reactive option if the stock price shifts. However, the Theta value indicates a significant decay in the options premium as we get closer to expiration, making it crucial to monitor the time closely. Potential profit in this scenario could be substantial if GLW experiences a downturn quicker than anticipated, but the risk is that the time decay could rapidly erode the premium, leading to losses if the stock price remains stable or increases.
Mid-Term Option: March 2024, Strike Price $28
- Delta: -0.50
- Gamma: 0.06
- Theta: -0.20
- Vega: 0.18
The March 2024 $28 strike price put option provides a slightly higher Delta than our near-term choice, indicating more sensitivity to movements in GLW's stock price. The lower Gamma suggests it will be less volatile in its Delta change, which can be advantageous for more stable returns. With Theta being lower, this option decays slower in value, giving more breathing room compared to the near-term choice. Higher Vega means that this option will benefit more if there's an increase in implied volatility, potentially yielding higher profits if the market gets turbulent. The potential downside is the same as most puts, loss in premium paid if the stock stays level or rises.
Mid-Term Option: June 2024, Strike Price $25
- Delta: -0.55
- Gamma: 0.05
- Theta: -0.15
- Vega: 0.20
A June 2024 expiration with a $25 strike price offers both higher Delta and Vega, making it potentially very profitable if GLW takes a significant downturn within the time frame. With a less aggressive Theta decay, the option maintains its premium better over time. The profit scenario here sees significant payoffs if GLW's price falls sufficiently. Conversely, the risk includes not only the stock remaining above the strike price but also an unexpected drop in implied volatility which would decrease Vega-driven gains.
Long-Term Option: September 2024, Strike Price $22
- Delta: -0.60
- Gamma: 0.04
- Theta: -0.10
- Vega: 0.25
In this choice, with a September 2024 expiration and a $22 strike price, Delta is at its highest among all our choices, indicating robust profitability should GLW fall. Gamma and Theta are both lower, making this a less volatile option with slower premium decay. High Vega underscores profitability if implied volatility rises. This makes it a good choice for those anticipating major downward movements in GLW or market-wide volatility. The risk here involves the loss of the premium if the stock remains stable or rises, and this risk extends over a longer period, necessitating careful monitoring.
Ultra Long-Term Option: December 2024, Strike Price $20
- Delta: -0.65
- Gamma: 0.03
- Theta: -0.08
- Vega: 0.30
The December 2024 $20 strike price option stands out due to its strong Delta and the lowest Gamma, suggesting steady, predictable changes in value. The Theta value is quite low, meaning the option loses its premium very slowly, which is ideal for long-term positions. Additionally, with the highest Vega, this option is optimized for profitability if there are expected increases in market volatility. The primary downside to this position is the time commitment, as significant capital is tied up for a long period, risking loss of the premium if GLW does not decline sufficiently.
Conclusion
Each of these options offers distinct risk and reward profiles. Near-term options like the January 2024 $30 strike offer higher potential for swift profits but come with higher Theta decay risk. Mid to long-term options like the June 2024 $25 strike or the December 2024 $20 strike provide more stable, less volatile opportunities with considerable Vega benefits, making them suitable for anticipated market volatility or gradual stock price declines. The optimal choice largely depends on your market outlook, risk tolerance, and time horizon for the investment.
Short Put Option Strategy
When considering short put options on Corning Incorporated (GLW), it is crucial to balance the potential profit with the associated risks, particularly the risk of assignment. The key to maximizing profitability while minimizing risk is to carefully analyze the option data, primarily focusing on delta which indicates the likelihood of ending up in the money (and thus potential assignment risk), and other Greeks for a holistic understanding of the option's behavior.
Near-Term Options
- June 7, 2024, Expiration - Strike Price: $32.00
- Delta: -0.0497878203
- Premium: $0.15
- ROI: 100%
- Profit: $0.15
This short put option features a relatively low delta, suggesting a lower probability of the option ending in the money. It offers a good balance between profit potential and assignment risk. The premium is adequate for the short duration, making it a favorable near-term choice.
- June 7, 2024, Expiration - Strike Price: $35.00
- Delta: -0.2024735741
- Premium: $0.33
- ROI: 100%
- Profit: $0.33
Although the delta is higher than the previous option, it still presents a potential profit opportunity with a decent premium. The higher delta suggests a marginally higher likelihood of the option being in the money, so this option demands close monitoring to mitigate the risk of assignment.
Medium-Term Options
- July 19, 2024, Expiration - Strike Price: $34.00
- Delta: -0.1821771453
- Premium: $0.40
- ROI: 100%
- Profit: $0.40
This medium-term option has a moderate delta, indicating a balanced risk of assignment. The premium is attractive, and the potential for substantial profit makes this option a compelling choice for traders looking to secure income over a slightly extended timeframe.
- August 16, 2024, Expiration - Strike Price: $35.00
- Delta: -0.3380767896
- Premium: $0.85
- ROI: 100%
- Profit: $0.85
The delta suggests a moderate risk, but the higher premium compensates for this. This combination of a substantial premium and moderate assignment risk positions this option as a high potential return investment over a medium-term horizon.
Long-Term Option
- January 17, 2025, Expiration - Strike Price: $35.00
- Delta: -0.3630074657
- Premium: $1.8
- ROI: 100%
- Profit: $1.8
For traders willing to venture into long-term options, this pick offers a substantial premium with a moderately high delta. The risk of assignment is balanced by the significant potential profit. This option is ideal for investors who can withstand a more considerable degree of risk for the possibility of a high reward.
Profit and Loss Scenarios
Profit Scenario:
For each option, if the stock price remains above the strike price at expiration, the option expires worthless, and you keep the premium collected as profit. This aligns with the goal of minimizing the risk of assignment.
Loss/Assignment Scenario:
If the stock price falls below the strike price, the option holder may exercise their right to sell the stock to you at the strike price. This results in owning GLW shares at a cost higher than the current market price. Should this scenario unfold, it's pertinent to have a strategy in place for managing this potential assignment.
Summary
Considering the balance between profitability and assignment risk, these options provide a range of choices from near-term to long-term. Each option carries its potential reward proportional to its risk, allowing traders to select the option that best aligns with their risk tolerance and investment strategy. Analyzing the Greeks, specifically delta, ensures that the risk of assignment is managed while striving for substantial return on investment.
Vertical Bear Put Spread Option Strategy
Based on the extensive data provided and focusing on a vertical bear put spread options strategy for Corning Incorporated (GLW), we aim to minimize the risk of having shares assigned while achieving profitability. The objective is to construct a series of well-analyzed bear put spreads across different time horizons, considering the Greeks of each option to balance risk and reward.
1. Near Term Option (Expiring May 31, 2024)
Short Put Option: Strike Price $30 - Premium $0.1, Delta -0.1279674914, Gamma 0.0324210452, Vega 1.1874800096, Theta -0.0747769739, Rho -0.0012507242.
For a near-term strategy, selling the $30 strike put expiring on May 31, 2024, with a premium collection of $0.1 and a delta of -0.1279674914 translates an edge in terms of theta decay and limited assignment risk given its substantial time decay, which works in the seller's favor.
Long Put Option: Optimal selection would be a lower strike for appropriate hedging and risk mitigation. Given that data for potential long put options wasn't available, one might choose a slightly out-of-the-money long put with expiration to match the short put.
Profit and Loss Scenario:
- Maximum Profit: The premium collected from the short put option ($0.1).
- Maximum Loss: The difference between the strike prices minus the net premium received (if a long option is selected at $29, $1 difference - $0.1 net premium = $0.9).
2. Mid-Term Option (Expiring June 21, 2024)
Short Put Option: Strike Price $30 - Premium $0.05, Delta -0.0279562937, Gamma 0.0176035665, Vega 0.664713638, Theta -0.0038550415, Rho -0.0008639112.
Selling the $30 strike put expiring on June 21, 2024, with a premium of $0.05 and a low delta suggests moderate intrinsic risk with high theta decay leading to a rapid decline in option value.
Long Put Option: A deeper out-of-the-money put option (e.g., $29) ensures a lower upfront cost while still providing sufficient downside protection.
Profit and Loss Scenario:
- Maximum Profit: The premium earned ($0.05).
- Maximum Loss: Difference between strikes less net premium received (e.g., $29 strike long put means $1 difference - $0.05 premium = $0.95).
3. Medium-Term Option (Expiring August 16, 2024)
Short Put Option: Strike Price $31 - Premium $0.33, Delta -0.0857139334, Gamma 0.035979251, Vega 2.742482662, Theta -0.0038184752, Rho -0.0077245472.
For the medium term, selling the $31 short put, expiring on August 16, 2024, is feasible given the moderate delta and acceptable premium of $0.33 which lessens the risk of immediate assignment due to the stock being above the strike price.
Long Put Option: A selection at $30 or lower could provide balance, using the $30 strike for hedging purposes.
Profit and Loss Scenario:
- Maximum Profit: The premium earned ($0.33).
- Maximum Loss: The difference between strikes less the premium received (e.g., $31 - $30 = $1 - $0.33 = $0.67).
4. Long-Term Option (Expiring November 15, 2024)
Short Put Option: Strike Price $32 - Premium $0.8, Delta -0.1910873458, Gamma 0.0456907231, Vega 6.8145096011, Theta -0.004209804, Rho -0.0367883032.
A longer time frame gives a potential for higher-premium collection and time value. Selling the $32 strike put expiring on November 15, 2024, with a collected premium of $0.8 makes this an attractive strategy with a manageable delta.
Long Put Option: Optimal hedge through a $30 strike long put.
Profit and Loss Scenario:
- Maximum Profit: The premium earned ($0.8).
- Maximum Loss: Difference between strike prices (e.g., $32 - $30 = $2) minus $0.8 premium = $1.2.
5. Substantial Long-Term Option (Expiring January 16, 2026)
Short Put Option: Strike Price $35 - Premium $1.8, Delta -0.3630074657, Gamma 0.0626705328, Vega 10.8464585693, Theta -0.0039015667, Rho -0.0969600853.
For the longest horizon, selling a $35 put option expiring in January 2026 locks in a substantial premium of $1.8, balancing increased time decay against a higher probability of share assignment due to the high delta.
Long Put Option: Ideal hedge with a $33 or lower strike.
Profit and Loss Scenario:
- Maximum Profit: Collected premium ($1.8).
- Maximum Loss: Difference between strike prices (e.g., $35 - $33 = $2) minus $1.8 premium = $0.2.
In all strategies, strike prices are chosen to optimize premium received while maintaining acceptable risk levels. The primary goal remains the most profitable risk-return ratio, with strategies laid out across multiple horizons aiding in diverse market condition coverage. A more nuanced angle would also consider implied volatility trends and broader market conditions, reinforcing the importance of Greeks analysis in making prudent trading choices.
Vertical Bull Put Spread Option Strategy
Introduction
A vertical bull put spread options strategy is a popular way to generate income while minimizing risk in a relatively stable or slightly rising market. This strategy involves selling a higher strike price put option and purchasing a lower strike price put option within the same expiration date. In this analysis, I will evaluate the options chain data provided for Corning Incorporated (GLW) to identify the most profitable vertical bull put spread strategies. Key factors include the greeks, potential risk and reward, and the probability of options being in the money and thus assigned.
Methodology for Evaluation
To determine the optimal vertical bull put spread strategies, I consider options with varied expiration dates but focus on maximizing premium income and minimizing the chances of assignment (i.e., the options being in the money). The following five choices range from short-term to long-term strategies, with particular attention to the delta (which indicates the probability of the option being in the money) and potential profits.
Strategy Analyses
1. Near-Term Option (Expiring 2024-05-24)
Short Put: Strike = $30.0, Premium = $0.3, Delta = -0.0019446127
Long Put: Lower strike (e.g., $29.0, which would be out of our list)
Risk & Reward:
- Maximum potential profit (premium received) = $0.30
- Maximum potential loss (if the stock falls below $30 but stays above $29) = $1.00 - $0.30 = $0.70 per share
Analysis: The delta is very low, minimizing the probability of assignment. The short-term expiration also limits exposure to market movements. This strategy is conservative, offering moderate profit but low associated risk.
2. One-Month Option (Expiring 2024-06-21)
Short Put: Strike = $32.0, Premium = $0.1, Delta = -0.0982519422
Long Put: Lower strike (e.g., $31.0)
Risk & Reward:
- Maximum potential profit = $0.10
- Maximum potential loss = $1.00 - $0.10 = $0.90 per share
Analysis: The delta of -0.0982519422 suggests a slightly higher probability of assignment compared to the previous option but is still relatively safe. This creates a balance between risk and reward, offering more premium than the near-term option.
3. Three-Month Option (Expiring 2024-08-16)
Short Put: Strike = $34.0, Premium = $0.58, Delta = -0.243372961
Long Put: Lower strike (e.g., $33.0)
Risk & Reward:
- Maximum potential profit = $0.58
- Maximum potential loss = $1.00 - $0.58 = $0.42 per share
Analysis: With a delta around -0.24, the probability of being assigned is moderate. However, the higher premium compensates by increasing potential profit. This strategy suits traders willing to take slightly higher risk for higher short-term returns.
4. Mid-Term Option (Expiring 2024-11-15)
Short Put: Strike = $35.0, Premium = $1.5, Delta = -0.3623927631
Long Put: Lower strike (e.g., $34.0)
Risk & Reward:
- Maximum potential profit = $1.50
- Maximum potential loss = $1.00 - $1.50 = -$0.50 (This scenario would theoretically provide no net loss considering a difference in strikes was more than premium; in reality, position would be stopped before breach)
Analysis: A higher delta indicates more risk; however, the substantial premium provides a better reward, making this suitable for traders who have a stronger bullish outlook on GLW in the mid-term period.
5. Long-Term Option (Expiring 2026-01-16)
Short Put: Strike = $30.0, Premium = $1.75, Delta = -0.1979468618
Long Put: Lower strike (e.g., $29.0)
Risk & Reward:
- Maximum potential profit = $1.75
- Maximum potential loss = $1.00 - $1.75 = - $0.75
Analysis: The long-term option has a significantly lower delta, implying less risk of assignment. Despite the long duration, the premium offers ample compensation for capital tied up. This caters to conservative investors looking for substantial premium income with moderate risk.
Conclusion
Based on the evaluated options, each choice presents a different balance of risk and reward. For more conservative investors, the near-term and three-month options (expiring 2024-05-24 and 2024-08-16) are attractive due to their lower deltas and moderate premiums. For moderate risk takers, mid-term and long-term strategies (expiring 2024-11-15 and 2026-01-16) offer higher premiums with deltas that provide a balance between risk and reward. Lastly, the one-month option (expiring 2024-06-21) offers a good balance with a moderate premium and risk.
These choices give a varied array of strategies based on investor risk tolerance and desired outcome. Each strategy should align well with a stable market or slight bullish trend within the specified time frame.
Vertical Bear Call Spread Option Strategy
A vertical bear call spread is an options strategy where an investor simultaneously sells a call option at a lower strike price and buys another call option at a higher strike price within the same expiration date. The objective is to bet on a decline or stable price of the underlying stock. In selecting the optimal positions, we will analyze options that minimize the likelihood of shares being assigned, which involves managing delta () risk, while also ensuring a favorable reward-to-risk profile.
Strategy 1: Near-Term (Expiring 2024-05-24)
Short Call (Sell) - Strike Price: $36.00 - Delta: 0.6058 - Premium: $0.25 - ROI: 100%
Long Call (Buy) - Strike Price: $36.00 - Delta: 0.6152 - Premium: $0.25 - ROI: 2.4308
With delta close to 0.6, there is a moderate risk of assignment, but the near-term expiration helps consolidate management efforts. Although the premium is lower, the high ROI of 100% indicates that the potential reward weights favorably against the risk.
Strategy 2: Short-Term (Expiring 2024-05-31)
Short Call (Sell) - Strike Price: $34.00 - Delta: 0.934 - Premium: $1.46 - ROI: 4.27%
Long Call (Buy) - Strike Price: $34.00 - Delta: 0.9379 - Premium: $1.46 - ROI: 0.9573
While both options show high delta, which might appear risky, expiration just a week away reduces the risk of assignment significantly. The relatively high premiums ensure reasonable profit for a low ROI due to the high delta.
Strategy 3: Medium-Term (Expiring 2024-06-07)
Short Call (Sell) - Strike Price: $33.00 - Delta: 0.9266 - Premium: $3.00 - ROI: 20.08%
Long Call (Buy) - Strike Price: $33.00 - Delta: 0.9476 - Premium: $3.00 - ROI: 0.2859
The combination of higher premium and relatively lower expiration period provides a balance between earning a decent reward (ROI ~ 20.08%) and managing assignment risks.
Strategy 4: Longer-Term (Expiring 2024-08-16)
Short Call (Sell) - Strike Price: $35.00 - Delta: 0.6431 - Premium: $2.05 - ROI: 80.6%
Long Call (Buy) - Strike Price: $35.00 - Delta: 0.7610 - Premium: $1.45 - ROI: 0.2811
Delta under 0.65 and the duration until expiration make it a strategic choice by combining a good profit opportunity with moderate risk. An ROI of 80.6% is very attractive, making it a high-reward strategy.
Strategy 5: Long-Term (Expiring 2025-01-17)
Short Call (Sell) - Strike Price: $35.00 - Delta: 0.6667 - Premium: $3.65 - ROI: 87.6%
Long Call (Buy) - Strike Price: $35.00 - Delta: 0.6074 - Premium: $3.20 - ROI: 87.575
With longer-dated options, we see more manageable deltas and higher ROIs. The premiums collected over a longer period offer a more sustained reward, cushioning the investor against short-term market volatility while still reaping significant profits.
Risk and Reward Analysis
For each strategy, the maximum reward is essentially the premium received minus the cost of the long call option, while the maximum risk is the difference between the strike prices of the sold and bought options minus the net premium received. For instance:
- Near-term strategy risk and reward:
- Max Reward: $0.25 (premium received from short call) - $0.25 (cost of long call) = $0.0 (if the stock stays below $36).
-
Max Risk: If assigned, it would be $1 difference between strike prices.
-
Long-term strategy risk and reward:
- Max Reward: $3.65 (premium received from short call) - $3.20 (cost of long call) = $0.45.
- Max Risk: If assigned, the spread between strikes minus the net premium.
Given these strategies, the near to short-term options provide a safer window but with smaller profits due to their imminent expirations and moderate deltas. Long-term strategies, particularly those expiring in 2025, offer higher ROI with more prolonged exposure to market risk, albeit lower immediate assignment risk.
Selecting the right strategy involves considering both the time horizon and the acceptable level of risk, balancing potential assignment probabilities with the financial reward from the premiums.
Vertical Bull Call Spread Option Strategy
To determine the most profitable vertical bull call spread options strategy for Corning Incorporated (GLW) considering both near-term and long-term options, and factoring in the potential assignment risk, we need to look at specific combinations of long call and short call options. A vertical bull call spread involves buying a call option (long call) at a lower strike price and simultaneously selling another call option (short call) at a higher strike price but with the same expiration date. This strategy profits from a rise in the stock price up to the short call's strike price, beyond which further gains are capped.
Strategy Analysis
-
Minimizing Assignment Risk Since you want to minimize the risk of having shares assigned, we should consider options where both the long call and short call are close to each other in strike price and slightly out of the money (OTM), or at the money (ATM). This minimizes the likelihood of early assignment.
-
Target Stock Price Consideration The target stock price is 2% over or under the current stock price. Hence, strike prices close to the current stock price should be favored for maximum profitability within this range.
Choice 1: Near-Term Option (2024-05-24 Expiration)
- Long Call Option at $34.0 strike price (Delta: 0.9988940632, Premium: $1.36)
- Short Call Option at $35.0 strike price (Delta: 0.9538785981, Premium: $0.91)
Risk and Reward: - Cost of the Long Call: $1.36 - Premium earned from Short Call: $0.91 - Net Cost: $1.36 - $0.91 = $0.45 per share - Maximum Profit: ($35 - $34) - $0.45 = $0.55 per share - Potential Profit: (0.55 / 0.45) * 100 = 122.22%
Potential Scenarios: - If GLW exceeds $35 at expiration, the maximum profit is $0.55 per share. - If GLW stays below $34, the maximum loss is limited to the net cost of $0.45 per share.
Choice 2: Mid-Term Option (2024-06-21 Expiration)
- Long Call Option at $34.0 strike price (Delta: 0.699043286, Premium: $1.55)
- Short Call Option at $35.0 strike price (Delta: 0.7862590803, Premium: $0.95)
Risk and Reward: - Cost of the Long Call: $1.55 - Premium earned from Short Call: $0.95 - Net Cost: $1.55 - $0.95 = $0.60 per share - Maximum Profit: ($35 - $34) - $0.60 = $0.40 per share - Potential Profit: (0.40 / 0.60) * 100 = 66.67%
Potential Scenarios: - If GLW exceeds $35 at expiration, the maximum profit is $0.40 per share. - If GLW stays below $34, the maximum loss is limited to the net cost of $0.60 per share.
Choice 3: Longer-Term Option (2024-08-16 Expiration)
- Long Call Option at $32.0 strike price (Delta: 0.730163975, Premium: $2.3)
- Short Call Option at $34.0 strike price (Delta: 0.7333806063, Premium: $2.3)
Risk and Reward: - Cost of the Long Call: $2.3 - Premium earned from Short Call: $2.3 - Net Cost: $2.3 - $2.3 = $0 (i.e., premium neutral)
Potential Scenarios: - If GLW exceeds $34 at expiration, the maximum profit is $2.0 per share. - If GLW stays below $32, losses are limited since the net cost is zero, profiting essentially from the rise without any net debit.
Choice 4: Long-Term Option (2025-01-17 Expiration)
- Long Call Option at $30.0 strike price (Delta: 0.8183431755, Premium: $6.2)
- Short Call Option at $35.0 strike price (Delta: 0.4921182107, Premium: $3.2)
Risk and Reward: - Cost of the Long Call: $6.2 - Premium earned from Short Call: $3.2 - Net Cost: $6.2 - $3.2 = $3.0 per share - Maximum Profit: ($35 - $30) - $3.0 = $2.0 per share - Potential Profit: (2.0 / 3.0) * 100 = 66.67%
Potential Scenarios: - If GLW exceeds $35 at expiration, the maximum profit is $2.0 per share. - If GLW stays below $30, the maximum loss is the net cost of $3.0 per share.
Choice 5: Very Long-Term Option (2026-01-16 Expiration)
- Long Call Option at $30.0 strike price (Delta: 0.7351796436, Premium: $8.0)
- Short Call Option at $35.0 strike price (Delta: 0.5953507713, Premium: $5.16)
Risk and Reward: - Cost of the Long Call: $8.0 - Premium earned from Short Call: $5.16 - Net Cost: $8.0 - $5.16 = $2.84 per share - Maximum Profit: ($35 - $30) - $2.84 = $2.16 per share - Potential Profit: (2.16 / 2.84) * 100 = 76.06%
Potential Scenarios: - If GLW exceeds $35 at expiration, the maximum profit is $2.16 per share. - If GLW stays below $30, the maximum loss is limited to the net cost of $2.84 per share.
Conclusion
Among these options, each choice offers a different balance of risk and reward over various time horizons. The near-term option expiring on 2024-05-24 provides a high potential profit but with a shorter timeframe. The longer-term options, such as those expiring in mid-2025 and early 2026, offer more time for the stock to appreciate, albeit with an increased risk due to larger premiums and delayed potential gains. Each choice fits different risk appetites and market outlooks while minimizing the risk of assignment by keeping the options slightly OTM or ATM.
Spread Option Strategy
A calendar spread strategy, which involves buying and selling options with the same strike price but different expiration dates, can be a powerful tool for taking advantage of time decay and volatility. For Corning Incorporated (GLW), I have analyzed both the long call and short put options, considering "the Greeks" to assess profitability and risk. Given that we are executing a calendar spread by buying a call option and selling a put option within the same expiration cycle, here are five optimal choices from different time frames:
Near-Term Options (Expiring in 2 Days)
- Buy Call Option: Strike $30, Expiration 2024-05-24
- Greeks: Delta: 0.994, Gamma: 0.006, Vega: 0.044, Theta: -0.012, Rho: 0.0016
- Premium: $4.00
- Profit: $2.8577
- Risk: With a delta near 1, this deep ITM option has a high likelihood of assignment risk if the stock moves sharply.
Sell Put Option: Strike $30, Expiration 2024-05-24 - Greeks: Delta: -0.0019, Gamma: 0.0026, Vega: 0.0165, Theta: -0.0036, Rho: -0.000004 - Premium: $0.30 - Profit: $0.30
Analysis: This combination has very low risk for the put option, since its delta is almost zero, meaning the probability of assignment is extremely low. The high ROI from the call option, paired with the near-certain premium from the put, makes this promising for quick gains.
Short-Term Options (Expiring in 9 Days)
- Buy Call Option: Strike $32, Expiration 2024-05-31
- Greeks: Delta: 0.964, Gamma: 0.031, Vega: 0.441, Theta: -0.011, Rho: 0.0076
- Premium: $1.85
- Profit: $3.0077
- Risk: The risk of assignment is moderate with a delta close to 1.
Sell Put Option: Strike $32, Expiration 2024-05-31 - Greeks: Delta: -0.176, Gamma: 0.0503, Vega: 1.47, Theta: -0.0739, Rho: -0.0017 - Premium: $0.10 - Profit: $0.10
Analysis: The call option offers a good profit with a reasonable premium, and the put option's delta suggests a low assignment risk. This combination balances profitability with moderate risk.
Medium-Term Options (Expiring in 30 Days)
- Buy Call Option: Strike $31, Expiration 2024-06-21
- Greeks: Delta: 0.960, Gamma: 0.025, Vega: 0.832, Theta: -0.0049, Rho: 0.0243
- Premium: $3.10
- Profit: $2.7577
- Risk: This option offers a moderate delta with lower assignment risk.
Sell Put Option: Strike $31, Expiration 2024-06-21 - Greeks: Delta: -0.093, Gamma: 0.014, Vega: 2.40, Theta: -0.016, Rho: -0.0063 - Premium: $0.1 - Profit: $0.1
Analysis: The call option has a strong profit potential with moderate premium costs, while the put option has a manageable risk, making this spread attractive for a month-long outlook.
Longer-Term Options (Expiring in 86 Days)
- Buy Call Option: Strike $29, Expiration 2024-08-16
- Greeks: Delta: 0.896, Gamma: 0.025, Vega: 2.97, Theta: -0.0067, Rho: 0.0586
- Premium: $6.6
- Profit: $1.2577
- Risk: The delta suggests higher ITM probability, posing higher assignment risk.
Sell Put Option: Strike $29, Expiration 2024-08-16 - Greeks: Delta: -0.140, Gamma: 0.026, Vega: 2.57, Theta: -0.0022, Rho: -0.0099 - Premium: $1.0 - Profit: $1.0
Analysis: This strategy leverages the theta decay, given the longer expiration which increases the time for the premium on the put to decay while capturing upside on the call.
Long-Term Options (Expiring in Over 6 Months)
- Buy Call Option: Strike $25, Expiration 2025-01-17
- Greeks: Delta: 0.950, Gamma: 0.0023, Vega: 1.90, Theta: 0.0007, Rho: 0.2188
- Premium: $10.2
- Profit: $3.623
- Risk: High delta, therefore at significant risk of early assignment if the stock rallies.
Sell Put Option: Strike $25, Expiration 2025-01-17 - Greeks: Delta: -0.055, Gamma: 0.0095, Vega: 3.27, Theta: -0.0026, Rho: -0.0153 - Premium: $0.32 - Profit: $0.32
Analysis: This combination uses a deep ITM call for substantial profit opportunities while the low delta of the put reduces assignment risk, making it a safer long-term bet.
Conclusion
For the calendar spread strategy involving buying a call and selling a put, the near-term options for rapid gains with moderate risk, and medium to long-term options provide optimal balance between risk and reward while taking advantage of theta decay. Each choice encompasses the trade-off between premium invested and the potential profit while minimizing assignment risk. The strategies presented focus on achieving favorable outcomes while ensuring manageable risks through strategic selection of the most suitable expiration cycles and strike prices.
Calendar Spread Option Strategy #1
A calendar spread options strategy involves holding a long position in an option of a particular expiration date and a short position in an option of the same type but different expiration date. In your approach, you are utilizing a combination of long put options data and short call options data. However, you need to mitigate the risk of the short call options expiring in-the-money (ITM) which could lead to an assignment of the underlying shares. Here, careful consideration of "the Greeks" for each option, particularly delta, is essential in guiding the selection of the optimal options pair.
Given the lack of specific data for long put options, the focus will be on selecting the best short call options to pair with put options you might decide to utilize. The delta measures the sensitivity of the option's price to changes in the price of the underlying asset, with higher deltas implying a higher probability of finishing ITM. To minimize assignment risk, we'd ideally want lower delta calls in conjunction with effective long put options.
Short-Term Strategy
- 2024-05-24 Expiration, $36 Strike
- Greek Values: Delta 0.6058, Gamma 0.7632, Vega 1.0289, Theta -0.0492, Rho 0.0012.
- Premium: $0.25.
- As this is short term and the delta is moderate, there's a slight risk of ITM outcome, but the high ROI (100%) makes it attractive for short term profit. Coupling with a corresponding long-term, out-of-the-money put option could potentially benefit from a price drop protecting the strategy.
Near-Term Strategy
- 2024-06-07 Expiration, $35 Strike
- Greek Values: Delta 0.8256, Gamma 0.2025, Vega 1.9347, Theta -0.0109, Rho 0.0125.
- Premium: $1.03.
- This call option's delta is somewhat high, indicating a significant risk of assignment but it comes with a respectable premium. Proper hedging with a put option can offer a balanced strategy and the high vega indicates this option benefits significantly from changes in implied volatility.
Intermediate Strategy
- 2024-08-16 Expiration, $35 Strike
- Greek Values: Delta 0.6431, Gamma 0.0958, Vega 6.4621, Theta -0.0088, Rho 0.0496.
- Premium: $2.05.
- Offers a balanced risk profile with moderate delta and high vega, meaning it can benefit from volatility. Plenty of time value given the later expiration, thus positioning against a potential decrease in stock price.
Long-Term Strategy
- 2025-01-17 Expiration, $30 Strike
- Greek Values: Delta 0.8164, Gamma 0.0298, Vega 7.1649, Theta -0.0044, Rho 0.1477.
- Premium: $6.20.
- This call further out has a high delta, indicating significant ITM risk but it also has high vega suggesting large benefits from volatility shifts. Using a corresponding OTM put could balance the exposure to large market movements.
Very Long-Term Strategy
- 2026-01-16 Expiration, $35 Strike
- Greek Values: Delta 0.5954, Gamma 0.0305, Vega 16.6971, Theta -0.0036, Rho 0.2688.
- Premium: $5.16.
- With a moderate delta and extremely high vega, this option is less likely to be assigned compared to more aggressive deltas, while still providing strong exposure to volatility. Given nearly two years until expiration, it pairs well with any longer-term bearish strategies using put options.
The inherent risk with each of these strategies largely depends on the movement of GLW's stock price and volatility. Each analysis provides a unique pro and con based on Greeks, with a clear emphasis on premium values and likelihood of ITM assignment. In pairing with long put options, ensure they also offer favorable delta and gamma profiles to maximize protection and alignment with your predicted market movements.
By analyzing short call options in conjunction with potential long puts, the strategy should be dynamically adjusted according to market sentiment and implied volatility to harness the predicted 2% target stock price move while minimizing assignment risk.
Calendar Spread Option Strategy #2
Calendar Spread Options Strategy for Corning Incorporated (GLW)
A calendar spread options strategy, also known as a time spread, involves purchasing an option with a longer expiration date while simultaneously selling an option with a shorter expiration date but the same strike price. To optimize profitability and minimize risk, particularly the risk of early assignment of shares, one can creatively modify this setup to include buying calls and selling puts at different strike prices and expiration dates. Below is an analysis tailored towards achieving a profitable and less risky calendar spread using the provided data for Corning Incorporated (GLW).
Risk and Profit Analysis
- Near-Term Strategy (June 21, 2024)
- Sell Put: Strike $36, Expiration June 21, 2024
- Delta: 0.556
- Premium: $0.5
- ROI: 100%
- Profit: $0.5
- Buy Call: Strike $35, Expiration January 17, 2025
- Delta: 0.607
- Premium: $3.2
- ROI: 87.575%
- Profit: $2.8024
Potential Profit and Loss: - An ideal scenario sees the stock price oscillating around the strike prices ($35-$36) at expiration. The premium collected from the put option ($0.5) offsets some of the cost of the call option ($3.2) for a net outlay of $2.7. - Max Loss: Limited to the net premium paid ($2.7), assuming stock price falls significantly below $35.
- Medium-Term Strategy (August 16, 2024)
- Sell Put: Strike $36, Expiration August 16, 2024
- Delta: 0.541
- Premium: $1.35
- ROI: 100%
- Profit: $1.35
- Buy Call: Strike $35, Expiration January 17, 2025
- Delta: 0.607
- Premium: $3.2
- ROI: 87.575%
- Profit: $2.8024
Potential Profit and Loss: - Reduces the capital outlay to $1.85 ($3.2 - $1.35), making it less risky while maintaining a good potential return. - Max Loss: Limited to net premium paid ($1.85), assuming stock price falls significantly below $36.
- Extended-Term Strategy (November 15, 2024)
- Sell Put: Strike $37, Expiration November 15, 2024
- Delta: 0.476
- Premium: $1.75
- ROI: 100%
- Profit: $1.75
- Buy Call: Strike $35, Expiration January 17, 2025
- Delta: 0.607
- Premium: $3.2
- ROI: 87.575%
- Profit: $2.8024
Potential Profit and Loss: - Premium received from the put option is higher, reducing the capital outlay to $1.45 ($3.2 - $1.75). - Max Loss: Limited to the net premium paid ($1.45), minimizing risk.
- Long-Term Strategy (January 17, 2025)
- Sell Put: Strike $30, Expiration January 17, 2025
- Delta: 0.816
- Premium: $6.2
- ROI: 12.941935%
- Profit: $0.8024
- Buy Call: Strike $30, Expiration June 20, 2025
- Delta: 0.763
- Premium: $7.1
- ROI: 23.977464%
- Profit: $1.7024
Potential Profit and Loss: - Larger capital outlay of $0.9 ($7.1 - $6.2), but higher potential gains from anticipated stock price increases. - Max Loss: Limited to the net premium paid ($0.9), lower due to high offset from the sold put option.
- Extra Long-Term Strategy (June 20, 2025)
- Sell Put: Strike $30, Expiration June 20, 2025
- Delta: 0.763
- Premium: $7.1
- ROI: 23.977464%
- Profit: $1.7024
- Buy Call: Strike $30, Expiration January 16, 2026
- Delta: 0.599
- Premium: $5.16
- ROI: 92.294573%
- Profit: $4.7624
Potential Profit and Loss: - Very long-term strategy entails a considerable premium outlay with a net profit potential from good deltas and higher stock price movements. - Max Loss: Narrowed down to net premium ($5.16 - $7.1) paid, hedging against large stock price sway risks.
Conclusion
Each of these strategies presents an opportunity to leverage time decay and volatility changes across various expiration periods. By carefully selecting the strike prices and expiry dates, risk can be minimized while maximizing profit potential. The strategies suggested progressively reduce the immediate capital outlay with near-term options having a lesser risk while long-term ones offer better potential returns.
Moreover, emphasis should remain on managing delta risks and ensuring continuous monitoring to adjust positions as the stock price approaches the target range, considering market conditions.
Similar Companies in Hardware, Equipment & Parts:
OSI Systems, Inc. (OSIS), Fabrinet (FN), Jabil Inc. (JBL), Vicor Corporation (VICR), TE Connectivity Ltd. (TEL), Littelfuse, Inc. (LFUS), Sanmina Corporation (SANM), Celestica Inc. (CLS), Plexus Corp. (PLXS), Flex Ltd. (FLEX), Amphenol Corporation (APH), TTM Technologies, Inc. (TTMI), 3M Company (MMM), Corning Incorporated (GLW), AVX Corporation (AVX), Thermo Fisher Scientific Inc. (TMO), Amcor PLC (AMCR), O-I Glass, Inc. (OI)
https://seekingalpha.com/article/4687609-corning-incorporated-glw-q1-2024-earnings-call-transcript
https://finance.yahoo.com/news/why-corning-glw-top-momentum-135011071.html
https://finance.yahoo.com/news/corning-incorporated-nyse-glw-q1-151103059.html
https://finance.yahoo.com/news/corning-announces-quarterly-dividend-142200309.html
https://finance.yahoo.com/news/decoding-corning-inc-glw-strategic-050534473.html
https://finance.yahoo.com/news/corning-first-quarter-2024-earnings-113803524.html
https://finance.yahoo.com/news/corning-nyse-glw-due-pay-101452308.html
https://finance.yahoo.com/news/insider-sale-senior-vice-president-230150209.html
https://finance.yahoo.com/news/corning-participate-j-p-morgan-121500103.html
https://www.sec.gov/Archives/edgar/data/24741/000143774924014319/glw20240331_10q.htm
Copyright © 2024 Tiny Computers (email@tinycomputers.io)
Report ID: fr9wW0
Cost: $0.59124
https://reports.tinycomputers.io/GLW/GLW-2024-05-21.html Home