U.S. Global GO GOLD and Precious Metal Miners ETF (ticker: GOAU)
2024-01-15
 The U.S. Global GO GOLD and Precious Metal Miners ETF (ticker: GOAU) is an exchange-traded fund that focuses on providing investors with exposure to companies engaged in the production of precious metals such as gold, silver, and other precious minerals. The fund is designed to track the performance of the U.S. Global GO GOLD and Precious Metals Miners Index, which comprises a mix of small- to mid-capitalization companies that are actively involved in the mining for gold and precious metals. One of the distinguishing features of GOAU is that it does not strictly follow market capitalization weighting, instead employing a quantitative approach that also considers factors such as balance sheets, profitability, and revenue growth to select and weight companies. This strategic approach aims to optimize returns by investing in miners that are believed to offer the best growth and return potential, rather than just their size or market liquidity. Additionally, the ETF may benefit from the typically defensive nature of gold and precious metals, which are often sought after by investors as a potential hedge against market volatility and inflation.
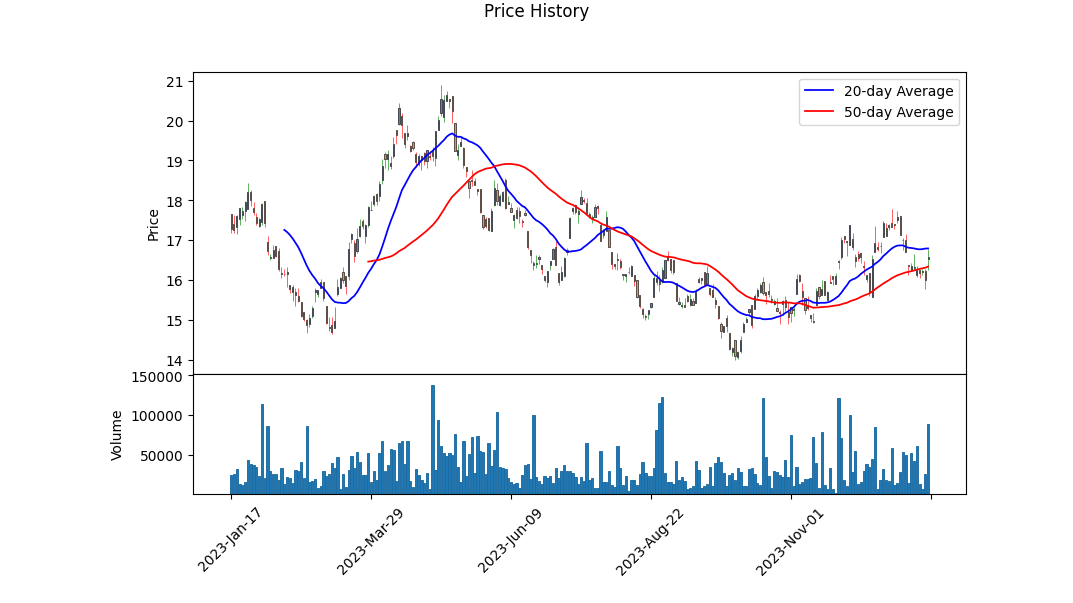
| Previous Close | 15.9964 | Open | 16.52 | Day Low | 16.26 |
| Day High | 16.79 | Volume | 89,004 | Average Volume (10 days) | 41,090 |
| Bid | 13.36 | Ask | 17.25 | Bid Size | 800 |
| Ask Size | 900 | Trailing P/E | 15.577782 | Yield | 0.99% |
| Total Assets ($) | 91,198,384 | 52 Week Low | 14.00 | 52 Week High | 20.88 |
| Fifty Day Average | 16.33952 | Two Hundred Day Average | 16.866175 | Nav Price | 16.5407 |
 Upon reviewing the recent performance, technical indicators, and fundamental data of the U.S. Global GO GOLD and Precious Metal Miners ETF (GOAU), several observations can be made to evaluate its potential future stock price movement.
Technical Analysis Summary:
- The Moving Average Convergence Divergence (MACD) histogram, a trend-following momentum indicator, shows negative values in recent sessions. This suggests bearish momentum may be present, although the histogram is less negative at the close of the last trading day, indicating possible slowing of downward momentum.
- Parabolic SAR (PSAR) indicators demonstrate a bearish sentiment as the PSAR values are above the price. This indicates a downtrend with potential continuation unless the price moves above the PSAR, which would suggest a reversal.
- The On Balance Volume (OBV) indicates selling pressure as the volume on down days appears to outweigh the volume on up days, leading to a negative OBV.
Fundamentals and Analyst Expectations:
- The PE Ratio (TTM) of 15.58 is at a moderate level, suggesting that GOAU is not overly expensive relative to earnings, which could be positive for price stability.
- The moderate yield of 0.99% may offer an attractive income component to investors, particularly in sectors that typically do not offer a high yield.
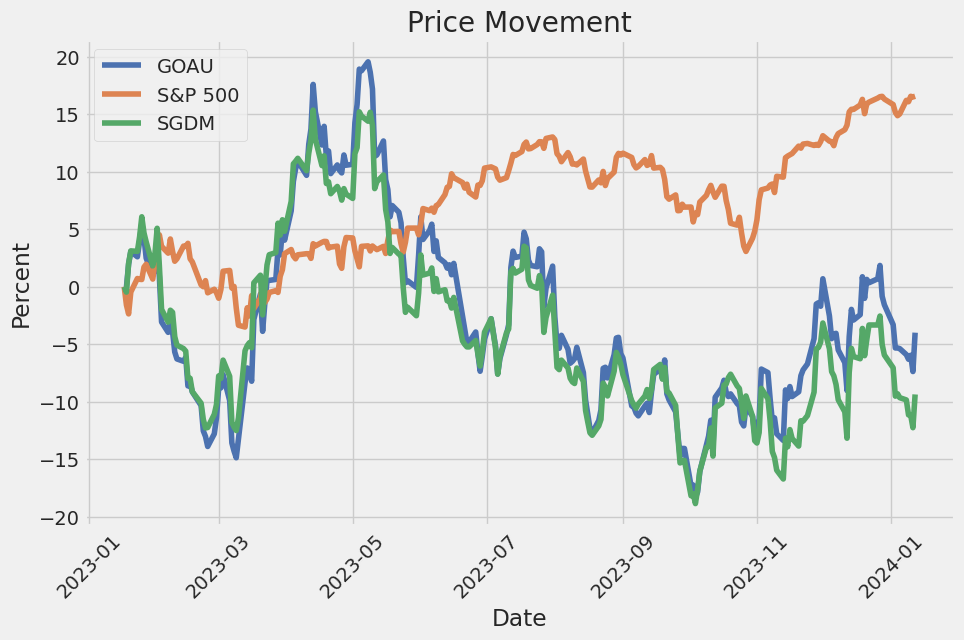
- A negative YTD Daily Total Return of -2.46% indicates that the fund has underperformed this year, potentially affecting investor sentiment.
- With beta relatively close to 1.10, the ETF exhibits volatility that closely mirrors the broader market.
- The Expense Ratio of 0.60% while not excessive, is a factor for investors to consider as it impacts net returns.
- Net Assets of $91.2M reflect a fund of modest size in the ETF space, which may affect liquidity and price stability.
Market and Economic Synopsis:
An analysis that does not consider external market factors would be incomplete. Current market dynamics, including interest rate trends, commodity prices (especially precious metals), and economic indicators, have a profound impact on sectors related to precious metal mining. The ETF's movement will likely be influenced by these larger forces in conjunction with the fund's individual performance.
Prognosis for the Next Few Months:
Considering the bearish technical indicators such as the current positioning of the PSAR and negative OBV, there may be some immediate headwinds facing GOAUs stock price. However, the improving MACD histogram suggests that downward momentum could be losing steam which might lead to stabilization or a potential reversal if positive catalysts emerge.
The funds fundamentals provide a mixed outlookmoderate valuations and yield may support the price, but recent underperformance could dampen investor enthusiasm. Macro forces, especially changes in commodity prices, will likely remain key determinants of the ETF's trajectory.
Given these factors, a cautious approach is warranted. While the technical aspects lean towards a bearish outlook in the short term, any shifts in market sentiment toward the precious metals sector or signs of significant buying pressure could redefine the trend. Therefore, investors should monitor both technical indicators and sector-specific news closely in the coming months.
| Statistic Name | Statistic Value |
| Alpha () | 0.0216 |
| Beta () | 0.5690 |
| R-squared | 0.103 |
| Adjusted R-squared | 0.102 |
| F-statistic | 143.3 |
| Prob (F-statistic) | < 2.44e-31 |
| Log-Likelihood | -2782.8 |
| AIC | 5570 |
| BIC | 5580 |
| No. Observations | 1,256 |
| Df Residuals | 1254 |
| Df Model | 1 |
The estimated alpha () for the linear regression model between GOAU and SPY is 0.0216, which represents the expected return of the GOAU when the SPY has zero return, essentially measuring the intercept of the regression line. Although alpha is positive, with a value of 0.0216, its statistical insignificance is demonstrated by a high p-value (0.731) indicating that there is a high probability that the true alpha could be zero or negative in the population. The model's beta () of 0.5690 suggests that GOAU moves, on average, 0.5690 units for every unit change in SPY, indicative of GOAUs systematic risk or its sensitivity to market movements.
Despite GOAU having some level of correlation with SPY, as evidenced by its positive beta, the R-squared of the model at 0.103 implies that only about 10.3% of the variability in GOAU's returns can be explained by movements in SPY. This low R-squared figure together with a relatively wide 95% confidence interval for the beta coefficient ([0.476, 0.662]) suggests that external factors aside from the market index SPY or inherent characteristics specific to GOAU could be driving its price movements. Considering GOAU's performance independently from SPY might thus be essential in assessing its value and risk.
The U.S. Global GO GOLD and Precious Metal Miners ETF (GOAU) offers investors an innovative and focused approach to accessing the world's leading gold and precious metal miners. Its strategy encompasses a blend of technical and quantitative analysis aimed at pinpointing financially robust companies that are positioned to effectively navigate through market cycles. The ETF also gives an emphasis on firms that engage in the royalty and streaming space, which often leads to a more stable and profitable business model compared to direct miners due to their lower operating costs.
Royalty and streaming companies act as a specialized finance segment intersecting with the mining industry. These companies typically provide upfront capital to miners for the right to purchase a portion of their future production at a preset price, or to receive a percentage of revenue derived from the mine's production. This could mean more predictable cash flows and potentially lower risk for companies in the GOAU ETF that engage in these practices.
What sets GOAU apart from traditional mining and metals ETFs is its concentration on quality traits, using revenue growth, balance sheet strength, and return on invested capital as key metrics. These factors are significant in the sector due to the capital-intensive nature of mining and the volatility of commodity prices. By focusing on companies with solid fundamentals, GOAU can potentially offer a more resilient investment compared to ETFs that might allocate more heavily towards junior and mid-tier miners that can carry higher operational and financial risk.
A strategic feature of the GOAU ETF is its allocation model. Typically, around 30% of the ETF is dedicated to royalty and streaming companies. This allocation is higher than most other precious metal ETFs, which commonly have a greater focus on mining and exploration companies. As a result, GOAU may provide a more balanced and diversified means of gaining exposure to precious metals, which is essential in uncertain economic times.
The ETF also represents an international approach to precious metal investments, as it holds equities listed in various countries. As of the latest dataset, companies based in Canada, the United States, South Africa, and Latin America are among the top holdings, presenting a well-rounded global portfolio.
Focusing on the ETF composition provides further insight. Within its holdings, some stocks stand out due to their significant allocation. Consider the following table, which details the top ten holdings of the GOAU ETF:
| company | symbol | percent |
|---|---|---|
| Franco-Nevada Corp | FNV.TO | 10.10 |
| Wheaton Precious Metals Corp | WPM.TO | 10.02 |
| Royal Gold Inc | RGLD | 10.00 |
| Torex Gold Resources Inc | TXG.TO | 4.14 |
| Harmony Gold Mining Co Ltd ADR | HMY | 4.05 |
| Osisko Gold Royalties Ltd | OR.TO | 4.05 |
| Sandstorm Gold Ltd | SSL.TO | 4.05 |
| Sibanye Stillwater Ltd ADR | SBSW | 3.64 |
| OceanaGold Corp | OGC.TO | 3.31 |
| Compania de Minas Buenaventura SAA ADR | BVN | 3.20 |
Given the impressive performance and steady yields of royalty companies, it's not surprising to see Franco-Nevada Corp, Wheaton Precious Metals Corp, and Royal Gold Inc. at the top of the holdings list, each with around 10% of the fund's weight. These established players have proven their ability to manage risks associated with precious metal pricing and mining operations effectively, reflecting a fundamental strength that can resonate with investor confidence.
The influence of these top holdings on the performance of the ETF can be significant. With these companies having robust financials, a diversified portfolio of assets, and often lower capital and operating costs, they can potentially offer more stability to the performance of GOAU amidst the fluctuations in the prices of gold and other precious metals.
The remaining holdings listed, such as Torex Gold Resources Inc and Harmony Gold Mining Co Ltd ADR, among others, add diversity to the ETF's portfolio and provide exposure to various aspects of the precious metals mining industry, including geographical and operational diversity.
To summarize the volatility of the U.S. Global GO GOLD and Precious Metal Miners ETF (GOAU) based on the data from January 16, 2019, to January 12, 2024, here are three key points:
- The ETF experienced a level of fluctuation in its returns, as indicated by a non-zero omega value (4.7724), suggesting a baseline level of volatility in the price movements of the ETF.
- The volatility was affected by past returns, with the alpha[1] coefficient being significant (0.1122) and indicating that previous returns had a meaningful impact on future volatility.
- The statistical significance of the omega and alpha values, as well as their confidence intervals, reveals that the observed volatility patterns are robust and not due to random chance.
Now here's how you can represent this volatility information in an HTML table:
```html
| Statistic Name | Statistic Value |
|---|---|
| Mean Model | Zero Mean |
| omega | 4.7724 |
| alpha[1] | 0.1122 |
| Log-Likelihood | -2,827.40 |
| AIC | 5,658.80 |
| BIC | 5,669.07 |
| No. Observations | 1,256 |
| p-value for omega | < 5.615e-40 |
| p-value for alpha[1] | 0.01227 |
| Conf. Int. for omega | [4.066, 5.479] |
| Conf. Int. for alpha[1] | [0.02439, 0.200] |
```
To assess the financial risk associated with a $10,000 investment in the U.S. Global GO GOLD and Precious Metal Miners ETF (GOAU) over a one-year period, we employ a twofold analysis approach, combining volatility modeling and machine learning predictions. This multifaceted analysis seeks to provide a vivid understanding of the expected stock volatility and the forecast of potential future returns.
Volatility modeling serves as the foundation for our understanding of the inherent risk of the ETF's stock. Typically, the volatility of stock returns is not constant; it changes over time in response to market events. By employing the volatility modeling framework, we can capture the dynamic nature of risk and forecast future variances using historical data. This framework estimates periods of increased market uncertainty, typically through parameters that are contingent upon past variances and shocks to the returns.
In parallel, machine learning predictions are used to incorporate a variety of features beyond historical volatility, potentially including economic indicators, market sentiment, and fundamental analysis of the mining sector. Specifically, machine learning algorithms can unveil complex nonlinear patterns and interactions within the data that traditional statistical models might miss. The chosen machine learning model in this setup is designed to forecast future returns based on these identified patterns. It learns from the data, constantly updating its predictions in light of new information, and thus complements the volatility modeling by providing a different analytical perspective.
Combining the insights from both methods, we can predict a range of possible outcomes for the ETF and quantify the risk accordingly. In financial risk management, Value at Risk (VaR) is a commonly used statistic that quantifies the extent of potential financial losses within a firm, portfolio, or an investment over a specific time frame at a given confidence interval. It provides an estimate of the maximum loss expected, given normal market conditions and within the specified confidence level.
For our specific analysis of the $10,000 investment in GOAU, the computed annual VaR at a 95% confidence interval is $322.70. This figure is interpreted as follows: under normal market conditions, there is only a 5% chance that the investment in GOAU will lose more than $322.70 over a one-year period. This is an important metric for investors as it encapsulates a quantifiable risk level, allowing them to understand the potential downsides and make informed decisions based on their individual risk tolerance.
Our combined approach, factoring in the dynamic nature of the market with the forward-looking insights provided by predictive analytics, presents a comprehensive view of the potential risks in the GOAU ETF investment. It enables the investor to categorize the anticipated volatility and prospective returns within a probabilistic framework (the VaR), thus demarcating a boundary for expected financial exposure under typical market conditions over the given investment horizon.
Similar Companies in Exchange-Traded Funds:
Sprott Gold Miners ETF (SGDM), Global X Gold Explorers ETF (GOEX), Sprott Junior Gold Miners ETF (SGDJ), ETFMG Prime Junior Silver Miners ETF (SILJ), iShares MSCI Global Gold Miners ETF (RING), Newmont Corporation (NEM), Barrick Gold Corporation (GOLD), Franco-Nevada Corporation (FNV), Wheaton Precious Metals Corp. (WPM), Agnico Eagle Mines Limited (AEM), Kinross Gold Corporation (KGC), Royal Gold, Inc. (RGLD), Kirkland Lake Gold Ltd. (KL), Yamana Gold Inc. (AUY), B2Gold Corp. (BTG)
Copyright © 2024 Tiny Computers (email@tinycomputers.io)
Report ID: QDAL4A
https://reports.tinycomputers.io/GOAU/GOAU-2024-01-15.html Home