Home Depot, Inc. (ticker: HD)
2023-12-17
 Home Depot, Inc. (ticker: HD) stands as the largest home improvement retailer in the United States, serving do-it-yourselfers, professional contractors, and everything in between. Founded in 1978, the company operates an expansive network of big-box format stores across the U.S., Canada, and Mexico. With its headquarters in Atlanta, Georgia, Home Depot has built its brand on a foundation of providing a vast assortment of building materials, home improvement products, lawn and garden products, and decor products. The company also offers various services including installation and tool rental. In addition to its physical stores, Home Depot has a growing online presence, as e-commerce becomes an increasingly vital component of its business strategy. Financially robust, Home Depot has shown consistent sales growth and has a significant share of the home improvement retail market, making it a critical player and a bellwether in this sector. The company's stock, HD, forms part of the Dow Jones industrial average and is widely held by both institutional and retail investors.
| As of Date: 12/17/2023Current | 10/31/2023 | 7/31/2023 | 4/30/2023 | 1/31/2023 | 10/31/2022 | |
|---|---|---|---|---|---|---|
| Market Cap (intraday) | 352.32B | 284.71B | 334.17B | 304.35B | 329.36B | 302.05B |
| Enterprise Value | 399.52B | 331.39B | 382.34B | 351.95B | 376.61B | 348.17B |
| Trailing P/E | 22.69 | 17.77 | 20.33 | 18.01 | 19.54 | 18.19 |
| Forward P/E | 22.12 | 17.54 | 22.27 | 19.01 | 19.19 | 16.92 |
| PEG Ratio (5 yr expected) | 2.17 | 1.70 | 2.19 | 1.77 | 2.81 | 1.46 |
| Price/Sales (ttm) | 2.32 | 1.86 | 2.19 | 1.96 | 2.13 | 1.98 |
| Price/Book (mrq) | 246.38 | 213.27 | 923.13 | 193.75 | 253.74 | 1.27k |
| Enterprise Value/Revenue | 2.60 | 8.79 | 8.91 | 9.45 | 10.51 | 8.96 |
| Enterprise Value/EBITDA | 15.58 | 52.75 | 51.49 | 55.19 | 67.81 | 50.47 |
 Based on the provided technical analysis data for the last trading day, along with the fundamentals of the company, we can deduce the prospective stock price movements for the subsequent months. The technical indicators suggest robust activity in the stock with an Adjusted Close price at $354. The Moving Average Convergence Divergence (MACD) indicates a positive momentum as evidenced by a MACD value of 12.101827 and a MACD histogram value of 3.141548. The Relative Strength Index (RSI) is significantly high at 86.529397, suggesting that the stock may be in an overbought territory.
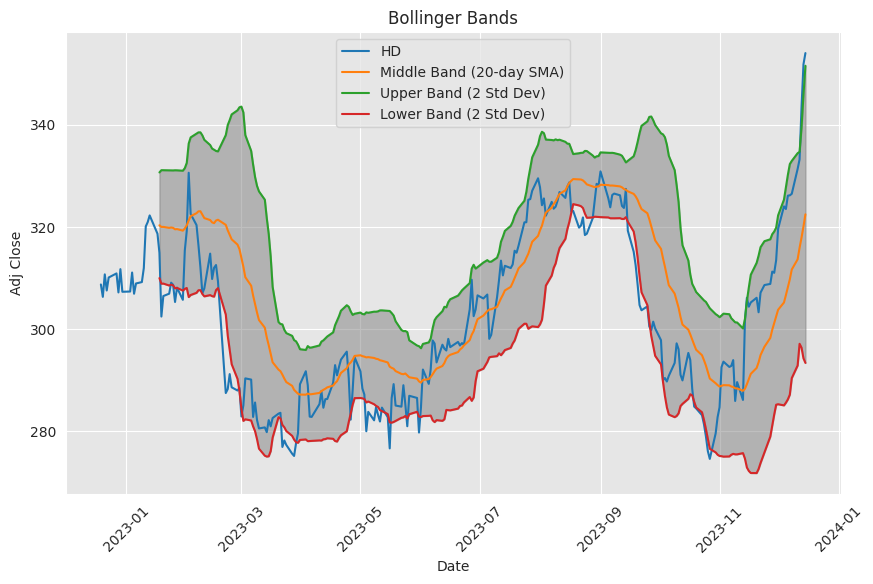
The Bollinger Bands show a closing price near the upper band, with values as follows: lower band at 324.185940, middle band at 342.747998, and upper band at 361.310056. This proximity to the upper band usually indicates strength but also can be a precursor to a potential pullback if the price is perceived to be extended. The Simple Moving Average (SMA) over 20 days stands at 322.454999, and the Exponential Moving Average (EMA) over 50 days is at 315.271889, both of which are below the current price, highlighting a clear uptrend.
The On-Balance Volume (OBV) presents a positive outlook with 3.749130 million, indicating healthy volume supporting the price uptrend. Stochastic oscillators are extremely high with %K at 98.366321 and %D at 97.535533, both indicating overbought conditions and the possibility of a short-term reversal. An ADX value of 48.054997 shows a very strong trend in place. The Williams %R (WILLR) is at -0.829886, which is also signalling overbought conditions. The Chaikin Money Flow (CMF) is positive at 0.500224, suggesting buying pressure.
The Parabolic SAR (PSAR) indicates an uptrend with the value at 331.910004 and no indication of a downwards reversal, given the absence of a PSARs value.
Moving to the fundamentals, the company has shown an increase in market capitalization over the previous year, suggesting investor confidence. The company's trailing P/E ratio has increased and remains moderate, which could signify fair valuation given recent growth. The forward P/E ratio follows this trend, meaning the market has positive expectations for earnings growth. The Price/Sales and Enterprise Value/Revenue ratios have also increased, indicating a higher valuation against sales.
The financial summary points to a healthy increase in Normalized EBITDA, Net Income, and Diluted EPS, which underpins the company's solid operational performance and profitability. The increase in Operating Income and Gross Profit reinforces the company's ability to grow revenue and manage costs effectively.
Integrating both the technical indicators and fundamental data, it appears that the stock is experiencing a dynamic period with a notable uptrend, albeit coupled with signs of being overextended in the shorter term. The strong financial performance could help sustain investor sentiment, but the high RSI and proximity to the upper Bollinger Band suggest caution for the near-term price action. Over the medium to long-term, should the company continue with strong financial performance, we can expect the stock's price to stabilize and potentially continue its upward trajectory, as supported by solid fundamentals. However, it is essential to watch for reversal patterns or signs of consolidation in the coming months that might emerge in response to the current overbought conditions. It is also important to consider market-wide economic conditions in the forthcoming period, which may influence stock price movements beyond company-specific factors.
Home Depot, Inc. (HD) has long been a behemoth in the retail home improvement market, experiencing notable fluctuations that mirror broader economic trends. Amid these market dynamics, one cannot overlook the underpinning elements that led to a significant downturn in its stock pricea decline exceeding 25% from its pandemic-era peak. This section delves into the reasons behind this shift, providing a nuanced perspective on Home Depot's recent financial trials and their implications for the company's enduring market prospects.
During the peak of the pandemic, Home Depot observed a sales surge, buoyed by a robust housing market spurred by low interest rates. Homeowners, confined within their dwelling spaces, redirected disposable incomes towards renovations and upgrades. This wave of consumer spending on home improvements played into Home Depots strengths, leading to a period of stellar financial performance for the company.
Post-pandemic economic conditions, however, have presented new hurdles. Interest rate hikes by the Federal Reserve to address rising inflation have indirectly affected Home Depot. As mortgage rates soared, housing market activities contracted, leading to subsequent diminishments in home improvement demands. This climate shift manifested in Home Depot's third-quarter earnings report, showing a 3.1% fall in comparable store sales and a 10% slip in earnings per share.
Despite the economic headwinds, Home Depot's long-term prospects feature glimmers of hope. The housing market's cyclical nature suggests that the present pressures might eventually abate. Should the Federal Reserve's forward-looking statements come to fruition, with a lowering of the federal funds rate, the housing marketand by extension Home Depotmay very well witness a rebound, revitalizing the demand for home improvement products and services.
The company's strategy remains steadfast in focusing on an enhanced omnichannel platform, aiming to optimize the customer shopping experience. A significant pillar of this strategy has been Home Depot's focus on the professional contractor segment, a demographic that has persistently generated solid performance figures. Secured in a near-duopoly with Lowe's Companies, Home Depot enjoys formidable market power, underscored by high barriers to entry that have traditionally facilitated the sustenance of lofty profit margins.
It is within these transitional economic conditions that the recent dip in Home Depot's stock price finds its contextas a reaction more to macroeconomic shifts than to intrinsic corporate deficiencies. For investors who trust in Home Depots strategic market position, established brand, and operational scalability, the stocks downturn may present a strategic opportunity.
Reporting a 3% decline in revenue and a lowering of earnings per share by 10%, this period might be viewed as a downturn for Home Depot. However, it is essential to position it within the broader market context, considering factors such as shifting consumer spending patterns and interest rate fluctuations. The company's financial performance aligns with its management's projections, bearing witness to Home Depots adaptability amidst fluctuating retail industry climates.
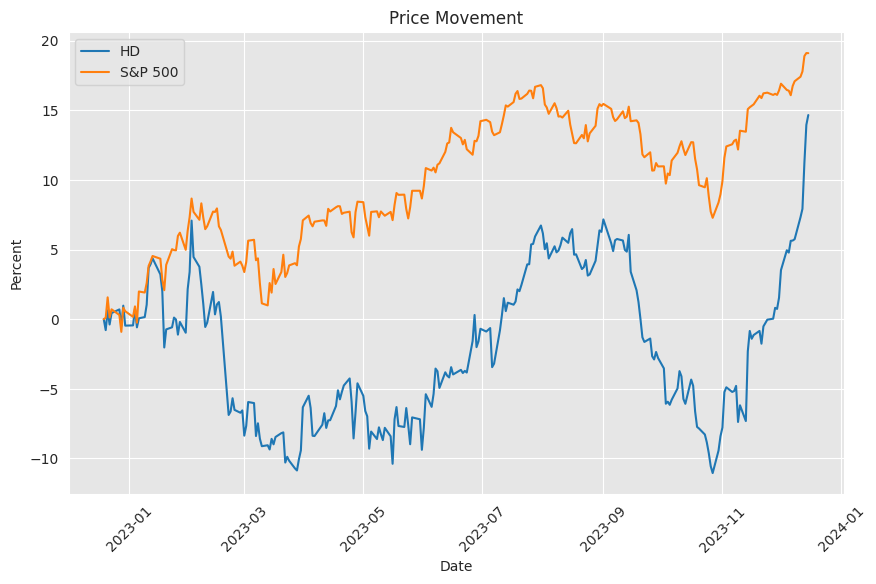
Home Depots comparative financial health can also be gauged against broader market measures. Despite recent slumps, the companys performance relative to indices like the SPY reveals a company whose financial foundations remain sturdy. Dividend growth and yields remain pivotal factors for investor assurance and Home Depot's ability to sustain and possibly expand its dividends despite the broader economic malaise, underscores a level of financial resilience worthy of investor confidence.
The home improvement giant's journey through a fluctuating economy has not gone unnoticed by financial analysts. In a fresh analysis, Daniel Miller points to Home Depot as one of the three captivating dividend stock prospects, signaling potential appreciation in 2024. Even with a performance lag compared to the broader S&P 500, Home Depot continues to overshadow Lowe's, its direct market rivala testament to its strategic focus on the professional contractor segment.
Moreover, Home Depot's dividend performance reinforces its appeal, boasting a yield of 2.5% and a history of consistent dividend growth. For dividend investors seeking reliable income with a potential for stock appreciation, Home Depot holds promise. It stands resilient in the industry compared to peers, emphasizing the company's capability to maintain market dominance and enhance shareholder value through consistent dividends.
In parallel, ETFs focusing on dividend-paying stocks like SCHD and VYM have grappled with the challenge of generating satisfactory returns due to the overvaluation of dividend stocks and broader economic headwinds. Both ETFs have seen performance dips, particularly in the wake of rising interest rates and inflationary pressures. With underwhelming yield performance and poor growth prospects, some ETFs appear less attractive, leading to suggestions for alternative investment approaches such as the "barbell" strategy. This strategy advocates balancing low-risk treasuries or CDs with potentially higher-growth equities that might not pay dividends, potentially offering a more sustainable path for income and value accumulation over time.
The DJIA's emergence into bull market territory represents a significant trend with historical data indicating promising returns during such market phases. Stocks within this index, which include household names like Salesforce and Microsoft, contribute to the overall momentum. For diversified investment strategies, Home Depot also figures as a vital component of the DIA ETF, sharing in the DJIA's resilient economic narrative. Following the historical trajectories of the DJIA and Home Depot's placement within it, investors may look favorably upon the DJIAs long-term wealth creation potential, even if individual stock selection or ETF investments should align with their own risk tolerances and investment goals.
Amidst contemplations of potential market shocks and shifts towards a deflationary environment, Home Depot's vigilant assessment of retail pricing trends and consumer demand remains crucial. The company's stock may well be impacted by broader deflationary trajectories or reversals in consumer spending patterns. However, Home Depot's established resilience and operational efficacy suggest an equipped response to such macroeconomic changes, positioning it as a consideration-worthy entity amid market uncertainties.
Investors seeking long-term stability with progressive income might find solace in Home Depot's robust dividend growth potential. Despite occasional market dips, the companys substantial market cap, ongoing commitment to dividend increments, and resilience in outshaping competitors underscore its candidacy for a conservatively built investment strategy. Home Depot's blend of stability and methodical dividend growth positions it as a promising inclusion for diverse investment portfolios.
As part of the "Sleep Well" portfolio construction, Home Depot is identified as an essential component of the Dividend Growth Investing bucket. The resilience and potential for dividend growth of this stock complement the portfolio's diversification and risk management strategies, embodying a concept designed to sustain growth while minimizing potential downturns through balanced allocations across different investment categories. The blend of direct stock holdings and ETFs, alongside hedging mechanisms to protect against severe market losses, offers a comprehensive framework within which Home Depot secures its place. This performance, combined with strategic insights and personalization, can furnish investors with a well-rounded, secure investment directive, inclusive of Home Depot's proven market capability.
Home Depot's dividend considerations, as part of the Dividend Champions list, confirm the companys commitment to stable and potentially growing shareholder yields. Although not experiencing a dividend rise in the latest update, the company's enduring presence on the list signals reliability. Such consistency in dividend policies attracts a specific pedigree of investor looking for predictable income flows, particularly apt for long-term diversified portfolios.
Finally, Home Depot's financial robustness, dividend consistency, and growth prospects continue to draw attention. Competing favorably with established dividend payers like Coca-Cola, Home Depot holds a distinguished position in the retail sector. Its uninterrupted drive for operational innovation, customer-centric strategies, and alignment with industry momentum secures its status as a compelling investment for those eyeing dividend yields alongside potential capital gains.
Similar Companies in Home Improvement Retail:
Lowe's Companies, Inc. (LOW), Menard, Inc. (Private), Ace Hardware Corporation (Private), Builders FirstSource, Inc. (BLDR), 84 Lumber Company (Private), True Value Company (Private), Tractor Supply Company (TSCO)
News Links:
https://www.fool.com/investing/2023/12/01/these-stocks-are-down-more-than-25-percent-and-im/
https://seekingalpha.com/article/4658018-november-dividend-income-report
https://www.fool.com/investing/2023/12/15/3-overlooked-dividend-stocks-with-upside-in-2024/
https://seekingalpha.com/article/4655525-which-etf-disappoint-retirees-most-schd-or-vym
https://www.fool.com/investing/2023/12/15/dow-jones-hit-a-record-high-stocks-do-this-next/
https://seekingalpha.com/article/4653933-a-major-market-surprise-is-likely-coming
https://www.fool.com/investing/2023/11/22/2-spectacular-dividend-growth-stocks-you-can-buy-n/
https://seekingalpha.com/article/4656349-how-to-invest-100000-today-in-a-sleep-well-portfolio
https://www.fool.com/investing/2023/11/24/ignore-coca-cola-these-3-dividend-stocks-are-bette/
Copyright © 2023 Tiny Computers (email@tinycomputers.io)
Report ID: jzwJpH