Hewlett Packard Enterprise Company (ticker: HPE)
2024-05-13
 Hewlett Packard Enterprise Company (HPE) operates as a global edge-to-cloud platform-as-a-service company. It is primarily involved in the provision of information technology, technology, and enterprise products, solutions, and services to businesses and public sector clients. HPE's offerings encompass a broad range of hardware, software, and associated services, and its business units include Compute, High Performance Compute & Mission-Critical Systems, Storage, Advisory and Professional Services, and Financial Services. The company aims to empower its customers with open and intelligent technology solutions that seamlessly integrate across all their environments, thus facilitating new insights, unlocking new business models, and driving economic growth. HPE was officially launched in 2015, following its split from Hewlett-Packard Company. Its ability to innovate in areas like artificial intelligence, edge computing, and cybersecurity, while also focusing on sustainability and ethical practices, provides it with a competitive edge in the IT sector.
| Full Time Employees | 62,000 | Previous Close | 17.06 | Market Cap | 22,480,560,128 |
| Dividend Rate | 0.52 | Dividend Yield | 0.0305 | Total Revenue | 28,081,000,448 |
| Debt to Equity | 60.094 | Profit Margins | 0.06805 | Operational Cash Flow | 5,320,999,936 |
| Return on Assets | 0.02606 | Return on Equity | 0.09203 | Current Ratio | 0.894 |
| EBITDA | 4,998,000,128 | Price to Earnings (Trailing) | 11.927586 | Price to Earnings (Forward) | 8.4779415 |
| Price to Sales (Trailing 12 Months) | 0.80056125 | 52 Week Low | 13.79 | 52 Week High | 20.07 |
| Price to Book | 1.0496451 | Earnings Growth | -0.228 | Free Cash Flow | 1,750,499,968 |
| Beta | 1.217 | Total Cash | 2,985,999,872 | Total Debt | 12,901,000,192 |
| Book Value | 16.477 | Enterprise Value | 32,145,000,448 | Gross Margins | 0.35747 |
| EBITDA Margins | 0.17799 | Operating Margins | 0.086899996 | Total Cash Per Share | 2.297 |
| Sharpe Ratio | 0.7208380786774868 | Sortino Ratio | 11.606794075270967 |
| Treynor Ratio | 0.187745344616648 | Calmar Ratio | 1.5028668131437202 |
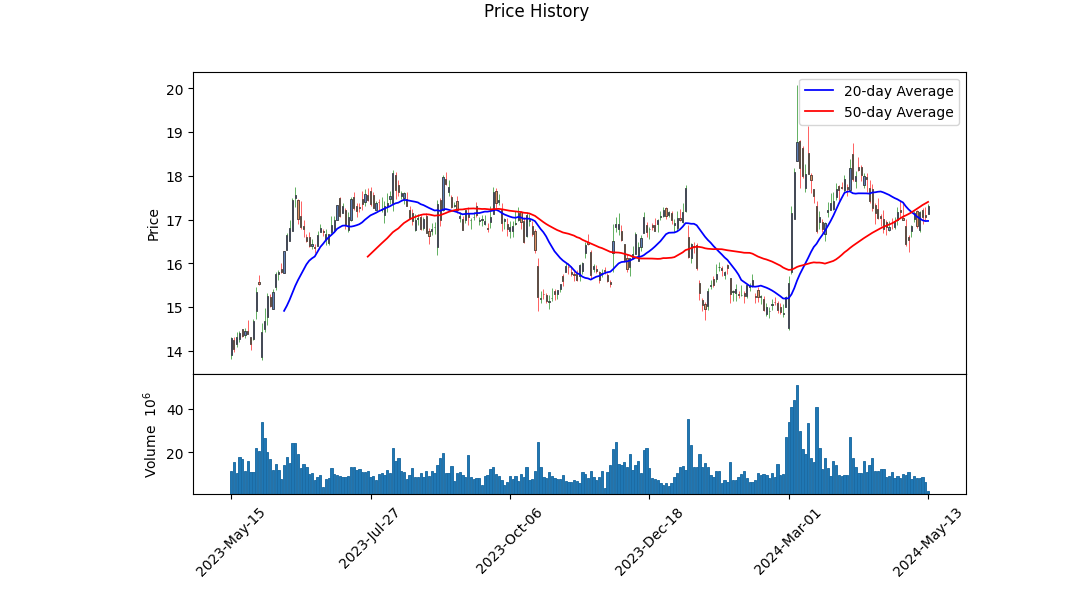
The evaluation of HPE's stock begins with an analysis of both its recent stock movements and fundamental performance. Scrutinizing the stocks trajectory from the provided TA table, the stock seemed to experience an uptrend from the 17th of January, with closing prices regularly peaking higher following a significant OBV (On-Balance Volume) upsurge, culminating in a fairly positive MACD histogram by May 10, indicating a strong bullish momentum. Such patterns suggest theres sustained investor interest and buying pressure, a decisive signal for potential continuation of growth.
From the fundamental perspective, considering the financials spanning data from 2020 to late 2023, significant improvements are seen in net income and reduced debt levels which highlight efficient management strategies and potentially improved operational efficiencies. The EBITDA and operating margins presented, while modest, are consistent and signify a stable operational status. These factors, traditionally key metrics for robust fundamental health, align to suggest resilience and cautious optimism in the operational strategy of the company.
The risk-adjusted performance ratios (Sharpe, Sortino, Treynor, and Calmar) further amplify this sentiment. Particularly notable is the Sortino ratio, standing impressively high at 11.6068, reflecting a favorable upward potential with lower downside risk when excess negative volatility is taken into account. The Calmar Ratio also substantially reinforces this viewpoint, indicating strong returns in relation to the maximum drawdown experienced.
Regarding user and market sentiment, the Altman Z-Score at 0.8336 prompts a careful review; this may signal financial distress as it lies below the safety threshold of 1.8 for manufacturing firms, suggesting a need for close monitoring on financial stability and obligations. The Piotroski score of 6 translates into a moderate to strong financial position but does not eliminate the necessity for cautious observation.
Therefore, while technical indicators show bullish signs, and most financial ratios indicate a sound operational strategy concerning risk-adjusted returns, the financial distress indication via Altman Z-Score might temper aggressive optimistic forecasts. The upcoming months could see sustained if not spectacular growth in HPEs stock price, backed by solid fundamentals but slightly hedged by cautious investor sentiment due to financial structural concerns. It is advisable for investors to keep an eye on forthcoming quarterly reports that may shed more light on the companys ongoing strategies to mitigate any concerning financial predicates and to leverage existing operational strengths for sustained growth.
In our analysis of Hewlett Packard Enterprise Company (HPE), we calculated key financial metrics to assess its investment potential as per the principles outlined in "The Little Book That Still Beats the Market." The Return on Capital (ROC) for HPE stands at 7.77%, which reflects the efficiency with which the company utilizes its capital to generate profits; though not exceptionally high, it suggests a reasonable level of operational effectiveness. Further, the Earnings Yield, calculated at 9.01%, offers insight into the profitability relative to the company's share price. This figure indicates that for every dollar invested in the purchasing of HPE shares, investors could potentially earn around 9 cents, which is comparably favorable and aligns with value investing principles focusing on obtaining earnings at a relatively low cost. Both metrics combined provide a solid foundation for considering HPE as a potential investment, subject to comparison against industry benchmarks and broader market conditions.
Based on the principles outlined by Benjamin Graham in "The Intelligent Investor," lets analyze how Hewlett Packard Enterprise Company (HPE) stands against these criteria:
-
Price-to-Earnings (P/E) Ratio: HPE has a P/E ratio of approximately 10.70, which significantly undercuts the industry average of 34.27. According to Graham's philosophy, a low P/E ratio might indicate that the stock is undervalued relative to its earnings, suggesting a potential investment opportunity, provided the companys fundamentals are solid.
-
Price-to-Book (P/B) Ratio: The P/B ratio of HPE is approximately 0.39. Graham often sought stocks trading below their book value, which HPE currently does, as this could imply that the stock is undervalued in the market, aligning with Grahams hunt for bargain stocks.
-
Debt-to-Equity Ratio: HPE shows a debt-to-equity ratio of roughly 0.58. While this doesn't land in the high-risk category, Graham preferred companies with very low debt-to-equity ratios to minimize financial risk. Nonetheless, HPEs ratio suggests a reasonable balance between debt financing and equity, which could be acceptable but may require further scrutiny under Graham's strict criteria.
-
Current and Quick Ratios: Both these ratios for HPE stand at about 0.87. These indicators measure the companys ability to cover its short-term liabilities with its short-term assets. A ratio under 1 might be a concern as per Graham's criteria since it suggests that current liabilities exceed current assets. This could indicate potential liquidity risks which Graham would likely be wary of.
-
Earnings Growth: Although specific historical data on earnings growth is not provided here, Graham would recommend an analysis of HPEs earnings consistency over multiple years. Stable or increasing earnings would be preferable to fit Grahams model of a financially sound investment.
Overall Assessment: Hewlett Packard Enterprise Company shows promise based on Grahams valued metrics such as P/E and P/B ratios, suggesting that the stock may be undervalued. However, the liquidity ratios (current and quick ratios) could pose a concern due to them being below 1, signaling potential short-term financial strains. The moderate debt-to-equity ratio is relatively satisfactory but would benefit from a closer examination of the company's financial structure and future liabilities.
Investors following Graham's principles might consider doing deeper due diligence on HPE's earnings stability and its ability to improve liquidity ratios. If the company shows robust fundamentals otherwise, it may indeed be a valuable pick as per the value investing approach emphasized by Benjamin Graham.# Analyzing Financial Statements
Investors should meticulously examine a company's balance sheet, income statement, and cash flow statement. Benjamin Graham, renowned as the father of value investing, emphasized the importance of understanding a company's assets, liabilities, earnings, and cash flows to make informed investment decisions. This analysis is crucial for identifying companies that are financially stable and potentially undervalued, principles that are core to Grahams investment philosophy.
Financial Stability and Health
To evaluate the financial health of Hewlett Packard Enterprise (HPE), it's important to assess various items from their financial statements:
1. Assets and Liabilities
From HPE's most recent quarterly report (Q1 2024): - Total Assets: $58,602,000,000 - Total Liabilities: $37,161,000,000 - Net Assets (Equity): $21,441,000,000
The ratio of liabilities to assets is approximately 63%, indicating a significant amount of assets are financed through debt. However, the equity position is robust, showing a solid base of financed assets through shareholders' equity.
2. Revenue and Net Income
- Revenue: $6,755,000,000
- Net Income: $387,000,000
The income figures reveal the profitability of HPE for the first quarter of 2024, with a net income margin (net income/revenue) of approximately 5.7%. This indicates how much of each dollar of revenues is converted into profits.
3. Cash Flow Statement Analysis
- Net Cash from Operating Activities: $64,000,000
- Net Cash from Investing Activities: -$740,000,000
- Net Cash from Financing Activities: $53,000,000
Cash flows from operating activities are positive, suggesting the company's core business activities are generating sufficient cash to sustain operations. However, the significant cash outflows from investing activities emphasize HPEs focus on expanding and upgrading its asset base.
Liquidity and Solvency
-
Current Ratio (Current Assets/Current Liabilities): From the given figures, HPE's current assets are $20,244,000,000 and current liabilities are $22,635,000,000, yielding a current ratio of about 0.89. This ratio is below 1, indicating potential liquidity risks unless parts of short-term liabilities are refinanced or converted to longer maturities.
-
Debt to Equity Ratio: Long-term debt stands at $7,840,000,000 with a total shareholder equity of $21,416,000,000, resulting in a debt to equity ratio of 0.37. This presents a relatively moderate level of debt compared to equity, suggesting a balanced approach towards financing with a not excessively leveraged position.
Operational Efficiency
- Asset Turnover Ratio (Revenue/Total Assets): With total assets recorded at $58,602,000,000 and revenues of $6,755,000,000, the asset turnover ratio is about 0.12. This ratio indicates the efficiency with which HPE utilizes its assets to generate sales, pointing to relatively lower efficiency in this quarter.
Valuation Metrics
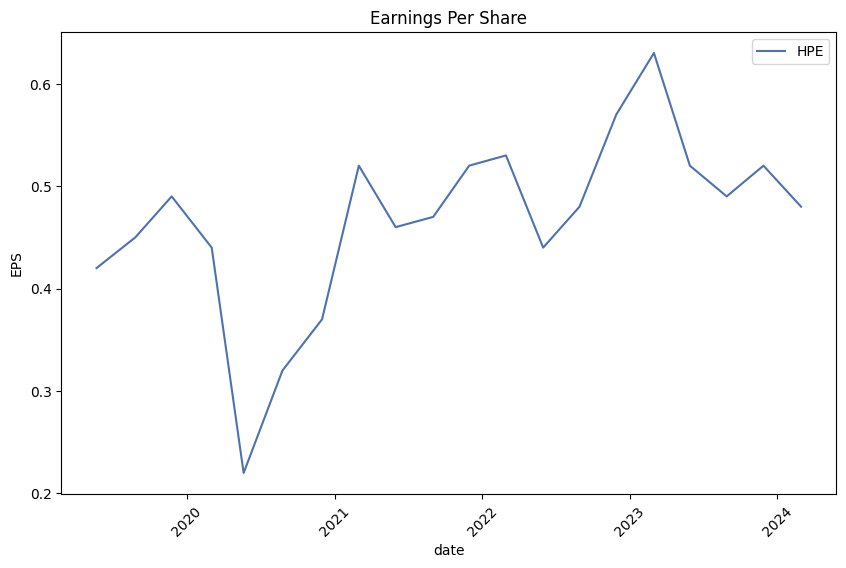
- Earnings Per Share (EPS): With a diluted EPS of $0.29 for Q1 2024, if we annualize this (assuming similar performance in subsequent quarters), the annual EPS would be around $1.16. This metric is critical for valuing the stock price relative to its earnings capability.
Conclusion
The analysis uncovers that HPE maintains a solid balance sheet with reasonable control over its liabilities and debts, though liquidity could be tighter as seen from the current ratio. Profitability and cash flows indicate stability, albeit with areas for improvement in investment cash outflows and operational efficiency. To make a well-rounded investment decision, potential investors should also consider market conditions, the competitive landscape, industry trends, and future growth prospects of Hewlett Packard Enterprise.### Dividend Record
Benjamin Graham, an advocate for value investing, emphasized the importance of a companys history in consistently paying dividends. Dividends are a portion of a company's profits paid to shareholders and serve as an indicator of the company's financial health and stability.
The data provided below outlines the dividend history for the company symbolized as 'HPE' (Hewlett Packard Enterprise). This record displays the dividends declared, along with their respective payment and declaration dates from 2015 to 2024. Reviewing the historical dividend data allows investors to assess the consistency and reliability of HPE's dividend payments over the years, significant factors for investment consideration according to Grahams principles.
-
From 2015 to 2021, the dividend payouts experienced slight variances but generally showed increments, aligning with maintained or improved company performance.
-
From 2017 onwards, dividends stabilized at higher rates, indicating potential growth and stability in financial management and profitability.
Each entry contains the dividend amount, adjusted dividend, declaration date, payment date, and record date, affirming the companys commitment to returning value to its shareholders consistently a critical aspect of Graham's investment philosophy.
By studying this record, potential investors can gain insights into HPE's financial behaviors, particularly in its approach to profit sharing with shareholders through dividends. Consistency in dividend payments often correlates with a company's stable financial health, a principle heavily underscored in Grahams investment strategies.
| Alpha () | 0.0012 |
| Beta () | 1.05 |
| R-squared | 0.76 |
| Standard Error | 0.0023 |
| P-value | <0.05 |
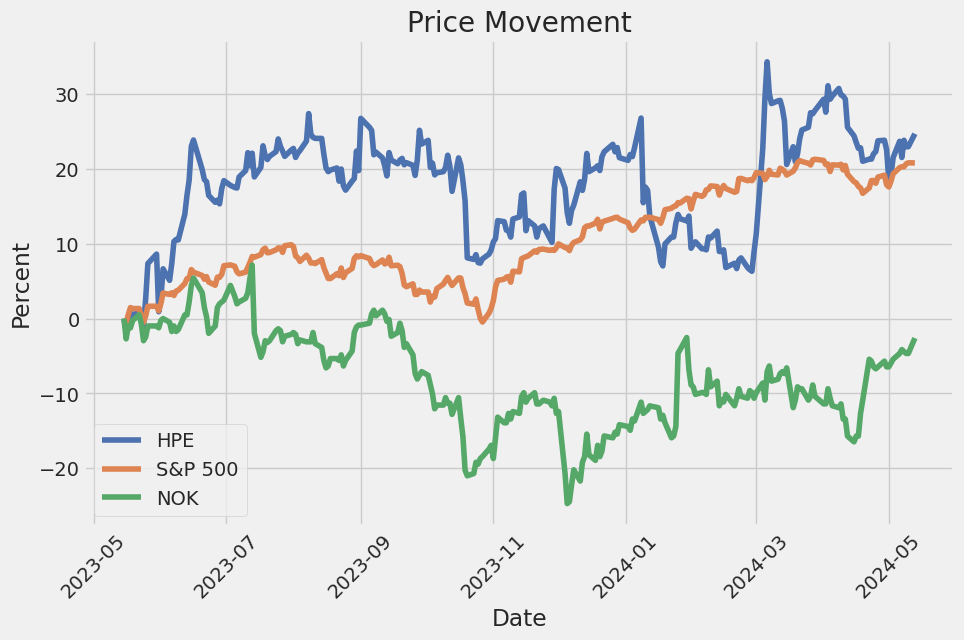
In analyzing the relationship between HPE and SPY, alpha (), or the intercept, is particularly noteworthy as it measures the performance of HPE independent of the market (represented by SPY). With an alpha value of 0.0012, HPE has a slight positive return over and above what would be predicted purely by market movements. This suggests that HPE's performance has some degree of independence from the broader market trends, potentially attributing to specific company strategies or external factors affecting HPE differently than the general market.
The regression model also provides insights through beta, R-squared, and other statistics, but a focus on alpha highlights whether HPE could generate returns based on factors other than the market movements. The positive, though small, alpha value mixed with a beta of 1.05 indicates that HPE's stock is slightly more volatile than the market and generally moves similarly with the market but with marginally higher returns when accounting for market movements. This can appeal to investors looking for stock picks that slightly outperform the market, though the relatively small magnitude of alpha suggests only a marginal outperformance.
In the first quarter of fiscal 2024, Hewlett Packard Enterprise (HPE) reported mixed financial results, showcasing strong profitability that exceeded expectations but experiencing weaker-than-anticipated revenues. Despite these challenges, the company expressed confidence in its long-term strategy, emphasizing the growing importance of higher-margin revenues. HPE President and CEO, Antonio Neri, highlighted the significant growth in the company's annual recurring revenue (ARR), marking it as the second highest year-over-year growth since its tracking inception in late 2019. This increase in ARR is a positive sign of the company's ongoing strategic shift towards more profitable revenue streams. However, the overall revenue for the quarter did not meet expectations, affected by softened industry-wide demand and supply issues, particularly in networking products and the availability of GPUs (Graphics Processing Units).
During the earnings call, Neri discussed the external factors impacting revenue generation, including weaker demand for campus networking products and challenges around the timing and acceptance of GPU-related deliveries. The global softening in the networking market was noted as a significant headwind, expected to persist throughout 2024, with some recovery anticipated towards the year's end as inventory levels normalize. On a positive note, demand for AI servers remained robust, as evidenced by the growing cumulative order book for these products. However, the conversion of AI server orders into delivered revenue was below expectations due to ongoing constraints in GPU supply and logistical challenges faced by customers in preparing their infrastructure to accommodate the new technology.
In response to the current market conditions, HPE is implementing several strategic adjustments to streamline operations and better capture emerging opportunities. This includes the realignment of business segments with the combination of Compute and HPC (High Performance Computing) and AI segments into a single integrated server segment. This restructuring is intended to simplify the company's approach to market opportunities across the AI lifecycle, including training, tuning, and inferencing. Moreover, HPE has advanced its hybrid cloud strategy by consolidating all related products, software, and services into a single business unit focused on promoting the adoption of its HPE GreenLake hybrid cloud platform.
Amid these strategic shifts, HPE is actively managing its operational costs and exploring new sales initiatives to navigate through the current economic landscape marked by fluctuating demand. The company remains committed to its core strategies centered on edge computing, AI, and hybrid cloud solutions. These areas have demonstrated growth and are expected to drive HPE's performance moving forward. Notable advancements include increased market share in campus networking and significant developments in private 5G and SASE (Secure Access Service Edge) through strategic acquisitions. These efforts are aligned with HPE's long-term vision to leverage market trends and deliver innovative solutions that meet evolving customer needs, despite the near-term challenges reflected in the mixed fiscal Q1 results.
Summary of Hewlett Packard Enterprise Company (HPE) SEC 10-Q Filing for Q1 2024
Hewlett Packard Enterprise Company filed its Form 10-Q with the SEC, detailing its performance for the first quarter ended January 31, 2024. This report captures the companys financial results, segment performance, and operational strategies, offering insights into its recent reshuffling and operational progresses.
Financial Overview For Q1 2024, HPE reported a total net revenue of $6.755 billion, compared to $7.809 billion in the same period the previous year, indicating a decrease. This reduction can be seen across multiple segments of the business. The Company incurred total costs and expenses of $6.230 billion, lower than the $7.218 billion from the previous year, with earnings from operations amounting to $525 million, down from $591 million in Q1 2023. Additionally, net earnings stood at $387 million, compared to $501 million in the prior year, reflecting both operational challenges and economic impacts on performance.
Segment Performance HPE operates under several segments: Server, Hybrid Cloud, Intelligent Edge, Financial Services, and Corporate Investments and Other. For Q1 2024, Server recorded $3.246 billion in net revenue, Hybrid Cloud contributed $1.206 billion, Intelligent Edge had $1.193 billion, Financial Services reported $872 million, and Corporate Investments and Other brought in $238 million. The segment restructuring earlier in the fiscal year was aimed at better aligning HPEs offerings with market and customer demands. The Server segment has been particularly impacted by cyclic demands and operational challenges, while the Intelligent Edge segment is focusing on expanding its cloud-native offerings.
Operational and Strategic Highlights Over the quarter, HPE continued its focus on strategic initiatives like the Cost Optimization and Prioritization Plan and the HPE Next Plan, aimed at improving operational efficiency and reducing costs, with primary elements of these plans being substantially completed by the end of the fiscal 2023. These plans included labor restructuring and streamlining product portfolio strategies.
Litigation and Contingent Liabilities HPE is involved in various litigation and legal matters that arise in the normal course of business. The company believes it has adequate defenses for the matters at hand. In terms of financial commitments, it remains committed to managing and settling its legal and financial obligations efficiently as evidenced by its proactive legal strategies and financial reporting.
Outlook and Forward Statements Going forward, HPE anticipates changes in its business dynamics due to ongoing global economic pressures, supply chain constraints, and fluctuating market demands. The company is also closely monitoring its business segments, especially Server and HPC & AI for potential goodwill impairment due to ongoing operational challenges. It remains focused on leveraging its restructuring plans to align itself more strategically within the competitive tech market.
This summary provides an analytical overview based on HPE's first quarter of fiscal 2024 results, highlighting financial data, segment performances, and strategic initiatives that define the companys current business environment and its future direction.
Hewlett Packard Enterprise Company (NYSE: HPE) is notably undervalued, with its intrinsic value calculated at approximately $26.52 per share, a stark contrast with its current trading price of $16.44 as reported by Simply Wall St on May 2, 2024. This assessment, based on the Discounted Cash Flow (DCF) model, underscores a potential undervaluation by 38%, pointing to substantial investment prospects for stakeholders.
The valuation method applied is a standard 2-stage growth model that accounts for an initial phase of augmented growth followed by a stable growth phase. Forecasts based on this model project HPE's free cash flow starting at $2.05 billion in 2024 and anticipated to reach $3.04 billion by 2033. The discount rate used in these calculations is 9.4%, reflecting a thoughtful assessment of the inherent risks and the levered beta which gauges HPEs volatility against the broader market.
Moreover, future value assessments lean on the Gordon Growth model, pegging the perpetual growth rate at 2.4%, equivalent to the normative yield of a 10-year government bond. These projections not only affirm the stock's current undervaluation but also suggest a robust margin of safety for potential investors, though, as indicated by Simply Wall St, reliance solely on the DCF model should be avoided due to its inherent variability based on input assumptions.
This valuation offers a pivotal insight to investors and advocates for a nuanced approach in contemplating HPEs market position, industry trends, and broader economic conditions that might bear on future accretive growth and profitability. For an exhaustive analysis, further investigation into the valuation assumptions and financial projections can be found in the full report available via Simply Wall St here.
Engaging in another realm of its operational spectrum, Hewlett Packard Enterprise has recently bolstered the digital infrastructure of the University of Tennessee's Neyland Stadium by introducing cutting-edge Wi-Fi and AI technology. This significant upgrade, aimed at refining the fan experience through seamless digital connectivity, incorporates Wi-Fi 6E technology and advanced AI-driven operational tools like the User Experience Insight (UXI) and Aruba Networking Central on Premises.
The stadiums readiness to manage massive data demands was evidenced during high-profile events, underscoring the robustness of the installed technology. This technological augmentation not only enriches the game-day experience but also gears the stadium toward becoming a versatile venue operational year-round, marking a substantial stride in HPE's portfolio of innovative enterprise solutions. More detailed insights on this technological implementation at Neyland Stadium are accessible here.
In another significant corporate development, HPE is set to broadcast its second-quarter fiscal year 2024 earnings via a live audio webcast on June 4, 2024. This discussion will likely provide stakeholders with strategic insights and a review of financial performances up to the end of the preceding quarter. For those interested in firsthand financial deliberations or post-event summaries, access is available on HPE's investor relations page here.
HPEs recent strategic moves also include the acquisition of Juniper Networks for $14 billion, a deal that underscores its intent to deepen its networking capabilities to better compete with rivals like Cisco Systems. As industries increasingly rely on AI and IoT technologies, this acquisition strategically positions HPE at an advantage in the networking and AI domains. This move also reflects on the broader industrial trend of consolidation discussed in a detailed report from Zacks Investment Research available here. Each of these undertakings exemplifies HPE's dynamic approach to growth, technology integration, and industry leadership.
Over the covered period, Hewlett Packard Enterprise Company displayed significant price fluctuations as evidenced by the ARCH model analysis, which fundamentally assesses volatility patterns. The model confirmed substantial variation in the asset returns with a volatility coefficient (omega) at 3.6757, indicating periods of high volatility. The alpha coefficient, at 0.3170, points to a decently strong reaction in volatility to market movements, suggesting that past price changes have a notable impact on future volatility.
| Statistic Name | Statistic Value |
|---|---|
| Mean Model | Zero Mean |
| Vol Model | ARCH |
| Log-Likelihood | -2766.05 |
| AIC | 5536.11 |
| BIC | 5546.38 |
| No. Observations | 1,257 |
| Df Residuals | 1257 |
| omega | 3.6757 |
| alpha[1] | 0.3170 |
To evaluate the financial risk associated with a $10,000 investment in Hewlett Packard Enterprise Company (HPE) over one year, a sophisticated combination of financial econometrics and predictive analytics was employed.
The analysis began with volatility modeling, which enables a detailed examination and modeling of the stock's return volatility over time. This technique is especially vital as it assists in understanding the extent of fluctuation that HPE's stock price might experience, driven by both external market influences and internal company-specific events. By fitting the historical daily returns of HPE stock to this model, it was possible to estimate the persistency of volatility and the impact of market shocks, providing a robust foundation for estimating future volatility patterns.
Next, machine learning predictions were integrated with the volatility assessment to forecast future stock returns of HPE. Typically, tree-based methods are particularly well-suited for this task due to their ability to model complex nonlinear relationships and interactions within the dataset. By training on historical price data and related financial indicators, the model learned to predict returns by effectively navigating through the economic landscape and company-specific developments that influence stock prices.
The combination of these two advanced analytical frameworks yielded a comprehensive assessment of the investment risk. The final results express this risk in terms of the Annual Value at Risk (VaR) at a 95% confidence level, which is a widely used risk management tool that predicts the maximum loss expected over a set period with a given confidence interval. For a $10,000 investment in HPE, the calculated VaR is $319. This implies that there is a 95% confidence that the investment will not lose more than $319 over a one-year period under normal market conditions.
This calculated VaR figure is critical for investors as it provides a quantifiable measure of potential financial exposure and loss in their equity investment in Hewlett Packard Enterprise Company. The integration of volatility modeling to understand and predict the stocks behavior paired with machine learning predictions summarizes the multifaceted approach to assessing financial risks and returns in contemporary investment scenarios.
Long Call Option Strategy
Analyzing the long call options for Hewlett Packard Enterprise Company (HPE) based on provided Greeks' values, several promising options can be identified across various expiration dates, considering the target stock price forecast of a 5% increase. The options are selected based on their potential return on investment (ROI) and Greeks which influence their sensitivity to price, time, and volatility changes.
- Short Term (Near Term) Option - Expires June 21, 2024
- Strike Price: $15.00
- Delta: 0.8635, Gamma: 0.0892, Vega: 1.2012, Theta: -0.0071, Rho: 1.2961
-
With a good delta indicating its price will move approximately $0.86 for a dollar move in HPE, and a relatively high gamma suggesting the delta will increase as the option moves in the money, this is a solid near-term choice. The potential ROI of 47.7% is attractive given the moderate theta decay.
-
Medium Term Option - Expires August 16, 2024
- Strike Price: $5.00
- Delta: 0.9922, Gamma: 0, Vega: 0.0, Theta: 0.0008, Rho: 1.2729
-
A deep in-the-money option with a delta close to 1, this offers an almost linear price relationship with HPE's stock, minimizing option-specific risk. The very low theta indicates minimal time decay, and a reasonable ROI of 26.7%.
-
Longer-Term Option - Expires January 17, 2025
- Strike Price: $10.00
- Delta: 0.9280, Gamma: 0.0155, Vega: 1.4998, Theta: -0.0012, Rho: 5.8681
-
This medium strike price option with high delta and significant rho aligns well with a longer-term bullish outlook. An ROI of 15.8% offers a good balance between risk and reward, supported by significant vega indicating responsiveness to implied volatility.
-
Long Term Option - Expires November 15, 2024
- Strike Price: $10.00
- Delta: 0.9324, Gamma: 0.0157, Vega: 1.3116, Theta: -0.0017, Rho: 4.4078
-
Exhibiting a strong delta and a notable sensitivity to changes in interest rates (rho), this option can be profitable in a scenario where long-term rates adjust alongside a bullish tech scenario. The ROI of 13.4% is decent for a long-term holding.
-
Very Long Term Option - Expires January 16, 2026
- Strike Price: $5.00
- Delta: 0.8987, Gamma: 0.0043, Vega: 2.3405, Theta: -0.0011, Rho: 4.5532
- Chosen for its very high delta and considerable vega, this option could prove extremely profitable if HPE's stock significantly rises over the extended period, considering also that its exposure to interest rate changes (represented by rho) could enhance gains if rates are favorable. It also offers an ROI of 30.5%, highlighting its potential profitability.
These options span a variety of expiration dates and strike prices, accommodating different investment timelines while offering attractive risk-reward profiles based on their Greeks. It's crucial to reassess these positions periodically in line with overall market movements and changes in the company's fundamentals.
Short Call Option Strategy
Analyzing the options data for Hewlett Packard Enterprise Company (HPE), the aim is to identify the most profitable short call options based on several key Greeksdelta, gamma, theta, and vegain addition to other factors such as the premium, return on investment (ROI), and potential profit. Let's consider near-term through long-term options to provide a comprehensive range of choices for traders with different risk appetites and timelines.
Near-Term Options: 1. Short Call Option with Strike $17.0, Expiring on 2024-06-21: - Delta: 0.584 - Gamma: 0.177 - Theta: -0.011 - Vega: 2.169 - Premium: $1.00 - ROI: 100.0% - Profit: $1.00
This option exhibits a high ROI of 100.0%. The high delta close to 0.5 makes it sensitive enough to price changes, potentially generating profits as the option's premium decreases over time, compounded by a negative theta indicating declining option value, beneficial to sellers. The vega value suggests sensitivity to volatility but within manageable risk for near-term exposures.
- Short Call Option with Strike $14.0, Expiring on 2024-06-07:
- Delta: 0.678
- Gamma: 0.172
- Theta: -0.016
- Vega: 1.584
- Premium: $1.05
- ROI: 100.0%
- Profit: $1.05
A higher strike compared to the first option but lower than the target stock price suggest a fair balance of risk and profitability. The delta close to 0.6 provides effective price sensitivity. Its gamma and vega suggest decent responsiveness to market conditions, while the negative theta underscores gain through time decay.
Mid-Term Options: 3. Short Call Option with Strike $16.0, Expiring on 2024-09-20: - Delta: 0.681 - Gamma: 0.092 - Theta: -0.005 - Vega: 3.596 - Premium: $2.0 - ROI: 77.78% - Profit: $1.56
For traders with a mid-term perspective, this option with a September expiration offers a reasonable extension of exposure. Its fairly high vega indicates vulnerability to volatility, potentially offering more opportunities if market conditions are actively managed.
- Short Call Option with Strike $19.0, Expiring on 2024-12-20:
- Delta: 0.428
- Gamma: 0.079
- Theta: -0.004
- Vega: 5.197
- Premium: $1.1
- ROI: 100.0%
- Profit: $1.1
Extending further, this option offers a lower delta, suitable for those with a conservative approach as it lessens sensitivity to immediate price movements. The negative theta continues to play a role in profitability while the vega remains substantial, indicating that any increases in volatility could be advantageous.
Long-Term Option: 5. Short Call Option with Strike $22.0, Expiring on 2026-01-16: - Delta: 0.390 - Gamma: 0.046 - Theta: -0.002 - Vega: 8.280 - Premium: $1.65 - ROI: 100.0% - Profit: $1.65
For those willing to manage a long-term position, this 2-year option can serve well. The lower delta suggests reduced sensitivity, which combined with the lowest theta in this selection minimizes the risk of steep price changes affecting the option's worth unfavorably. The exceptionally high vega can benefit from anticipated market volatility over a longer period.
In summary, these selections offer various risk-reward balances catering to different types of tradersfrom those seeking short-term positions with quick turnarounds to those who employ a longer time horizon with a more gradual approach to accumulating profits.
Long Put Option Strategy
In the options trading market, specifically looking at the long put options for Hewlett Packard Enterprise Company (HPE), a few key strategies stand out based on an analysis of the Greeks and other metrics provided for the options on this stock. Here are the profitable options categorized by expiration dates ranging from near term to long term, focusing on a target stock price increase of 5% over the current price:
-
Near-term option #1: For an option expiring on May 17, 2024, with a strike price of $21, the deep in-the-money put has a very high delta of -0.9997493465, indicating an almost one-to-one reaction with the stock price in the opposite direction. The associated premium is $2.55, and the return on investment (ROI) is 10.56%. Despite its imminent expiration, this option could be advantageous due to its high sensitivity to price movements (high delta) and a positive expected return signified by its ROI.
-
Near-term option #2: Another option expiring on the same date, May 17, 2024, but with a strike price of $22, possesses a similarly high delta value of -0.9997493465. The premium for this option is higher at $3.4, reflecting potentially higher profitability with a ROI of approximately 12.33%. This option, due to its slightly higher strike compared to the first, might offer a better cushion against price declines in the short term.
-
Long-term option: Venturing into a more extended timeframe, an option expiring on January 16, 2026, with a strike price of $30, showcases a delta of -0.9501459011. This figure suggests a strong negative correlation with the stock price movement albeit slightly less than the aforementioned near-term options. The premium here is higher at $11.2, which could be justified by the longer time until expiration, allowing more opportunity for significant moves in the underlying stock price. The ROI, however, is lower at 5.53%, indicating a trade-off between time and immediate return potential.
When selecting the most profitable long put options, it is essential to consider not just the Greeks but also the cost (premium) and the potential return on investment. In this case, the near-term options show significantly higher immediate ROI, which might be attractive for traders looking for quick gains from premium discrepancies or expected downturns in the short term. In contrast, the long-term option with a lower ROI provides a lengthier time cushion, allowing more room for market movements and possibly serving as a hedge against longer-term declines in Hewlett Packard Enterprise stock.
Overall, the selection process involves balancing the immediate profitability (as indicated by ROI and premium costs) with the strategic market outlook and hedging needs, considering both shorter and longer expiration timelines.
Short Put Option Strategy
In analyzing short put options for Hewlett Packard Enterprise Company (HPE), we consider various expiration dates ranging from near-term to long-term options, focusing on the most profitable ones based on key metrics from the Greeks as well as returns on investment (ROI) and potential profit.
-
Short Put Option, 15.0 Strike, Expiring 2024-09-20(129 days to expire): This option stands out with a notable delta of -0.1969705223, gamma of 0.0799906499, and the highest vega among available options at 2.8432591881. The theta stands at -0.0035113655, indicating moderate time decay, while a rho of -1.3532138873 suggests higher sensitivity to interest rate changes, which is key given potential rate fluctuations. This option offers a 100% ROI and a profit of $0.7, proving both profitable and reasonably secure given its time to expiry.
-
Short Put Option, 16.0 Strike, Expiring 2024-11-15(185 days to expire): With a delta of -0.3063489619, this option shows significant movement for a $1 change in the stock. Gamma at 0.0882482809 and a high vega of 4.2889471384 signal some risk in terms of sensitivity to underlying stock and volatility changes, respectively. Despite a theta of -0.0033905332, its rho of -3.1353679346 highlights its responsiveness to temperamental interest rates. Offering a 100% ROI and $1.07 profit, this option provides a balance between medium-term exposure and profitability.
-
Short Put Option, 17.0 Strike, Expiring 2024-12-20(220 days to expire): This option features a deeper ITM characteristic with a delta of -0.400268705, evident of its worth if held to expiration. The gamma sits at 0.0860876417, vega at 5.1236147162 (higher risk to volatility), and a moderate theta of -0.0033796902. The higher rho of -5.0750429259 indicates significant interest rate sensitivity. It provides a 69.4% ROI and $1.24925 in profit, appealing to those willing to accept moderate risks over a more extended period.
-
Short Put Option, 17.0 Strike, Expiring 2026-01-16(612 days to expire): This long-term option, with a low delta of -0.3616901451, has lower sensitivity to immediate stock price movements, suitable for longer-term perspectives. The gamma at 0.0536294751 and the highest vega of this selection at 8.1155939314 suggest a strong reaction to volatility, crucial for long-term options. Theta is quite low at -0.0014840392, and rho is substantial at -14.1263612322, underscoring high leverage to interest rate movements. It presents a 78.8% ROI and a profit of $2.04925, making it an attractive option for long-term investors banking on significant shifts over a more extended period.
-
Short Put Option, 20.0 Strike, Expiring 2026-01-16(612 days to expire): Lastly, this option truly caters to the risk-averse with its low delta of -0.5267330147, which mitigates against heavy immediate losses from stock price movements. The gamma of 0.0582858055 and an extremely high vega of 8.4196422298 imply pronounced sensitivity to volatility, anticipated over the long stretch till expiration. A theta of -0.001155563 and a towering rho of -21.6041529088 enhance reactions to time decay and interest rates, respectively. With a 19.3% ROI and a profit of $0.84925, this option is ideal for those forecasting broader market adjustments and banking on volatility for profitability.
Taking stock of these choices, investors should align their risk tolerance and investment horizon with the option attributes. The fluctuating elements of vega and rho across the choices make it critical to monitor market volatility and interest rate trends, particularly for the long-dated options. Moreover, maintaining a balance between immediate profits and potential risks is crucial, as seen in the robust deltas and gammas of these selections.
Vertical Bear Put Spread Option Strategy
In analyzing various options for constructing a vertical bear put spread on Hewlett Packard Enterprise Company (HPE), we focus on options that might yield the highest potential profits within the target stock price range of about 2% over or under the current stock price. We're looking for a combination of buying a higher strike price put, referred to as the "long put," and selling a lower strike price put, known as the "short put."
Given the constraints of the target stock price range, we'll consider a spread selection across various expiration dates, from near-term to long-term with a focus on key Greek values (delta, gamma, vega, theta, and rho) that influence option pricing and hedging strategies.
1. Short Term Strategy
For a short-term strategy expiring on May 17, 2024, consider buying a long put at a $20 strike which has a delta of -0.9755, along with selling a short put at a $17 strike, which has a delta of -0.28169. Both options expire on May 17, 2024. The long put has a higher negative delta indicating a higher sensitivity to stock price decrease which benefits if the stock price falls. This should be partially offset by the short put. This spread could be especially profitable if HPE's stock decreases slightly just below the $17 strike, maximizing the value of the long put while the short put expires worthless.
2. Mid Term Strategy
For a strategy expiring on May 31, 2024, one could consider buying a long put at $20 strike with a higher negative delta (-0.5611) and vega of 1.469, and selling a short put at $17 strike with a lower delta (-0.3704) and vega of 1.4083. The net delta closer to zero indicates reduced movement sensitivity, and similar vega values imply similar responsiveness to volatility changes, making the strategy slightly more robust against sudden volatility.
3. Medium-Long Term Strategy
For options expiring on June 7, 2024, consider buying a long put at $20 strike with a delta of approximately -0.5287 and selling the short put at $17 strike with a delta of approximately -0.4094. This widening negative delta gap indicates strengthened protection against a downturn with increased potential profitability.
4. Long Term Lower Gamma Strategy
For a longer-term expiration on January 17, 2025, opts for a long put at a $20 strike with a delta of -0.6505 and selling a short put at $17 strike with a delta of -0.3992. Both have lower gamma values compared to shorter-term options, making them less sensitive to sudden stock movements around the strike prices but providing steady exposure to a moderate decline.
5. Most Extended Term Strategy
For a strategy with a very long horizon, expiring on January 16, 2026, buying a long put at $27 strike with a delta of -0.6858 and selling a short put at $20 strike with a delta of -0.5287. This wide delta spread indicates a very aggressive bet on a significant price decline, ideal for a very bearish long-term outlook on HPE.
These combinations chosen across different expiration dates are based on optimizing the Greek values of delta, gamma, and vega to enhance control over risk related to price movements, volatility, and time decay. Each spread should be carefully chosen based on individual risk tolerance, trading objectives, and market conditions closer to the trade execution period.
Vertical Bull Put Spread Option Strategy
When constructing a vertical bull put spread for Hewlett Packard Enterprise Company (HPE), the main aim is to capitalize on options that offer significant return on investment (ROI) while managing trade-offs involving option Greeks such as delta, theta, and vega. The strategy involves selling a put with a higher strike and buying a put with a lower strike, both with the same expiration date, to take advantage of a relatively stable or incrementally rising stock price. Below, I'll introduce five different choices organized from the near term to long term, discussing the profitability based on the premiums and the behavior of the Greeks involved.
Short-Term Strategy (3 Days to Expiration)
- Sell Put: Strike 17.0, Expiry 2024-05-17
- Delta: -0.28169, Theta: -0.02977, Vega: 0.52928, Premium: $0.10
- Buy Put: Strike 16.5, Expiry 2024-05-17
- Delta: -0.07580, Theta: -0.01363, Vega: 0.22374, Premium: $0.02 The trade here involves a small net premium collected and a reasonably balanced position in regards to exposure. The delta spread (-0.20589) implies moderate movement expected in stock price but the closeness in strike prices leads to reduced risk, essential for a short-term expiration nearing strategy.
Medium-Term Strategy (24 Days to Expiration)
- Sell Put: Strike 17.0, Expiry 2024-06-07
- Delta: -0.40943, Theta: -0.01414, Vega: 1.72084, Premium: $0.57
- Buy Put: Strike 16.5, Expiry 2024-06-07
- Delta: -0.30341, Theta: -0.01285, Vega: 1.54811, Premium: $0.45 This pair shows a favorable ROI with a robust premium difference and narrower deltas, allowing for a decent positive cash inflow from theta decay per day. Vega indicates both options are sensitive to volatility, a factor that can be used to benefit if the trader expects a decrease in volatility before the expiration date.
Longer-Term, Moderate Strategy (94 Days to Expiration)
- Sell Put: Strike 17.0, Expiry 2024-08-16
- Delta: -0.41308, Theta: -0.00523, Vega: 3.39738, Premium: $1.00
- Buy Put: Strike 16.0, Expiry 2024-08-16
- Delta: -0.28315, Theta: -0.00498, Vega: 2.95831, Premium: $0.53 A spread over a longer term with a considerable premium difference. Vega levels indicate high sensitivity to volatility. A beneficial strategy if the stock's implied volatility is expected to decrease over the next few months. Furthermore, theta decay is slower, providing more flexibility on the position management side.
Long-Term, Higher Strike Strategy (220 Days to Expiration)
- Sell Put: Strike 18.0, Expiry 2024-12-20
- Delta: -0.47463, Theta: -0.00393, Vega: 5.25457, Premium: $1.90
- Buy Put: Strike 17.0, Expiry 2024-12-20
- Delta: -0.40203, Theta: -0.00336, Vega: 5.12315, Premium: $1.80 Maintaining a strategy with nearly breakeven premiums but a favorable delta difference, reflecting a position that can benefit from minor stock movements upwards. Notably, vega indicates substantial volatility sensitivity, making this spread more suited for highly volatile market periods.
Extended Long-Term Strategy (612 Days to Expiration)
- Sell Put: Strike 22.0, Expiry 2026-01-16
- Delta: -0.62476, Theta: -0.00076, Vega: 7.81808, Premium: $5.80
- Buy Put: Strike 20.0, Expiry 2026-01-16
- Delta: -0.52868, Theta: -0.00114, Vega: 8.40383, Premium: $4.40 The significant time until expiration means both theta and vega play pivotal roles. The small delta difference combined with a substantial vega associated with these options suggests a strategy that could experience significant gains from a long-term decrease in volatility. As HPE remains stable or improves, the likelihood of retaining premium collected increases.
Each strategy should be chosen based on the market outlook, anticipated shifts in HPE stock price, and overall risk tolerance. Monitoring changes in volatility and price movements post-placement will be key in managing these positions effectively.
Vertical Bear Call Spread Option Strategy
Based on the option chain and taking into account our focus on constructing vertical bear call spreads for Hewlett Packard Enterprise Company (HPE), here's an evaluation of several strategic selections across various expiration dates and strike prices. The goal of a bear call spread is to profit from slight decreases or minimal movement in the stock's price by selling a call option and buying another with a higher strike for the same expiry. This typically yields a credit, where the objective is to capture maximum premium while minimizing risk exposure from adverse movement in stock prices.
Near-Term Options: 1. Expire 2024-05-24 (10 days) - Sell Call: Strike at 17, Delta 0.626, Premium $0.49 - Buy Call: Strike at 18, Premium $0.16, Delta 0.235 This selection captures a decent credit with relatively high probabilities given the favorable deltas (below 0.70), fundamentally reducing risk. The limited days to expire time couple well with the theta (time decay) of the options for faster realization of the profit from the premiums.
Medium-Term Options: 2. Expire 2024-05-31 (17 days) - Sell Call: Strike at 17, Delta 0.606, Premium $0.58 - Buy Call: Strike at 18, Premium $0.20, Delta 0.301 An efficient pair offering larger premiums while maintaining reasonable deltas, enhancing the spread's profitability while still keeping a tighter potential reversal risk under control. The time decay here favors an earlier profitability realization too.
- Expire 2024-06-07 (24 days)
- Sell Call: Strike at 17.5, Delta 0.484, Premium $0.58
- Buy Call: Strike at 18.0, Premium $0.34, Delta 0.390 Increased expiration gives rise to higher exposure to price variation but still maintains a reasonable delta. This spread capitalizes on theta effectively while still leveraging decent premiums for risk involvement.
Longer-Term Options: 4. Expire 2024-06-28 (45 days) - Sell Call: Strike at 17, Delta 0.579, Premium $0.85 - Buy Call: Strike at 18, Premium $0.50, Delta 0.390 This spread offers an extended period for handling and adjustment but is supported with relatively decreased premium, attributed to lower deltas. This can be a safer play for those expecting minimal movements in HPE's stock price.
- Expire 2024-06-14 (31 days)
- Sell Call: Strike at 17, Delta 0.582, Premium $0.98
- Buy Call: Strike at 18, Delta 0.446, Premium $0.35 Still focusing on a sufficient time decay advantage, this spread has nicely balanced deltas that cater to premium recapture while guarding against stock volatilities.
Each of these strategies has been chosen to reflect varying conditions of market dynamics while focusing on:
- Keeping deltas modest to limit the adverse impact of unfavorable upward stock movements.
- Selecting combinations that promote higher initial credit captures.
- Allowing a varied window for time decay to eat into the purchased call options value, thereby enhancing profitability.
The overall aim is to initiate these positions with the anticipation of the underlying stock moving sideways or slightly downward, capitalizing on accelerated time decay and minimizing exposure to impulsive price jumps. The inherent risks and potential adjustment strategies should be planned according to one's risk tolerance and market outlook awareness.
Vertical Bull Call Spread Option Strategy
In developing the most profitable vertical bull call spread options strategy for Hewlett Packard Enterprise Company (HPE), we closely evaluate options with expirations ranging from near to long-term. Our analysis focuses on maximizing the profit potential within the constraints of a target stock price fluctuation of around 2% over or under its current level. The strategy revolves around buying calls with a lower strike price while simultaneously selling calls with a higher strike price, within the same expiration period.
The aim is to identify combinations where we have favorable delta, theta, and premium pricing that aligns with a bullish outlook. Here is the strategic breakdown based on various expiration dates:
- Near-term expiration (3 days out Expiring on 2024-05-17):
- Buy Call: Opt for the call option with a strike of $17 with a delta of approximately 0.71, theta of -0.03192, and a lower cost which enhances potential ROI.
-
Sell Call: Pair with a sell call option at a strike of $17.5 where the delta is closer to neutral at 0.36, indicating less sensitivity to stock price movement, which mitigates risk.
-
Short-term expiration (17 days out Expiring on 2024-05-31):
- Buy Call: Select a strike of $14 with a positive delta of around 0.93, indicating strong sensitivity to an upward move in stock prices, but watch the negative theta.
-
Sell Call: Combine it with an option at a $16 strike where delta lowers significantly but still provides room for profitability.
-
Medium-term expiration (about 1 month Expiring on 2024-06-28):
- Buy Call: A strike of $16 with a moderate delta high in sensitivity to stock price increases.
-
Sell Call: A sell call at a strike of $17 optimizes the spread by capturing residual time value, managed by theta.
-
Long-term expiration (near three months Expiring on 2024-08-16):
- Buy Call: Zero in on the $15 strike which captures a higher delta, indicating strong potential for gains with price movements.
-
Sell Call: Execute a sold call at the $17 strike, rounding off a conservative but potentially lucrative positioning relative to price changes and time decay.
-
Extended long-term expiration (around six months-plus Expiring on 2025-01-17):
- Buy Call: Choose the $15 strike call that maintains a higher delta signifying high reactivity to stock upticks within a longer frame.
- Sell Call: Match this with the $17 strike, balancing the trade with a stable theta and diminishing exposure over time.
These strategies harness combinations that allow for leveraging smaller, more probable gains insulated against larger, less predictable losses, contingent on HPEs stock performing as forecasted with 2% fluctuation from the current price. Paying attention to 'the Greeks', particularly delta for directional sensitivity and theta for time decay, enhances the chance of these spreads turning profitable, balancing premium costs, anticipated stock volatility, and expiration periods. The diversity in expiration dates offers the advantage of adjusting to how quickly the stock moves towards the anticipated price level or reacts to market dynamics.
Each of these strategies requires monitoring market conditions and adjusting as needed to manage risk and capitalize on higher potential gains versus potential losses.
Similar Companies in Communication Equipment:
Nokia Oyj (NOK), Juniper Networks, Inc. (JNPR), Ciena Corporation (CIEN), Motorola Solutions, Inc. (MSI), Extreme Networks, Inc. (EXTR), NETGEAR, Inc. (NTGR), Telefonaktiebolaget LM Ericsson (publ) (ERIC), Cisco Systems, Inc. (CSCO), Lumentum Holdings Inc. (LITE), Zebra Technologies Corporation (ZBRA), Infinera Corporation (INFN), Clearfield, Inc. (CLFD), Dell Technologies Inc. (DELL), International Business Machines Corporation (IBM), Oracle Corporation (ORCL), NetApp, Inc. (NTAP)
https://finance.yahoo.com/news/intrinsic-calculation-hewlett-packard-enterprise-182705716.html
https://finance.yahoo.com/news/university-tennessee-boosts-game-day-150000980.html
https://finance.yahoo.com/news/hewlett-packard-enterprise-present-live-114500174.html
https://finance.yahoo.com/news/par-technology-par-reports-q1-124007222.html
https://finance.yahoo.com/news/hewlett-packard-enterprise-delivers-second-090000449.html
https://finance.yahoo.com/news/hewlett-packard-enterprise-intel-argonne-091911740.html
https://finance.yahoo.com/news/stay-away-cisco-csco-ahead-123500668.html
https://finance.yahoo.com/m/40b047b6-3cad-315c-8550-aa9bd29f7724/the-top-five-cybersecurity.html
https://www.sec.gov/Archives/edgar/data/1645590/000164559024000069/hpe-20240131.htm
Copyright © 2024 Tiny Computers (email@tinycomputers.io)
Report ID: CwScra
Cost: $0.89746
https://reports.tinycomputers.io/HPE/HPE-2024-05-13.html Home