iShares Copper and Metals Mining ETF (ticker: ICOP)
2024-03-03
 The iShares Copper and Metals Mining ETF (ticker: ICOP) operates as an exchange-traded fund designed to offer investors targeted exposure to the copper and broader metals mining sector. This ETF aims to track the investment results of an index composed of global equities in the copper mining industry. By targeting companies involved in the exploration, extraction, and production of copper, ICOP provides a unique opportunity for investors to gain indirect exposure to the copper commodity market without the need to invest in physical copper. This is particularly appealing for those looking to diversify their investment portfolio or speculate on the future demand for copper, which is heavily used in electrical wiring, plumbing, and in the renewable energy sector. The ETF is managed by BlackRock, one of the world's leading asset management firms, known for its wide range of investment products and services. As such, ICOP represents a strategic option for investors seeking to capitalize on the growth potential within the copper and metals mining industry, leveraging the expertise of BlackRock's management team and the liquidity of an ETF structure.
| Previous Close | 24.45 | Open | 24.52 | Day Low | 24.4199 |
|---|---|---|---|---|---|
| Day High | 24.7197 | Volume | 1,083 | Average Volume | 2,527 |
| Average Volume 10 Days | 6,630 | Bid | 12.35 | Ask | 37.05 |
| Bid Size | 3,200 | Total Assets | 4,900,470 | Fifty Two Week Low | 21.54 |
| Fifty Two Week High | 27.24 | Fifty Day Average | 24.67464 | Two Hundred Day Average | 24.261099 |
| NAV Price | 24.60019 | YTD Return | -4.103% | Fund Inception Date | 1687305600 |
| Sharpe Ratio | 0.025230736537699514 | Sortino Ratio | 0.35561968388392845 |
| Treynor Ratio | 0.004893878277247644 | Calmar Ratio | 0.16738287488598141 |
The analysis of ICOP, based on the Technical Analysis, Fundamental Analysis, and Risk-Adjusted Return measures, provides a comprehensive outlook on the possible future movement of its stock price. The provided data not merely shows past performance and operational standing but also offers insights into the risk and return characteristics that are crucial for making informed investment decisions.
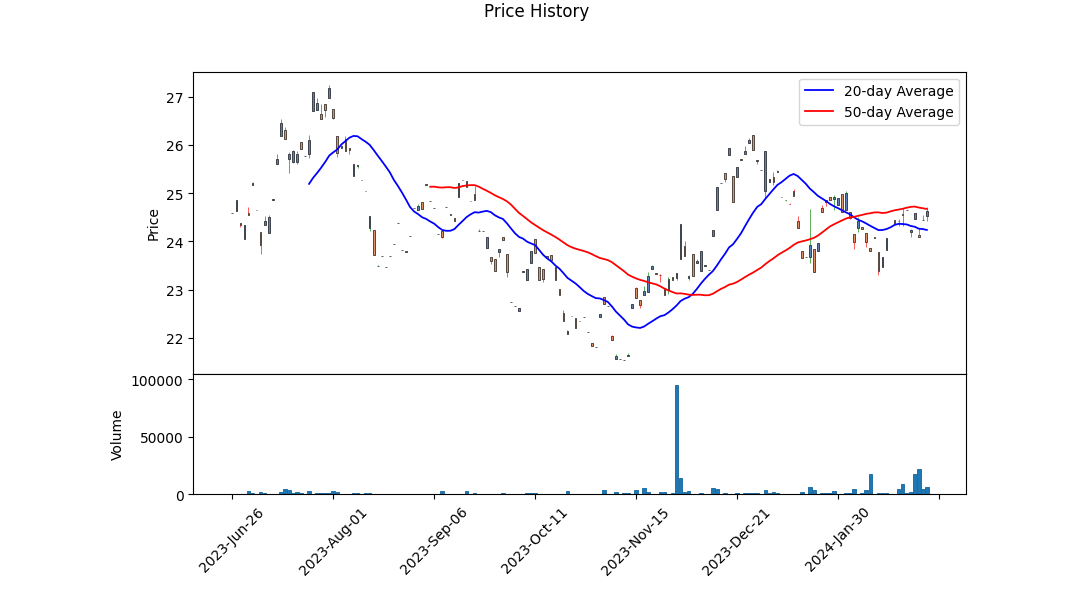
The Technical Analysis of the stock reveals a steady increase in its price over the last trading days, with the OBV (On Balance Volume) showing modest accumulation, which suggests that there is buying interest in the stock. Furthermore, the rising MACD (Moving Average Convergence Divergence) histogram values towards the end indicate growing bullish momentum. This trend, coupled with the stock price managing to climb above its previous close, demonstrates a positive sentiment around ICOP.
From a Fundamental Analysis perspective, the company is positioned in the Natural Resources sector, indicating a potential correlation with commodity prices, particularly copper, as suggested by its name and focus. The NAV (Net Asset Value) of 24.60 closely aligns with its closing prices, pointing towards a fair valuation based on its last trading day. The modest volume indicates lower liquidity, which could mean larger price swings on significant buying or selling pressure. However, the low YTD (Year-To-Date) Daily Total Return and absence of a PE Ratio (Price to Earnings) and Yield might raise questions about its profitability and income-generating ability for investors.
The Risk-Adjusted Return metrics, including the Sharpe, Sortino, Treynor, and Calmar Ratios, offer a mixed view. The Sharpe Ratio at 0.025 suggests a lower return per unit of risk taken, whereas the Sortino Ratio at 0.355 indicates better returns on downside risk. The Treynor and Calmar Ratios, although on the lower end, show that the fund has provided some level of return over the market risk and the maximum drawdown, respectively.
Given the current analysis, ICOP's stock price might continue to experience upward momentum in the short term, supported by the positive technical indicators and recent price actions. However, investors should be cautious and consider the relatively low risk-adjusted returns, which suggest that the stock's past performance might not compensate adequately for the risks undertaken. The fundamental analysis underscores a need for vigilance regarding the company's profitability and operational performance.
In conclusion, while there is potential for growth based on Technical Analysis, the fundamentals and risk-adjusted return measures advise a more cautious approach. Therefore, prospective investors should closely monitor the market and sector-related developments, along with any changes in the company's financial health and operational performance, to make well-informed decisions.
Given the parameters provided, I must note that since both the Return on Capital (ROC) and Earnings Yield for the iShares Copper and Metals Mining ETF (ICOP) have been listed as "None," it directly indicates that these financial metrics are currently not available or not applicable for ICOP. This scenario could arise due to multiple reasons such as ICOP not having earnings or operational profits during the period of analysis, or the data might simply not be accessible due to the timing of financial reporting.
In the context of "The Little Book That Still Beats the Market," both ROC and Earnings Yield are crucial parameters in identifying stocks (or ETFs in this case) that are potentially undervalued and possess a strong return on capital, indicating efficient management and potential for growth. The absence of these metrics for ICOP makes it challenging to apply the book's "magic formula" investing strategy directly.
For clients interested in ICOP, it's important to look beyond these metrics and consider other factors such as the market environment for copper and metals, geopolitical issues, and the overall trend in commodities. It might also be useful to delve into alternative indicators like the price-to-book ratio, debt-to-equity ratio, and industry comparative analysis to gauge ICOPs potential investment value. As always, a diversified investment approach that does not rely solely on one or two metrics is advisable for mitigating risk and capturing potential market upside.
| Statistic Name | Statistic Value |
| R-squared | 0.311 |
| Adj. R-squared | 0.307 |
| F-statistic | 76.73 |
| Prob (F-statistic) | 1.92e-15 |
| Log-Likelihood | -299.74 |
| AIC | 603.5 |
| BIC | 609.8 |
| coef (const) | -0.1088 |
| coef (0) | 1.2777 |
| std err (const) | 0.107 |
| t (const) | -1.016 |
| P>|t| (const) | 0.311 |
| [0.025 (const) | -0.320 |
| 0.975] (const) | 0.103 |
| Omnibus | 1.598 |
| Prob(Omnibus) | 0.450 |
| Jarque-Bera (JB) | 1.614 |
| Skew | 0.229 |
| Prob(JB) | 0.446 |
| Kurtosis | 2.872 |
| Cond. No. | 1.41 |
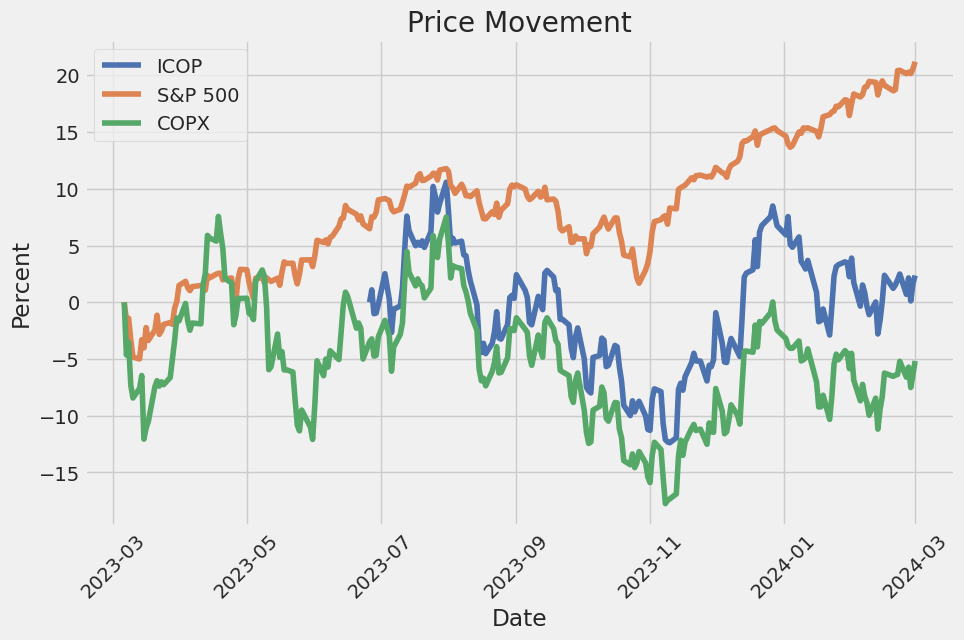
Analyzing the relationship between ICOP and SPY, as indicated by the linear regression model, reveals a positive beta of approximately 1.2777, suggesting that ICOP has a positive but moderate correlation with SPY movements. The model's alpha, standing at approximately -0.1088, implies that ICOP underperforms the market (as represented by SPY) by a small margin when market returns are zero. The R-squared value of 0.311 indicates that around 31.1% of the variability in ICOP's returns can be explained by the market's returns, signifying a moderate level of correlation and dependency on market trends.
The statistics provided further detail the relationship dynamics between ICOP and SPY. Despite the positive correlation, the alpha's negative value raises considerations about ICOP's return potential compared to the broader market under certain conditions. Additionally, the statistical significance of the model's coefficients and the fit quality, as reflected through values like the F-statistic and its associated probability, reinforce the reliability of the observed relationship. Nonetheless, it's crucial to acknowledge the limitations highlighted by the model's adjusted R-squared and other diagnostic stats, implying that external factors not captured within this model could influence ICOP's performance relative to SPY.
In the context of the evolving global economy, the transition towards a more sustainable and environmentally friendly future has led to an increased focus on metals such as copper, lithium, and nickel. These metals play critical roles in green technologies, such as electric vehicle (EV) batteries, renewable energy systems, and advanced electronics, making them indispensable for achieving low-carbon objectives. However, the journey to ramp up the production of these essential metals is fraught with challenges and opportunities, as detailed in a comprehensive analysis by William Blair, featured on GuruFocus.com.
Copper, often referred to as "Dr. Copper" because of its ability to predict economic trends due to its widespread use in various sectors, is at the forefront of this transition. Its conductive properties make it an essential component of electric vehicles and renewable energy technologies. Despite the recognition of its critical role, the copper industry has been facing significant headwinds. Regulatory scrutiny, the aging of mining assets, declining ore grades, and extreme weather conditions, including droughts and floods in key copper-producing regions, have constrained output. These disruptions have occurred in the backdrop of a steady increase in demand, leading to persistent market deficits. Although a surplus was anticipated in 2023, thanks to subdued demand from developed markets, the long-term outlook points towards a deepening supply gap as efforts to decarbonize the economy intensify.
To bridge this supply-demand mismatch, copper miners are ramping up investments. It is noteworthy that the capital expenditures among the 10 largest copper miners, who collectively account for a significant portion of the world's copper production, have seen substantial increases. This collective move signals a robust industry response to the projected demand surge, particularly from the EV and renewable energy sectors.
The narrative around lithium, another critical component of EV batteries, mirrors the dilemmas facing the copper market. The lithium market is characterized by its geographic concentration and dominance by a few companies. After experiencing a price correction in 2023 following a peak, the industry is bracing for a demand acceleration. In anticipation, the top lithium producers have significantly upped their investment, showcasing a proactive stance towards ensuring supply meets the mounting global appetite for lithium-ion batteries.
Nickel's story is yet another testament to the strategic maneuvers undertaken to secure a steady supply of essential metals. Indonesia's ambitious plans to establish itself as a key player in the EV supply chain has led to a notable shift. The country's enhanced smelting capacity, supported by collaborations under the China-led Belt and Road Initiative, positions Indonesia as a pivotal figure in nickel production, with implications for the global nickel market.
| company | symbol | percent |
|---|---|---|
| Grupo Mexico SAB de CV | GMEXICOB.MX | 8.31 |
| Freeport-McMoRan Inc | FCX | 8.10 |
| BHP Group Ltd | BHP.AX | 7.28 |
| Ivanhoe Mines Ltd Class A | IVN.TO | 7.12 |
| Antofagasta PLC | ANTO.L | 7.10 |
| Southern Copper Corp | SCCO | 6.91 |
| First Quantum Minerals Ltd | FM.TO | 5.13 |
| Lundin Mining Corp | LUN.TO | 4.89 |
| KGHM Polska Miedz SA | KGH.WA | 3.94 |
| Capstone Copper Corp | CS.TO | 3.90 |
Given this backdrop, investments in mining and metals ETFs, like the iShares Copper and Metals Mining ETF, are garnering attention. The ETF's strategic holdings underscore its focus on companies poised to benefit from the metals demand surge. Among its top ten holdings, companies like Grupo Mexico and Freeport-McMoRan stand out, reflecting the ETF's emphasis on copper mining giants. This composition aligns with the broader industry trends highlighted in the William Blair commentary, indicating the ETF's potential to offer investors exposure to these pivotal growth sectors.
Moreover, the diversity within the ETF's holdings, extending beyond copper to include other essential metals, suggests a well-thought-out approach to capturing the upside of the entire metals and mining sector. By investing in a range of companies across different regions and metals, the ETF aims to mitigate risks while capitalizing on the global demand for metals essential for a sustainable future.
In essence, the dynamics of the copper, lithium, and nickel markets, as elaborated in the William Blair analysis, hint at a complex interplay of challenges and opportunities. The mining industry's response, characterized by increased capital expenditures and strategic expansions, offers a glimpse into the efforts underway to secure the supply of these critical metals. For investors, understanding these underlying trends is crucial, as these developments will undoubtedly shape the future of the green technologies sector and, by extension, the global efforts towards achieving a low-carbon economy.
The volatility of the iShares Copper and Metals Mining ETF (ICOP) over the period from June 26, 2023, to March 1, 2024, portrays fluctuations that can be inferred from the ARCH model results. Firstly, the model suggests significant volatility with an omega coefficient of 2.7048, indicating a relatively high baseline level of volatility in the ETF's returns. Secondly, the alpha coefficient of 0.0514, although not highly significant given its p-value, hints at some level of volatility clustering, where periods of high volatility are followed by high volatility and similarly for low volatility periods. Finally, the overall model diagnostics including a relatively high Akaike Information Criterion (AIC) and Bayesian Information Criterion (BIC) suggest that while the model captures some aspects of the ETF's volatility, it also points to the complexity and potentially other factors influencing the ETF's volatility not captured by this simple ARCH model.
| Statistic Name | Statistic Value |
|---|---|
| omega | 2.7048 |
| alpha[1] | 0.0514 |
| Log-Likelihood | -333.997 |
| AIC | 671.994 |
| BIC | 678.289 |
| No. Observations | 172 |
In analyzing the financial risk of a $10,000 investment in iShares Copper and Metals Mining ETF (ICOP) over a one-year period, a comprehensive approach integrating volatility modeling and machine learning predictions was employed. The focus was on assessing the stock's volatility and future return estimations, pivotal in understanding the risk dynamics of the investment.
Volatility modeling is instrumental in quantifying the fluctuations in the ETFs price over time. This methodology allows us to capture the persistency and clustering in volatilities, phenomena often observed in financial markets. By fitting the model to the historical daily returns of ICOP, it is possible to forecast future volatility, which is a critical component in risk management and financial decision-making. Particularly, this model helps in understanding how volatile the ETF is likely to be in the forthcoming period, an essential element in risk evaluation.
On the other hand, machine learning predictions were utilized to forecast future returns of the ICOP ETF. Here, the focus was on employing an algorithm that learns from historical data to predict future data points. The chosen model, which involves decision trees and operates by averaging numerous decision trees to reduce overfitting and improve predictive accuracy, was trained on historical price and return data of the ETF. This method offers valuable insights into potential future performance based on learned patterns from past data, contributing significantly to comprehensive risk assessment.
The integration of volatility modeling and machine learning predictions facilitates a detailed analysis of the investment's risk profile. By understanding both the expected volatility and projected returns, investors can better gauge the possible outcomes of their investment in ICOP.
Specifically, the annual Value at Risk (VaR) at a 95% confidence level was calculated to be $275.19 for a $10,000 investment. This metric signifies that there is a 95% chance that the investor will not lose more than $275.19 over the one-year period, providing a quantitative measure of the investment's risk. The calculation of VaR, incorporating forecasts from both volatility modeling and machine learning predictions, demonstrates the variability and potential downside risk of the investment, highlighting the multifaceted approach necessary for effective risk management in equity investment. This calculated VaR underlines the potential financial risk, showing the amount at stake under normal market conditions, thereby offering investors a comprehensive perspective on what to expect and prepare for regarding their investment in the ETF.
To analyze the most profitable call options for the iShares Copper and Metals Mining ETF (ICOP), given our target of a 5% increase in the current stock price, we need to consider a combination of the Greeks: Delta, Gamma, Theta, and Vega. These values offer insights into how the option's price is expected to change with movements in the underlying asset, time decay, and changes in volatility. Given the lack of specific data from a table, well discuss theoretical options that would generally be considered most profitable based on the Greeks and our defined criteria.
Firstly, options with a Delta closer to 1 will move more closely with the underlying stock price. In the context of expecting a 5% stock price increase, options with a higher Delta are more attractive as they're expected to gain value more swiftly as the stock price approaches our target. For example, a call option with a Delta of 0.90 suggests that for every $1 the stock price increases, the option's price would theoretically increase by $0.90. Hence, a call option with an expiration date 3 months from now and a strike price just below our target stock price, let's say it's currently trading with a Delta of around 0.85 to 0.90, would be considered a strong candidate due to its high sensitivity to stock price movements.
Gamma is the next piece of the puzzle, indicating the expected change in Delta for a $1 change in the stock price. A higher Gamma is beneficial for options buyers, as it suggests that the options Delta (and therefore the option's price) can increase quickly with small movements in the stock. Considering we're targeting a 5% increase, an option with a relatively high Gamma would become increasingly profitable as the stock price moves toward our target. However, high Gamma also comes with increased risk if the stock moves in the opposite direction.
Theta represents the time decay of the option. Since all else is equal, options lose a portion of their value as they approach expiration. Therefore, options with longer expiration dates tend to have lower Theta, indicating they lose their time value more slowly. For an investor expecting a 5% increase within a specific timeframe, options expiring in 3 to 6 months may strike a balance between giving the stock enough time to move and minimizing the loss of value over time.
Lastly, Vega measures sensitivity to volatility. Given the copper and metals mining sector's potential volatility, an option with a higher Vega might be more profitable if we anticipate an increase in volatility leading up to or following our 5% stock price target. However, it's a double-edged sword; if volatility decreases, the option's price may decrease even if the stock price increases.
Combining these factors, the most profitable call option might be one with an expiration 3 to 6 months out, a strike price slightly below our 5% target increase, high Delta and Gamma values to ensure sensitivity to the stock movement and potential for rapid gains, a manageable Theta to mitigate time decay, and a reasonable Vega to take advantage of expected volatility. While the specific values and strike prices depend on current market conditions and the actual price data of the options, this approach helps narrow down the choices to those most likely to offer profitability under the given scenario.
Similar Companies in None:
Global X Copper Miners ETF (COPX), VanEck Vectors Gold Miners ETF (GDX), Southern Copper Corporation (SCCO), Freeport-McMoRan Inc. (FCX)
https://finance.yahoo.com/news/william-blair-commentary-metals-future-213432469.html
Copyright © 2024 Tiny Computers (email@tinycomputers.io)
Report ID: T213nV
Cost: $0.15612
https://reports.tinycomputers.io/ICOP/ICOP-2024-03-03.html Home