Pacer Benchmark Industrial Real Estate SCTR ETF (ticker: INDS)
2024-01-19
 The Pacer Benchmark Industrial Real Estate SCTR ETF (ticker: INDS) is an exchange-traded fund that specifically targets the industrial real estate sector. The ETF aims to provide investors with exposure to US companies that generate the majority of their revenue from real estate operations in the industrial sector. This includes companies that own, operate, or finance industrial real estate, encompassing warehouses, distribution centers, and similar facilities that play a crucial role in e-commerce, manufacturing, and logistics. INDS tracks a rules-based index which emphasizes companies showing strong yield and quality characteristics. As a niche real estate investment, INDS is potentially well-positioned to capitalize on the growth of e-commerce and the increasing demand for logistics infrastructure. This ETF offers an opportunity for investors to participate in the industrial real estate market without the need for direct property ownership or management, providing a liquid and diversified approach to this specific subset of the real estate sector.
| Previous Close | 39.71 | Open | 39.73 | Day Low | 39.095 |
| Day High | 39.73 | Price to Earnings Ratio | 16.10 | Volume | 22,954 |
| Average Volume | 33,572 | Average Volume 10 Days | 34,318 | Bid | 38.66 |
| Ask | 40.61 | Bid Size | 1,100 | Ask Size | 1,000 |
| Yield | 3.11% | Total Assets | 225,538,048 | 52 Week Low | 31.498 |
| 52 Week High | 43.11 | 50 Day Average | 38.806 | 200 Day Average | 38.255 |
| NAV Price | 39.659 | Currency | USD | Year to Date Return | -5.09% |
| Beta 3 Year | 1.25 | Three Year Average Return | 5.91% | Five Year Average Return | 11.56% |
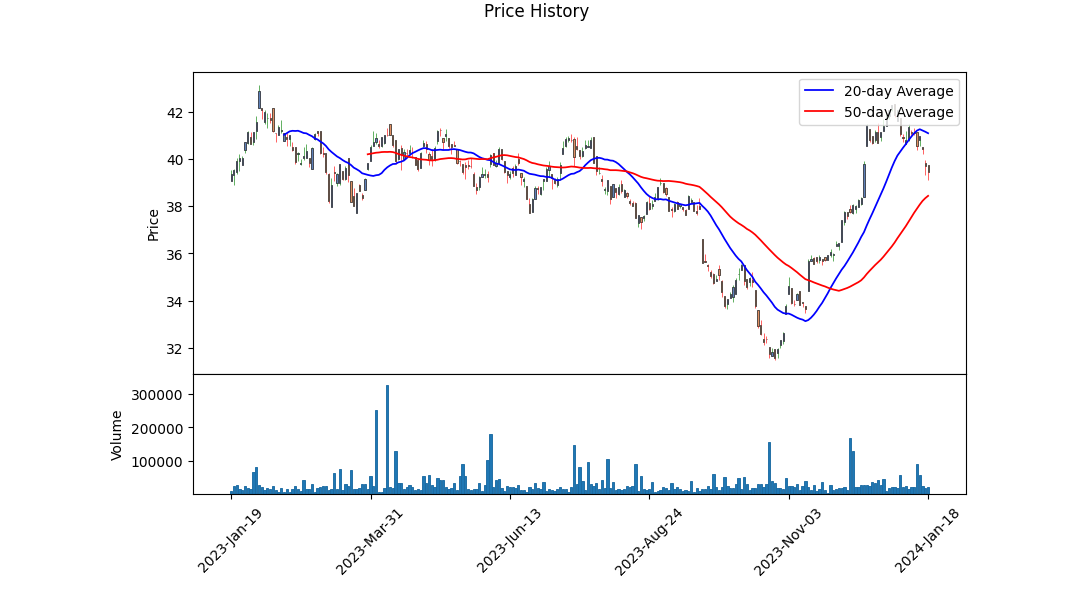
 The technical analysis of INDS as of the last trading day indicates a potential bearish trend in the short to medium term. Here's the evaluation:
-
Negative MACD Histogram: The Moving Average Convergence Divergence (MACD) indicator's histogram has a negative value, indicating downward momentum. As the histogram becomes increasingly negative, this suggests that the bearish sentiment may persist.
-
OBV Trend: The On-Balance Volume (OBV) is displaying a decreasing trend, which typically implies that selling pressure is dominating buying pressure. In the context of price action, this would support a bearish outlook.
-
Price Action Relative to Moving Averages: The closing price is situated below the 50-day moving average but still above the 200-day moving average. This positioning points towards a recent downturn in price action but with a long-term trend that is still undecided.
Fundamental analysis points towards several factors:
-
Trailing PE Ratio: The PE Ratio (TTM) is 16.10, which might suggest a relatively fair valuation depending on the sector and market conditions. A moderate PE could attract value investors if the broader market sentiment is optimistic.
-
Dividend Yield: The current yield is 3.11%, which may be appealing to income-focused investors, potentially providing a level of support for the stock price.
-
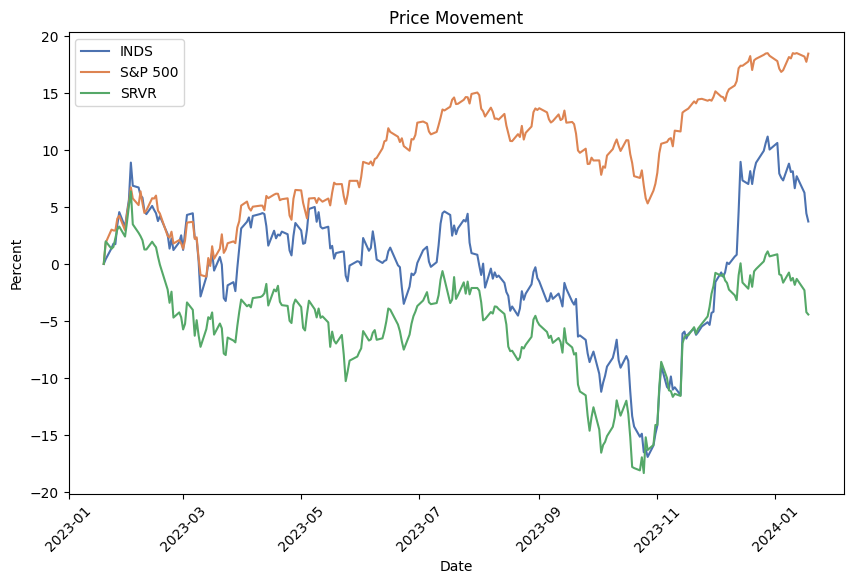
YTD Return: A year-to-date return of -5.09% indicates underperformance relative to the broader market, which could lead to a bearish sentiment if the trend continues.
-
Liquidity Position: With a relatively low average volume compared to the 10-day average volume, there might be less liquidity in the market, potentially leading to higher volatility.
If we consider the fundamentals and technicals together, it appears that while the stock is not significantly overvalued, the bearish signals on the technical front may overpower the fundamentals in dictating short-term price movements. Long-term investors may retain confidence due to the fair valuation and dividend payouts, but short-term traders may be concerned by the negative technical indicators.
INDS' market performance in the next few months likely hinges on the broader market sentiment, sector performance, and any updated financials that may emerge. Given the absence of detailed financials as of the latest data, we lean on observable market data to inform our analysis.
The absence of Balance Sheets, Financials, and Cash Flows makes it difficult to assess the company's financial health in depth. However, the technical indicators suggest caution in the short term, hence the stock could experience further price declines or increased volatility in the forthcoming months barring any positive market-wide or company-specific news. Investors will want to monitor the stock closely throughout this period, paying particular attention to volume and price levels relative to its moving averages and any shifts in fundamental metrics.
| Statistic | Value |
| R-squared | 0.603 |
| Adj. R-squared | 0.603 |
| F-statistic | 1,906 |
| Prob (F-statistic) | 5.60e-254 |
| Log-Likelihood | -1,814.4 |
| No. Observations | 1,256 |
| AIC | 3,633 |
| BIC | 3,643 |
| const | -0.0046 |
| coef | 0.9607 |
| std err | 0.022 |
| t | 43.663 |
| P>|t| | 0.000 |
| [0.025 | 0.918 |
| 0.975] | 1.004 |
| Omnibus | 196.631 |
| Prob(Omnibus) | 0.000 |
| Jarque-Bera (JB) | 2,217.228 |
| Skew | -0.322 |
| Kurtosis | 9.477 |
| Cond. No. | 1.32 |
| Alpha | -0.004583 |
In the linear regression model assessing the relationship between INDS and SPY, the alpha (the model's intercept) is slightly negative, at approximately -0.0046. This suggests that when the SPY is unchanged, there is a very small negative average expected change in the value of INDS. While the alpha is considered the extra return that an investment earns over a certain benchmark, in this case, it indicates a slight underperformance when the market movements are zero.
The model's R-squared of 0.603 means that approximately 60% of the variation in the INDS can be explained by the fluctuations in SPY, indicative of a moderate to strong relationship. The coefficient for SPY, which represents beta, is around 0.9607, showing that INDS typically moves almost one-for-one with SPY. Thus, for every percentage point change in SPY, INDS is expected to move about 0.96 percentage points in the same direction. Since the P-value associated with this beta is virtually zero, it indicates a highly significant relationship.
The Pacer Benchmark Industrial Real Estate SCTR ETF, operating under the ticker INDS, is a fund tailored for investors looking to capitalize on the growth within the industrial real estate sector. This ETF specifically targets industrial Real Estate Investment Trusts (REITs), a niche that has seen considerable growth due to the booming e-commerce industry. INDS allows for diversified exposure to a sector that is characterized by a scarcity of supply and robust demand, both of which are key drivers for the appreciation of industrial real estate assets.
Industrial REITs, the focal asset class of the INDS ETF, differ significantly from other commercial REIT types that include traditional office buildings and retail spaces. This specific class has outperformed many others because of its direct association with the logistical side of e-commerce essentially warehouses, distribution centers, and fulfillment hubs. As online shopping continues to grow, the demand for these types of spaces increases correspondingly. Amazon's innovative distribution model, in particular, has triggered a wave of demand for industrial spaces that are strategically located close to key transport links such as highways and airports.
Top Ten Holdings
| company | symbol | percent |
|---|---|---|
| Public Storage | PSA | 15.21 |
| Prologis Inc | PLD | 15.19 |
| Extra Space Storage Inc | EXR | 4.74 |
| CubeSmart | CUBE | 4.50 |
| Segro PLC | SGRO.L | 4.44 |
| Rexford Industrial Realty Inc | REXR | 4.38 |
| EastGroup Properties Inc | EGP | 4.34 |
| W.P. Carey Inc | WPC | 4.24 |
| Stag Industrial Inc | STAG | 4.11 |
| First Industrial Realty Trust Inc | FR | 3.99 |
INDS has a concentrated portfolio that adheres to a strict selection criterion, focusing on fewer than 40 stocks that are heavily weighted towards its top ten holdings. This strategic composition reflects the ETF's confidence in its major holdings, such as Public Storage and Prologis Inc, which are pivotal in the logistics and storage sectors.
In terms of financial returns, the Pacer Benchmark Industrial Real Estate SCTR ETF is not just about appreciating values; it is also recognized for its consistent and growing dividend payouts. These dividends are a significant attraction for income-oriented investors. As of December 23, 2023, INDS had a dividend yield of nearly 4%, indicating a decent return in the form of income on top of any capital gains. Furthermore, the ETF's top holdings have shown significant increases in dividends, suggesting optimistic future prospects for dividend investors.
On the horizon for industrial REITs are the opportunities presented by renewable energy and the further infrastructural development of e-commerce. An additional area for potential growth is in data center operations, which could benefit from the ever-increasing needs for cloud storage and processing power required for advanced technologies such as artificial intelligence.
Despite these growth prospects, the INDS ETF does come with a notable caveat in the form of a relatively high expense ratio of 0.60%. This is a point of contention for some investors, who might consider it steep for the accessibility provided by the ETF and feel that similar results could be achieved with a more hands-on approach to investing.
Market sentiment is an important influencer in the commercial real estate domain, which is often marked by its cyclical nature. However, it is essential to note that industrial REITs have generally bucked the declining trend observed in other sub-sectors of commercial real estate, such as office spaces. The Pacer Benchmark Industrial Real Estate SCTR ETF well illustrates this divergence, underpinning the necessity to look beyond broad market perceptions when choosing investments.
When scrutinizing industrial REITs, it is vital for investors to observe the debt profiles of these entities as well. The capital-intensive requirements of building and maintaining industrial facilities mean that REITs could be leveraged with significant debt, which is a crucial factor to analyze, particularly as interest rates vary.
For further details on INDS and the industrial real estate sector's performance, you can explore the original article published on Seeking Alpha, which sheds light on the ETF and offers a holistic view of the current market state. This valuable information can be accessed by visiting INDS: Certainly Worth A Look.
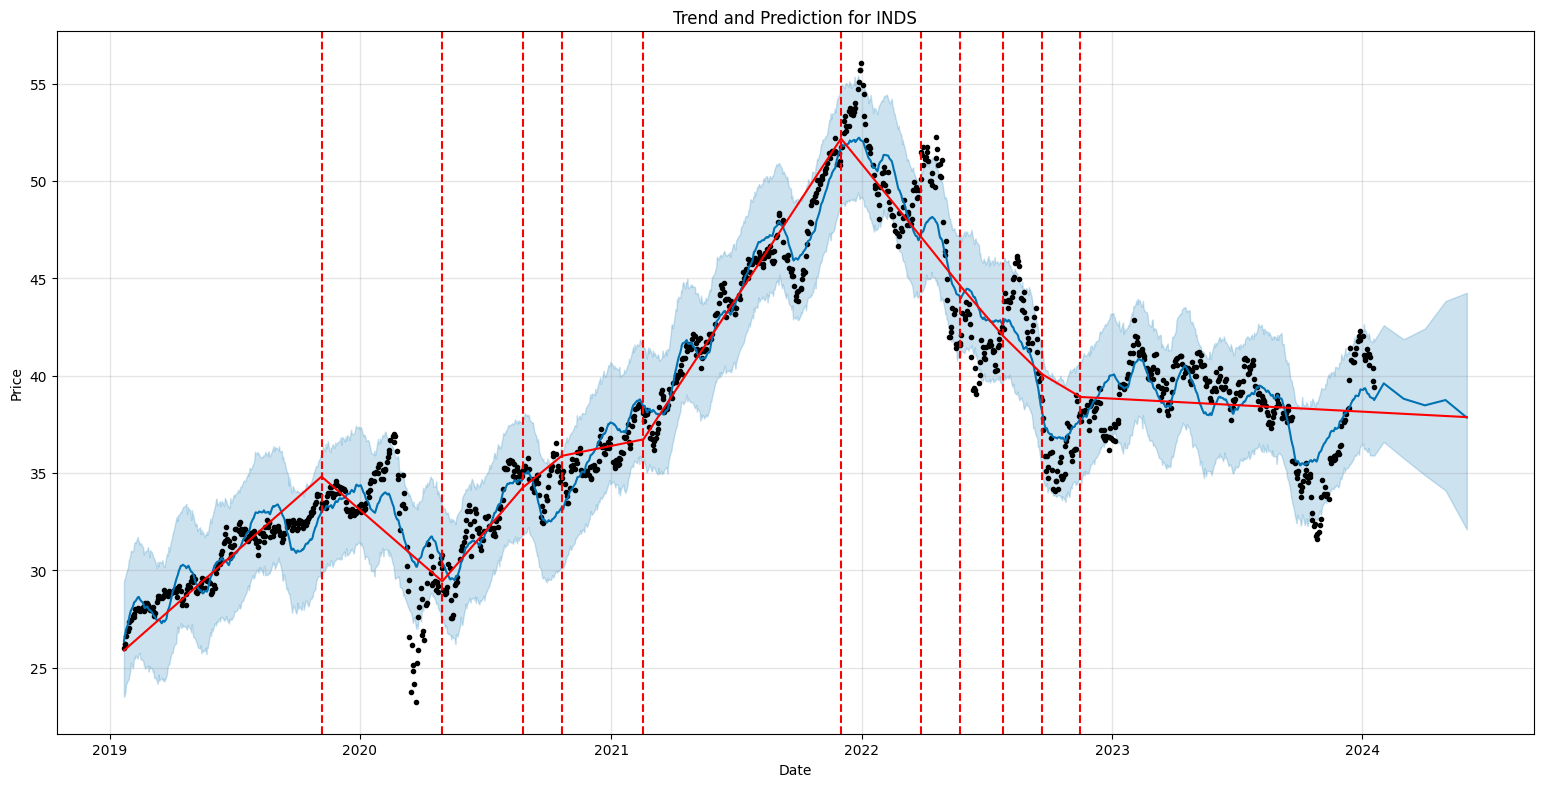
The Pacer Benchmark Industrial Real Estate SCTR ETF (INDS) experienced noticeable volatility from January 22, 2019, to January 18, 2024. The ARCH model indicates a persistent volatility as evidenced by the significant omega coefficient, and a single lag of past returns (alpha[1]) is a significant predictor of current volatility. The positive alpha coefficient also suggests that past large movements in the ETF price, whether up or down, would lead to increased volatility.
| Statistic Name | Statistic Value |
|---|---|
| R-squared | 0.000 |
| Adj. R-squared | 0.001 |
| Log-Likelihood | -2,213.30 |
| AIC | 4,430.61 |
| BIC | 4,440.88 |
| No. Observations | 1,256 |
| Omega | 1.4005 |
| Alpha[1] | 0.4306 |
To assess the financial risk associated with a $10,000 investment in Pacer Benchmark Industrial Real Estate SCTR ETF (INDS) over a one-year period, a tactical approach combining volatility modeling and machine learning predictions can be implemented.
Volatility modeling is vital for understanding the expected fluctuation in the price of INDS's stock. This statistical approach estimates the size and frequency of price movements, which can be particularly significant in the real estate sector due to its sensitivity to interest rates, economic cycles, and other market-driving forces. The model typically uses historical price data to forecast future volatility by considering the persistence of volatility and the potential impact of market events. By implementing this model, investors can get a sense of how smooth or rough the ride might be with the particular ETF.
On the other hand, machine learning predictions can complement volatility modeling by employing historical data to train algorithms that predict future returns. In this context, a predictive model such as a decision tree-based ensemble method is applied. The algorithm processes the historical data, identifies patterns and relationships within the data, and makes predictions about future returns by essentially learning from the past. This is important for investors as it can provide an indication of not just the volatility but also the direction and magnitude of potential price movements.
When interpreting the results, the Value at Risk (VaR) serves as a key metric. VaR calculates the maximum loss expected over a specific time frame with a certain degree of confidence. In this case, the annual VaR at a 95% confidence level has been calculated to be $207.18 for the $10,000 investment in INDS. This suggests that there is a 5% chance that the investment could depreciate by more than $207.18 over a one-year period. For investors, this metric is crucial since it quantifies the potential downside risk and aids in making informed decisions reflecting their individual risk tolerance.
By combining volatility modeling with machine learning predictions, a more comprehensive assessment of risk can be achieved. Volatility modeling helps investors understand the extent of possible price swings, whereas machine learning predictions aim to forecast the likely future performance. The calculated VaR provides a tangible figure for potential financial loss, thereby offering an integrated framework for potential risk assessment of the INDS investment.
Similar Companies in None:
Pacer Benchmark Data & Infrastructure Real Estate SCTR ETF (SRVR), Vident U.S. Diversified Real Estate ETF (PPTY), Global X Data Center REITs & Digital Infrastructure ETF (VPN), Nuveen Short-Term REIT ETF (NURE), Invesco S&P 500 Equal Weight Real Estate ETF (EWRE), Prologis, Inc. (PLD), Duke Realty Corporation (DRE), EastGroup Properties, Inc. (EGP), Stag Industrial, Inc. (STAG), First Industrial Realty Trust, Inc. (FR), Rexford Industrial Realty, Inc. (REXR), Terreno Realty Corporation (TRNO), Monmouth Real Estate Investment Corporation (MNR), Plymouth Industrial REIT, Inc. (PLYM)
https://seekingalpha.com/article/4659356-inds-certainly-worth-a-look
https://seekingalpha.com/article/4662788-the-state-of-reits-january-2024-edition
Copyright © 2024 Tiny Computers (email@tinycomputers.io)
Report ID: 0GTIty
https://reports.tinycomputers.io/INDS/INDS-2024-01-19.html Home