Iron Mountain Inc. (ticker: IRM)
2023-12-24
 Iron Mountain Incorporated (IRM) is a global enterprise dedicated to storing, protecting, and managing information and assets. The company operates a vast storage and information management services network, offering solutions that include records storage, data backup and recovery, document management, and secure shredding. Founded in 1951, Iron Mountain has since grown to service over 225,000 customers, including commercial, legal, banking, healthcare, and government entities, across approximately 50 countries worldwide. The company's real estate network covers more than 90 million square feet across more than 1,450 facilities. Iron Mountain is also expanding its digital solutions to meet the growing demand for data center infrastructure and has been increasingly investing in building a robust digital storage and information management platform. The combination of physical and digital storage capacity allows IRM to offer comprehensive solutions aimed at risk mitigation and business continuity for its clients. As a publicly traded company on the NYSE, Iron Mountain has a reputation for being a stable income-generating stock, particularly due to its conversion to a real estate investment trust (REIT) in 2014, which provides certain tax advantages and requires the distribution of a significant portion of its income directly to shareholders in the form of dividends.
| As of Date: 12/24/2023Current | 9/30/2023 | 6/30/2023 | 3/31/2023 | 12/31/2022 | 9/30/2022 | |
|---|---|---|---|---|---|---|
| Market Cap (intraday) | 20.26B | 17.35B | 16.58B | 15.43B | 14.49B | 12.78B |
| Enterprise Value | 34.22B | 30.96B | 29.91B | 28.57B | 27.05B | 25.09B |
| Trailing P/E | 73.80 | 46.09 | 28.70 | 27.85 | 29.37 | 34.70 |
| Forward P/E | 40.16 | 35.59 | 98.04 | 36.76 | 30.77 | 26.18 |
| PEG Ratio (5 yr expected) | - | - | - | - | - | - |
| Price/Sales (ttm) | 3.81 | 3.33 | 3.22 | 3.03 | 2.92 | 2.66 |
| Price/Book (mrq) | 77.16 | 41.70 | 30.40 | 24.23 | 27.40 | 19.76 |
| Enterprise Value/Revenue | 6.41 | 22.30 | 22.03 | 21.74 | 21.15 | 19.49 |
| Enterprise Value/EBITDA | 20.18 | 68.37 | 84.73 | 71.16 | 54.46 | 48.84 |
| Full Time Employees | 26,000 | Previous Close | 69.05 | Open | 69.25 |
| Day Low | 68.91 | Day High | 69.61 | Dividend Rate | 2.6 |
| Dividend Yield | 3.75% | Payout Ratio | 266.54% | Five Year Avg Dividend Yield | 6.37% |
| Beta | 0.92 | Trailing PE | 73.798 | Forward PE | 37.701 |
| Volume | 775,185 | Regular Market Volume | 775,185 | Average Volume | 1,572,170 |
| Average Volume 10 days | 1,509,990 | Bid | 68.99 | Ask | 69.37 |
| Bid Size | 800 | Ask Size | 1,000 | Market Cap | 20,255,348,736 |
| 52 Week Low | 48.92 | 52 Week High | 69.61 | Price to Sales Trailing 12 Months | 3.793 |
| Fifty Day Average | 62.8404 | Two Hundred Day Average | 58.67095 | Trailing Annual Dividend Rate | 2.506 |
| Trailing Annual Dividend Yield | 3.629% | Enterprise Value | 34,659,872,768 | Profit Margins | 5.21% |
| Float Shares | 289,352,902 | Shares Outstanding | 291,990,016 | Shares Short | 11,486,387 |
| Shares Short Prior Month | 11,997,648 | Shares Percent Shares Out | 3.93% | Held Percent Insiders | 0.849% |
| Held Percent Institutions | 75.165% | Short Ratio | 7.09 | Short Percent of Float | 4.72% |
| Book Value | 0.899 | Price to Book | 77.164 | Net Income to Common | 278,188,992 |
| Trailing EPS | 0.94 | Forward EPS | 1.84 | PEG Ratio | 8.54 |
| Enterprise to Revenue | 6.491 | Enterprise to Ebitda | 19.346 | 52 Week Change | 36.824% |
| S&P 52 Week Change | 24.166% | Last Dividend Value | 0.65 | Total Cash | 170,502,000 |
| Total Cash Per Share | 0.584 | EBITDA | 1,791,604,992 | Total Debt | 14,411,665,408 |
| Quick Ratio | 0.672 | Current Ratio | 0.812 | Total Revenue | 5,339,509,248 |
| Debt to Equity | 3383.806 | Revenue per Share | 18.307 | Return on Assets | 4.128% |
| Return on Equity | 53.86% | Gross Profits | 2,914,454,000 | Free Cash Flow | 21,919,624 |
| Operating Cash Flow | 1,033,713,984 | Earnings Growth | -53% | Revenue Growth | 7.9% |
| Gross Margins | 56.991% | EBITDA Margins | 33.554% | Operating Margins | 20.328% |
Based on the provided technical analysis (TA) data and fundamental financial data for IRM on the last trading day, the following insights reflect a blend of the identified technical indicators and fundamental metrics:
-
MACD (Moving Average Convergence Divergence): The MACD value is positive, with the histogram also being positive. This suggests that the stock is currently in an uptrend, and there's bullish momentum.
-
RSI (Relative Strength Index): The RSI is above 70 which typically indicates that a stock might be overbought. However, it doesnt always imply an immediate reversal, as stocks can remain overbought for extended periods during strong trends.
-
Bollinger Bands: The closing price is above the upper Bollinger Band. This may indicate a potential price pullback or a continuation of the upward trend if the price stays above the band.
-
Moving Averages: The closing price is above both the short-term and long-term moving averages (SMA_20 and EMA_50), which shows a continued uptrend.
-
OBV (On-Balance Volume): The OBV is relatively flat. There's no significant volume confirming the uptrend, which could question the sustainability of the current price movement.
-
Stochastic Oscillator: Both %K and %D are above 90. This is typically a sign that the stock may be overbought, which could precede a price correction.
-
ADX (Average Directional Index): An ADX value above 25 suggests a strong trend, and here it is above 30, which supports a strong current trend.
-
Williams %R: The value is close to -5 indicating that the stock might be extremely overbought.
-
CMF (Chaikin Money Flow): A positive CMF indicates buying pressure, which could sustain the uptrend.
-
Parabolic SAR: The dots are below the price, signifying an uptrend, and offer support levels for the price.
Fundamentally, the company's market capitalization and enterprise value show substantial growth, suggesting increased valuation and potentially positive investor sentiment. The trailing P/E ratio, although high, might reflect expectations of future earnings growth not captured by the P/E alone. The enterprise value to revenue and EBITDA ratios have significantly improved, which may be indicative of the company's operational efficiency and ability to turn revenue into profit.
However, price multiples like P/S and P/B are quite high, suggesting the stock is possibly overvalued compared to its sales and book value. This could be a point of concern if the market reevaluates the company's sustainable growth rate.
Considering the overall bullish technical indicators, paired with strong fundamental growth signals, it's likely that the stock's price will continue to trend upwards in the coming months. However, the high valuation multiples and certain signs of overbought conditions, such as the high RSI and Williams %R, suggest that investors should monitor for potential pullbacks or price consolidations as the market digests the gains and reevaluates the company's growth prospects. Any changes in the company's fundamental performance or broader market sentiment could notably influence the stock price movement, either reinforcing the bullish trend or prompting a correction. Therefore, maintaining vigilance on evolving market conditions and the company's forthcoming financial results would be prudent.
Iron Mountain Incorporated (IRM), headquartered in Boston, Massachusetts, stands as a testament to the strength and resilience that a well-diversified real estate investment trust (REIT) can achieve. Specializing in storage and information management services, Iron Mountain boasts a significant global footprint, serving over 225,000 clients across various industries and geographies. With a business model that emphasizes stable and recurring revenue streams, Iron Mountain charges its clients fixed periodic storage rental fees based on the volume of records stored. This model has proved successful, offering investors a strong case for portfolio inclusion due to consistent returns and potential for growth.
The financial health of Iron Mountain is robust, as illustrated by its recent third-quarter financial report. Despite missing the Zacks Consensus Estimate for adjusted funds from operations (AFFO) by a narrow margin, the company reported a year-over-year increase of 1%. This AFFO growth was driven by an increase in adjusted EBITDA, which showcases the company's ability to grow earnings in a sustainable manner. Moreover, the stock's performance has been impressive, with a 6.2% increase in value over a three-month period, outpacing industry growth.
One of Iron Mountain's core strengths lies in its diversified tenant base and the breadth of its revenue sources. The company boasts a remarkable record of having no individual customer amount to more than 1% of total revenues. Such a diversified revenue approach, paired with a remarkable 93% retention rate in the records management business and solid retention in the global data center segment, lays a strong foundation for Iron Mountain's continued cash flow stability.
Iron Mountain's proactive nature is evident in its recent strategic expansions, particularly within the rapidly evolving data center sector. The company leased an impressive 65 megawatts of data center capacity in just the third quarter, demonstrating its agility in capturing the growing demand for data storage and management. This expansion is critical as it complements Iron Mountain's existing storage operations and opens new avenues for growth.
The company's financial performance further solidifies its positioning in the market. Iron Mountain has recorded remarkable FFO per share growth of 15.93% over a three to five-year period, significantly outshining the industrys average. This performance, complemented by substantial liquidity and the absence of major debt maturities until 2027, equips Iron Mountain with ample capability to pursue its strategic growth initiatives.
Iron Mountain's resilience is also reflected in its cash flow projections, which indicate an 11.88% increase in comparison to the industry's projected 8.10%. Moreover, Iron Mountain's return on equity surpasses the industry average, indicating a more efficient use of shareholders' equity. These financial indicators, when viewed in conjunction, paint a picture of a company that is not only maintaining its financial health but also enhancing its capacity to generate shareholder value.
Against the backdrop of a cautious REIT market, Iron Mountain's dividends have served as a source of attraction for investors looking for high-dividend yielding opportunities, much like its industry peer, W. P. Carey Inc. Despite the overall REIT sector experiencing volatility, Iron Mountain has used its solid operational model and strategic diversification to maintain steady performance.
In the current investment climate, the merits of Iron Mountain's niche focus on information storage and management as well as the broader REIT industry risks must be considered. Iron Mountain has navigated market changes by capitalizing on essential services and information management resilience, which positions it as a reliable candidate in investors portfolios even amidst ongoing economic downturns and market unpredictability.
Analyzing the company from an income investment perspective, Iron Mountain finds comparison with other big-yield opportunities such as Closed-End Funds (CEFs) and Master Limited Partnerships (MLPs). The company, given its reliable dividend yields and unique business model, stands alongside other high-yield investments. The wisdom in such comparisons is in understanding the balance between high management fees and operational expenses, interest rate risks, and potential return of capital (ROC) elements that come with such investments.
When looking at Iron Mountain's financial health and investment value, it's significant to note the company's initiatives to foster high returns on equity (ROE), demonstrating a powerful capacity to manage investments and reward shareholders. This focus has allowed Iron Mountain to report an average earnings surprise of 2.1%, highlighting the company's operational resilience, and a sustained ability to exceed earnings expectations. With economic indicators such as increased U.S. consumer confidence and heightened buying intentions, Iron Mountain's efficient use of financial resources offers a high rate of return, making it a stabilizing force among investment options.
Iron Mountain has also been subject to a careful analysis regarding insider trading activities. Notably, evaluating the recent sale by Executive Vice President Deborah Marson of 2,000 shares and the wider pattern of insider selling calls into question the internal confidence of company leadership. However, any insider activity could be representative of personal financial management rather than an overt comment on the company's future outlook.
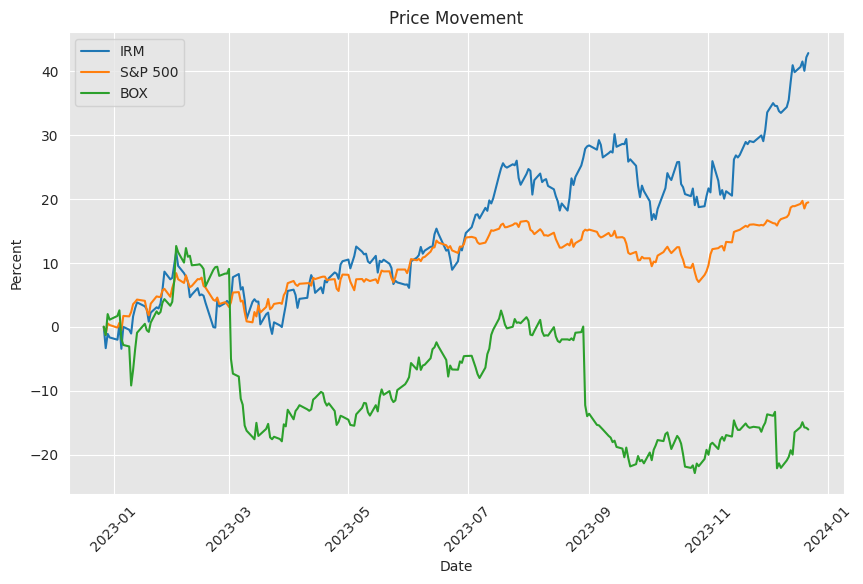
Amid conversations about insider activities and market valuations, IRM recorded a substantial 27% year-to-date increase in its stock performance. This growth has been rooted in the companys resilient storage and records management businesses, along with shrewd acquisitions and expansions into the data center sector. Iron Mountain's financial strategies such as an increase to its liquidity and a low leverage ratio strengthen investor appeal due to the company's financial prudence and sustained growth capabilities.
Nevertheless, challenges do exist for Iron Mountain in the form of industry pressures and the impact of external economic factors including interest rates. Even so, comparative analysis within the REIT sector, looking at counterpart companies like EastGroup Properties and Stag Industrial, reveals a vibrant and competitive market. Such analysis underscores the necessity for Iron Mountain to continuously evolve and strategize aptly to uphold its market leadership.
Finally, Iron Mountain's strong Q3 2023 financial performance, bolstered by strategic gains from Project Matterhorn, positions the company on a path of record-breaking revenue and EBITDA. The accelerated growth in both the physical storage and data center divisions signals Iron Mountain's capacity to evolve and grow organically. With foresight and confidence indicated by revised capital expenditure projections and a low leverage ratio, the company's management has expressed a positive outlook for Iron Mountains future, focusing on innovation and customer service as driving forces.
Similar Companies in Cloud Storage & File Sharing Service:
Box, Inc. (BOX), DocuSign, Inc. (DOCU), Dropbox, Inc. (DBX), Shred-it International Inc. (Private), Xerox Holdings Corporation (XRX)
News Links:
https://finance.yahoo.com/news/key-reasons-add-iron-mountain-150100635.html
https://seekingalpha.com/article/4631121-wp-carey-30-big-yield-reits-risk-reward-edition
https://seekingalpha.com/article/4632190-pdi-100-big-yield-cefs-reits-mlps-these-3-worth-considering
https://finance.yahoo.com/news/top-5-stocks-high-roe-131400205.html
https://www.fool.com/investing/2023/12/11/it-might-be-time-to-sell-these-2-stocks-heres-why/
https://finance.yahoo.com/news/insider-sell-alert-evp-deborah-060524734.html
https://finance.yahoo.com/news/iron-mountains-irm-stock-rises-155100900.html
https://finance.yahoo.com/news/insider-sell-iron-mountain-incs-200349208.html
https://finance.yahoo.com/m/28af6253-6748-324a-801a-501d2fdb6e0a/it-might-be-time-to-sell.html
https://seekingalpha.com/article/4633380-sell-alert-2-reits-getting-risky
https://www.fool.com/investing/2023/08/17/3-dividend-stocks-that-are-dirt-cheap-right-now/
https://www.fool.com/investing/2023/12/19/heres-why-i-just-sold-these-2-blue-chip-stocks-eve/
Copyright © 2023 Tiny Computers (email@tinycomputers.io)
Report ID: SDIpsMy
https://reports.tinycomputers.io/IRM/IRM-2023-12-24.html Home