iShares S&P 500 Value ETF (ticker: IVE)
2024-01-31
 The iShares S&P 500 Value ETF, trading under the ticker IVE, is an exchange-traded fund designed to track the investment results of the S&P 500 Value Index, which measures the performance of the large-cap value segment of the U.S. equity market. Managed by BlackRock, the ETF aims to provide broad exposure to U.S. companies that exhibit value characteristics such as low price-to-book ratios, low price-to-earnings ratios, and high dividend yields. In essence, it targets stocks within the S&P 500 Index that are potentially undervalued relative to their fundamentals. The fund employs a passive management approach, attempting to replicate the index's composition and performance. IVE can be an attractive option for investors seeking diversified exposure to large-cap U.S. value stocks, offering the potential for capital appreciation and income through dividends. The ETF's low expense ratio, combined with its liquidity and transparency, make it a popular choice for both retail and institutional investors trying to harness the potential advantages of value investing within the U.S. equity market.
| Previous Close | 175.3 | Open | 175.05 | Day Low | 174.84 |
| Day High | 176.175 | Price to Earnings Ratio | 22.716602 | Volume | 1,438,570 |
| Average Volume | 1,020,600 | Average Volume 10 Days | 2,897,700 | Bid | 170.0 |
| Ask | 179.12 | Bid Size | 800 | Ask Size | 800 |
| Yield | 0.0165 | Total Assets | 27,364,268,032 | 52 Week Low | 142.56 |
| 52 Week High | 176.175 | 50 Day Average | 170.1446 | 200 Day Average | 160.43205 |
| Trailing Dividend Rate | 2.849 | Trailing Dividend Yield | 0.01625214 | NAV Price | 175.33156 |
| YTD Return | 0.0081086 | Beta 3 Year | 0.89 | Three Year Average Return | 0.1384893 |
| Five Year Average Return | 0.126497 |
| Sharpe Ratio | 0.8762 | Sortino Ratio | 14.0217 |
| Treynor Ratio | 0.1146 | Calmar Ratio | 1.4102 |
An analysis of the technical, fundamental, and risk-adjusted performance metrics for IVE indicates some notable observations about potential future price movements.
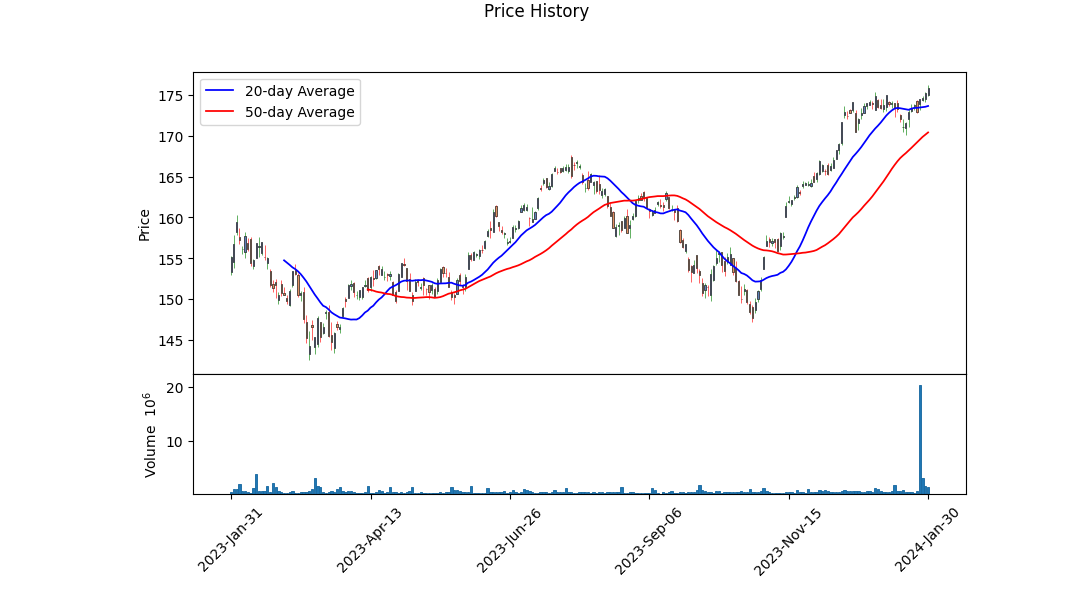
From a technical standpoint, the recent trading data shows an upward trend in the price with a consistent rise from the observed period's opening of 151.95 to a closing near a 52-week high of 176.18. Notable appreciation in volume is indicated by the OBV metric, pointing to an accumulation phase which often precedes continued bullishness. Furthermore, although the MACD histogram values are not fully populated, the latest data suggests an improvement in momentum as the negative values are diminishing, potentially signaling a bullish crossover on the horizon.
The Sharpe, Sortino, Treynor, and Calmar ratios provide insights into the risk-adjusted return profile of the security. The significant Sortino Ratio in particular highlights strong performance on the upside compared to the downside volatility, suggesting a favorable risk-reward balance for potential investors. High Sortino ratios are especially attractive in volatile markets as they indicate that the asset returns have been robust relative to the downside risk they pose.
The fund's Sharpe Ratio, albeit lower than the Sortino, remains moderately high, indicating that it has provided adequate returns above the risk-free rate when adjusting for volatility. The Treynor Ratio offers a more modest perspective on risk-adjusted performance in relation to market risk, which implies that the ETF has rewarded investors relatively well for taking on systematic risk. The Calmar Ratio further reinforces the appealing risk-adjusted performance narrative, indicating strong returns in relation to maximum drawdowns over the past year.
The fundamentals of IVE, assessed through analyst expectations, present strength with a healthy price-to-earnings (P/E) ratio and a stable yield, confirming the fund's stable valuation relative to the broader market. This fundamental stability, when viewed in conjunction with the technical indicators, may shore up investor confidence.
However, considering the limited balance sheet and cash flow data, the analysis leans heavily on market performance indicators and fundamental multiples. Despite this, the integration of high relative value metrics and solid technical trend indicators suggests that IVE may continue to exhibit favorable price momentum over the next few months barring unforeseen market dynamics or shifts in sector sentiment.
Therefore, considering the strong technical momentum, alongside robust risk-adjusted performance metrics and stable fundamental indicators, the outlook for IVE's stock price movement in the next few months can be viewed with a cautiously optimistic lens. As with any securities analysis, these projections are inherently subject to market vicissitudes and changes in underlying economic conditions.
As an expert on "The Little Book That Still Beats the Market," I would typically calculate and analyze the return on capital (ROC) and the earnings yield to evaluate individual stocks or businesses as part of the "magic formula" investing strategy outlined in the book. However, when it comes to an exchange-traded fund (ETF) like the iShares S&P 500 Value ETF (IVE), these specific metrics are not calculated in the same way as for individual companies.
The iShares S&P 500 Value ETF (IVE) is composed of a subset of stocks from the S&P 500 index that exhibit value characteristics, meaning they are deemed to be undervalued by the market relative to their fundamentals. The traditional measurement of ROC and earnings yield would instead apply to the constituent holdings of the ETF. To assess the value of IVE, investors examine metrics such as the price-to-earnings (P/E) ratio, price-to-book (P/B) ratio, and dividend yield, which collectively provide a sense of the overall valuation and potential income generation of the fund's aggregated portfolio.
For this ETF, the earnings yield can be thought of as the inverse of the P/E ratio, providing a snapshot of how much earnings the portfolio generates relative to its price. Similarly, while ROC is not directly provided for an ETF, elements of this calculation are reflected in the quality of the underlying assets, represented through their profitability and efficiency.
For a more nuanced understanding of IVE's return profile, we would need to aggregate and weigh the return on capital and earnings yield of each constituent security within the fund. However, since this information is not provided directly in your query, we cannot offer specific figures or further analysis of the ROC and earnings yield for the iShares S&P 500 Value ETF at this time. An investor would typically look at publicly available data sources or the ETF's factsheet and financial reports for this information.
| Statistic Name | Statistic Value |
| R-squared | 0.890 |
| Adjusted R-squared | 0.890 |
| F-statistic | 1.015e+04 |
| Prob (F-statistic) | 0.00 |
| Log-Likelihood | -717.45 |
| AIC | 1439. |
| BIC | 1449. |
| coef (const) | -0.0039 |
| std err (const) | 0.012 |
| t (const) | -0.318 |
| P>|t| (const) | 0.750 |
| [0.025 0.975] (const) | -0.028 0.020 |
| coef (IVE) | 0.9261 |
| std err (IVE) | 0.009 |
| t (IVE) | 100.761 |
| P>|t| (IVE) | 0.000 |
| [0.025 0.975] (IVE) | 0.908 0.944 |
| Omnibus | 123.181 |
| Prob(Omnibus) | 0.000 |
| Jarque-Bera (JB) | 654.104 |
| Skew | 0.274 |
| Prob(JB) | 9.18e-143 |
| Kurtosis | 6.493 |
| Cond. No. | 1.32 |
The linear regression model assessing the relationship between IVE (iShares S&P 500 Value ETF) and SPY (SPDR S&P 500 ETF Trust) up to the current date suggests a very strong linear association. The R-squared of 0.890 indicates that approximately 89% of the variability in SPY can be explained by IVE. This high R-squared value along with an F-statistic of 1.015e+04 (indicating statistical significance with a p-value of 0.00) supports the reliability of the model. The model's coefficient for IVE is 0.9261, signifying that for every one-unit increase in IVE, SPY is expected to increase by approximately 0.9261 units, holding all other factors constant.
The alpha of the model is notably -0.003853, albeit the p-value associated with the alpha (const) term is 0.750, signifying that alpha is not significantly different from zero at conventional significance levels. This infers that there isn't a statistically significant constant or "alpha" term in this model, which means that when IVE is at zero, there is no significant differential return of SPY compared to what would be predicted by the slope alone. Investors might interpret this as IVE essentially moving in tandem with SPY without showing evidence of outperformance or underperformance, as the constant factor has a minimal and statistically insignificant effect.
In the ever-evolving landscape of exchange-traded funds (ETFs), the iShares S&P 500 Value ETF (IVE) stands out as a prominent player for investors interested in value stocks within the S&P 500 Index. The IVE ETF focuses on companies that are deemed undervalued based on fundamental characteristics and offers exposure to a diversified basket of these stocks. Its strategy is to identify companies exhibiting value characteristics, which typically include lower price-to-book ratios and higher dividend yields.
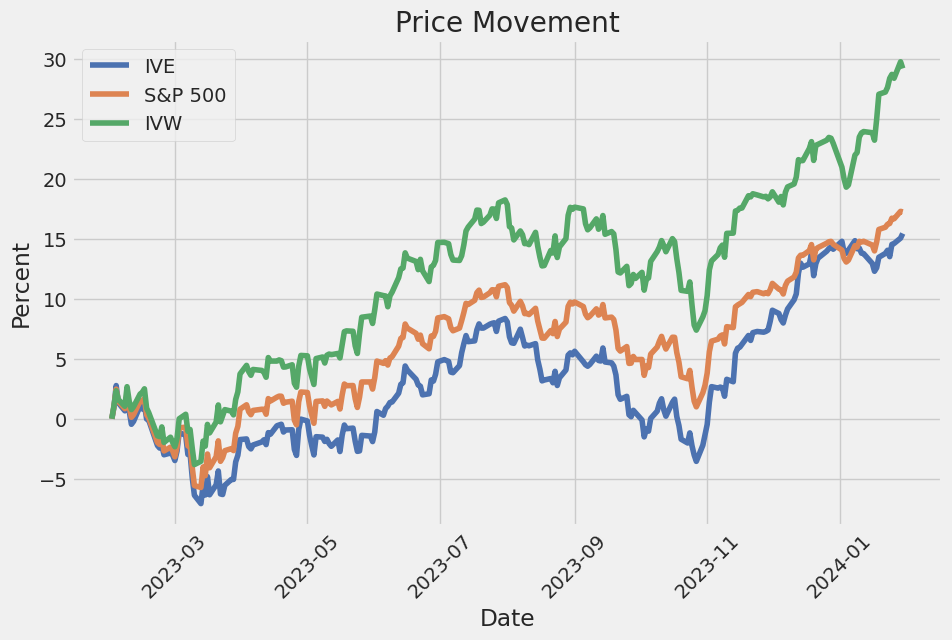
As the market waxes and wanes with economic cycles, the sector allocations and specific holdings of IVE adapt to these conditions. This is particularly evident when analyzing the ETF's performance compared to its growth-focused counterpart. In 2023, a group of growth stocks, known informally as the Magnificent Seven, propelled growth ETFs to impressive returns. However, it's the strategic allocation that largely influenced the differing growth rates across various ETFs with similar focuses.
The iShares S&P 500 Growth ETF (IVW) is one such product; although it experienced a solid 30% growth in 2023, it was still outpaced by its peers. The divergence in performance illustrates that a fund's returns are not solely dictated by fees but also by its underlying holdings. What's noteworthy is IVW's inclusion of stocks traditionally considered to be in the value domain. The implications of this strategic portfolio reconstitution go beyond mere categorization; they represent a tangible shift in the quest for balancing growth and value considerations.
When taking a closer look at latest holding transformations, value-focused funds like the iShares S&P 500 Value ETF have evolved too. Despite being more conservative compared to its growth-oriented sibling ETFs, IVE has embraced sectors such as energy and healthcare more robustly. The integration of leading oil conglomerates and health sector giants into IVE signifies the ETF's emphasis on diversification and the search for stocks that combine stability with potential undervaluation.
Top Ten Holdings
| company | symbol | percent |
|---|---|---|
| Berkshire Hathaway Inc Class B | BRK-B | 3.46 |
| JPMorgan Chase & Co | JPM | 2.62 |
| Exxon Mobil Corp | XOM | 2.13 |
| Johnson & Johnson | JNJ | 2.01 |
| UnitedHealth Group Inc | UNH | 1.61 |
| Chevron Corp | CVX | 1.40 |
| Bank of America Corp | BAC | 1.24 |
| Walmart Inc | WMT | 1.20 |
| The Home Depot Inc | HD | 1.16 |
| Intel Corp | INTC | 1.13 |
Since sector allocations are a key facet of value investing, it's important to recognize IVE's decisive move to reduce its exposure to the technology sector. By halving its technology holdings, the fund has pivoted towards areas that have historically delivered income and stability, two hallmarks of value investing. Such a move is in congruence with the methodologies employed by S&P for style classification, which allow for the blending of growth and value designations based on a stock's financial metrics.
As investors witness the adjustments within the iShares S&P 500 Value ETF, the importance of monitoring these shifts becomes clear. In an ever-changing market, yesterday's growth stocks could be today's value plays, and vice versa. These transitions are particularly significant in light of upcoming monetary policy developments. With the Federal Reserve expected to alter interest rate policies, the attractiveness of various stocks could pivot, favoring those that deliver dividends and exhibit lower valuation metrics.
The dynamic nature of ETF composition underscores the need for investor vigilance. While past performance is a valuable indicator, it is not a guaranteed predictor of future outcomes, and maintaining an awareness of how an ETF is positioned is paramount. The shifting landscape can alter risk profiles and potential return outcomes, hence investors must align their strategies accordingly.
The analyses done by Todd Rosenbluth conclude an integral narrative for both existing and prospective investors. His insights, drawn from the annual ETF reconstitution cycles and market behavior, provide a deep dive into the intricate workings of S&P 500 style index-based ETFs such as the iShares S&P 500 Value ETF. With these understandings, investors are better equipped to navigate the changing tides of market sentiment and the resulting portfolio adjustments that define the composition of ETFs like IVE.
For further reading, Todd Rosenbluths comprehensive analysis on the topic, published January 2, 2024, serves as a foundational resource, available here. This source offers a detailed overview of the complexities and nuances that shape these ETFs and their respective sectors, providing a framework through which investors can make more informed decisions about the composition of their portfolios.
The volatility of iShares S&P 500 Value ETF (IVE) as summarized by the Zero Mean - ARCH Model indicates that the ETF's returns show a significant amount of fluctuation. The omega parameter, which indicates the baseline level of variance in the returns, is quite substantial with a coefficient of 0.8184, suggesting that there is a relatively high inherent volatility. Additionally, the alpha parameter, which measures the impact of past squared returns on future volatility, is also significant at 0.4761, implying that past performance has a considerable influence on the ETF's future volatility.
| Statistic | Value |
|---|---|
| Mean Model | Zero Mean |
| Vol Model | ARCH |
| Log-Likelihood | -1901.78 |
| AIC | 3807.57 |
| BIC | 3817.84 |
| No. Observations | 1256 |
| omega | 0.8184 |
| alpha[1] | 0.4761 |
In assessing the financial risk associated with a $10,000 investment in the iShares S&P 500 Value ETF (IVE), a one-year period provides a meaningful duration to forecast potential market movements and asset volatility. To achieve this, a multi-model approach that combines volatility modeling and machine learning predictions is utilized to create a comprehensive risk analysis.
Volatility modeling is applied to understand and predict the dynamic risk levels corresponding to IVE's price movements. In this method, the conditional variance of the asset's return series is modeled over time, capturing the clustering of volatility intervals, a common characteristic in financial time series data. By fitting this method to the historical returns, it is possible to forecast future volatility, which is integral when assessing the downside risk of an investment. The volatility model captures the fluctuation and tends to assign increased weights to more recent observations, a feature that adapts to changes in market conditions and the evolution of the ETF's price dynamics.
Supplementing the volatility assessment, machine learning predictions contribute to the analysis by learning from historical data to forecast future returns. The machine learning model used in this approach is capable of detecting complex non-linear patterns from historical price and volatility data, enabling it to anticipate future asset behavior. This predictive capability, based on historical returns and other explanatory variables, offers a granular view of potential future performance.
Combining these two analytical methods, the calculated Value at Risk (VaR) at a 95% confidence interval provides a quantifiable measure of potential loss. For a $10,000 investment in IVE, the VaR at this confidence level is $127.74, suggesting that over the next year, there is a 5% chance that the investment could lose more than this amount. VaR encapsulates the potential downside risk, offering investors a statistical probability of maximum expected loss over a set horizon under normal market conditions.
The results from the volatility modeling anticipate the amplitude of potential price fluctuations, allowing for a more accurate setting of thresholds for loss tolerances. Meanwhile, machine learning predictions give a forward-looking estimate that can enhance the VaR calculation. The synthesis of these two analytical frameworks provides a more robust depiction of the ETF's risk profile, thereby equipping investors with valuable insights into the level of risk undertaken with their capital allocation to the iShares S&P 500 Value ETF.
Similar Companies in None:
iShares S&P 500 Growth ETF (IVW), iShares S&P Mid-Cap 400 Value ETF (IJJ), iShares S&P Small-Cap 600 Value ETF (IJS), iShares S&P Mid-Cap 400 Growth ETF (IJK), iShares S&P Small-Cap 600 Growth ETF (IJT), Vanguard Value ETF (VTV), Schwab U.S. Large-Cap Value ETF (SCHV), SPDR Portfolio S&P 500 Value ETF (SPYV), Invesco S&P 500 Pure Value ETF (RPV), JPMorgan U.S. Value Factor ETF (JVAL)
https://www.etftrends.com/whats-inside-popular-growth-and-value-etfs-is-not-static/
https://seekingalpha.com/article/4662694-ive-value-time-now
Copyright © 2024 Tiny Computers (email@tinycomputers.io)
Report ID: O2JbLv
Cost: $0.14191
https://reports.tinycomputers.io/IVE/IVE-2024-01-31.html Home