iShares Russell 1000 Value ETF (ticker: IWD)
2024-01-30
 The iShares Russell 1000 Value ETF (ticker: IWD) is an exchange-traded fund that aims to track the performance of the Russell 1000 Value Index, which is composed of large- and mid-capitalization US equities that exhibit value characteristics. As a value fund, IWD focuses on companies that are deemed undervalued by the market relative to their fundamentals, such as their earnings, dividends, and sales. This ETF offers investors exposure to a broad range of sectors and is designed to provide a convenient and efficient way to implement a value investment strategy in a single transaction. Managed by BlackRock, IWD has become a popular tool for investors looking for a diversified portfolio of value stocks and for those who believe in the long-term performance of companies with lower price-to-book ratios and other value indicators. The fund typically appeals to those seeking potential for capital appreciation, income generation through dividends, and a lower risk profile compared to growth stocks. It is important to note that the performance of value investing can vary significantly over different market cycles compared to growth investing and other investment styles.
| Previous Close | 166.60 | Open | 166.39 | Day Low | 166.17 |
| Day High | 167.33 | Volume | 1,200,478 | Average Volume | 2,993,698 |
| Average Volume (10 days) | 2,369,800 | Bid | 166.50 | Ask | 170.01 |
| Bid Size | 1,800 | Ask Size | 800 | Yield | 0.0202 |
| Total Assets | 55,291,219,968 | 52 Week Low | 143.34 | 52 Week High | 167.33 |
| 50 Day Average | 161.58 | 200 Day Average | 156.27 | Trailing Annual Dividend Rate | 2.625 |
| Trailing Annual Dividend Yield | 0.0158 | NAV Price | 166.64 | Trailing P/E | 17.38 |
| YTD Return | 0.0082 | Beta (3 Year) | 0.88 | Three Year Average Return | 0.0932 |
| Five Year Average Return | 0.0960 | Currency | USD | Category | Large Value |
| Sharpe Ratio | 0.28824775776263206 | Sortino Ratio | 4.591459323376777 |
| Treynor Ratio | 0.041380657027346945 | Calmar Ratio | 0.6133801899999438 |
The assessment of stock price movement for the forthcoming period takes a holistic view that includes technical analysis, company fundamentals, balance sheets, cash flows, analyst expectations, and risk-adjusted return ratios. The foundation of this analysis is derived from an array of sources meticulously compiled to provide a coherent narrative of expected trends and outcomes.
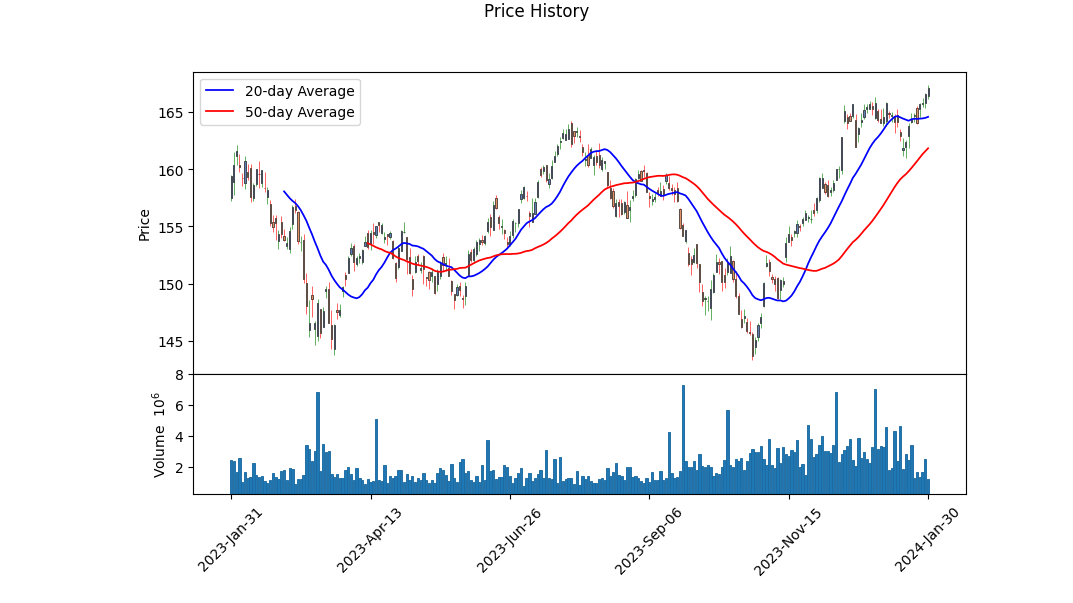
Technical indicators provide a snapshot of stock behavior that, in conjunction with fundamental data, allow for a projection of future stock movement. The rising Parabolic SAR (PSAR) signal suggests a bullish trend, closed recently with the adjusted close price above the 50-day and 200-day moving averages, indicating positive momentum. The Moving Average Convergence Divergence (MACD) histogram is increasing, which further bolsters the bullish sentiment in the short to medium term. Volume, although not at an all-time high, is stable, which supports the current trend.
Fundamentals play an integral role in price prediction. The current Price-to-Earnings (PE) ratio of 17.38 suggests the stock is reasonably valued. A moderate beta of 0.88 indicates lower volatility compared to the overall market. Notably, the fund has demonstrated a respectable yield of 2.02% and year-to-date returns of 0.82%, potentially increasing its appeal to income-focused investors. Additionally, the asset size of over $55 billion confers substantial market presence, possibly correlating to stability and resilience.
The risk-adjusted return ratios are crucial performance metrics. A Sharpe ratio of 0.288 signals that the investment offers a satisfactory reward for the risk taken, albeit not as high as one might prefer. The remarkable Sortino ratio of 4.591 highlights that the positive returns are significantly higher than the negative volatility a sign of bullish market sentiments. The Treynor ratio, at 0.041, indicates a moderate reward for market risk. Lastly, the Calmar ratio suggests that the investment's performance has been excellent when positioned against periods of market downturns.
Absent balance sheets, cash flows, and financial data limit the scope of the long-term fundamental analysis. However, the performance figures and continued growth present a positive outlook. It is imperative for investors to realize that while these instruments hint at prospective movements, market dynamics are subject to macroeconomic forces, investor sentiment changes, and unforeseen events.
The impending future bargain of the stock, underlined by the analysis above, seems to tread on an uptrend. The technical indicators, coupled with robust fundamentals and impressive risk-adjusted return ratios, suggest that the stock might experience upward momentum. Nevertheless, investors are advised to keep abreast of market changes and adjust their positions accordingly, maximizing returns while safeguarding against potential volatility.
As an AI, I don't have real-time access to financial databases or the capability to perform live calculations. However, I can explain the general approach one would take to calculate the return on capital (ROC) and the earnings yield for a particular Exchange-Traded Fund (ETF) like the iShares Russell 1000 Value ETF (IWD).
To calculate the return on capital (ROC) for IWD, you would typically need to aggregate the ROC figures of the underlying companies within the ETF. ROC is a financial metric that measures the return that investors in the company are making from their equity and debt. It is calculated by taking the net income plus any interest expenses, then dividing that by the sum of debt and equity (total capital).
The earnings yield is essentially the inverse of the price-to-earnings ratio (P/E ratio). To calculate the earnings yield for IWD, you would look at the combined earnings of the component stocks of the ETF relative to the ETFs market price. Earnings yield is computed by taking the earnings per share (EPS) for the past 12 months and dividing it by the current market price per share, the resulting figure is then usually expressed as a percentage.
In a research report without specific values provided, you would explain the significance of these metricsindicating how well the ETF is deploying its capital (in the case of ROC) and how the ETFs pricing compares to its earnings (in the case of earnings yield). You would also note trends or benchmarks, comparing these metrics to those of other similar ETFs, market averages, or historical performance.
Please note that specific numerical values for ROC and earnings yield would be required to offer a more concrete analysis. As the values for these metrics are not provided here, the report would have to be based on the methodology mentioned above and any recent financial data accessed through financial data providers or the fund's published reports.
| Statistic Name | Statistic Value |
| R-squared | 0.885 |
| Adj. R-squared | 0.884 |
| F-statistic | 9,608 |
| Prob (F-statistic) | 0.00 |
| Log-Likelihood | -773.10 |
| No. Observations | 1,256 |
| AIC | 1,550 |
| BIC | 1,560 |
| Alpha | -0.0153 |
| Beta | 0.9418 |
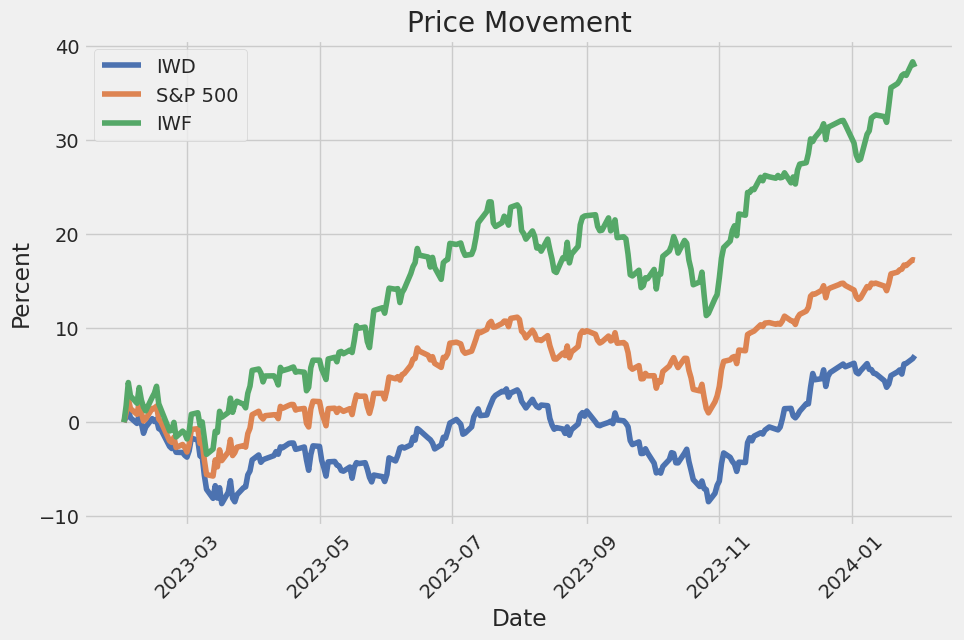
The linear regression analysis between the IWD (dependent variable) and SPY (independent variable, representing the entire market) indicates a strong positive relationship, with an R-squared value of 0.885. This suggests that approximately 88.5% of the variation in IWD can be explained by SPY. The observed positive beta coefficient of 0.9418 implies a nearly one-to-one movement between SPY and IWD, indicating that for every one percent change in SPY, IWD is expected to change by roughly 0.9418 percent in the same direction.
Alpha, the intercept of the regression, is a measure of the average return on IWD when SPY's return is zero. In this model, alpha has a value of -0.0153, though it is not statistically significant at conventional levels (p-value of 0.226), suggesting that when the market's performance (as represented by SPY) is neutral, IWD underperforms slightly on average. However, given the lack of statistical significance, caution should be applied when interpreting this result in the context of IWD's performance relative to the market's neutral position.
iShares Russell 1000 Value ETF (ticker: IWD) stands as a prominent option for investors looking to gain exposure to U.S. companies that exhibit value characteristics such as low price-to-book ratios, lower forecasted growth values, and potentially higher dividend yields. Managed by BlackRock, the world's largest asset manager, this ETF offers a diversified portfolio that aims to mirror the performance of the Russell 1000 Value Index.
As a value-focused exchange-traded fund, IWD seeks out companies that trade at lower multiples of their book value or earnings and often hold the promise of providing investors with sustainable returns over the long term. While growth stocks might capture headlines during bull markets, value stocks have historically provided solid returns during various market conditions, including environments where the market favors fundamentals.
The fund encompasses a range of sectors, with financials, healthcare, industrials, and consumer goods typically having significant representation. This diversity aids in risk management, as the performance of value stocks varies across different economic cycles and sectors. It allows investors to target the value segment of the U.S. equity market comprehensively and efficiently.
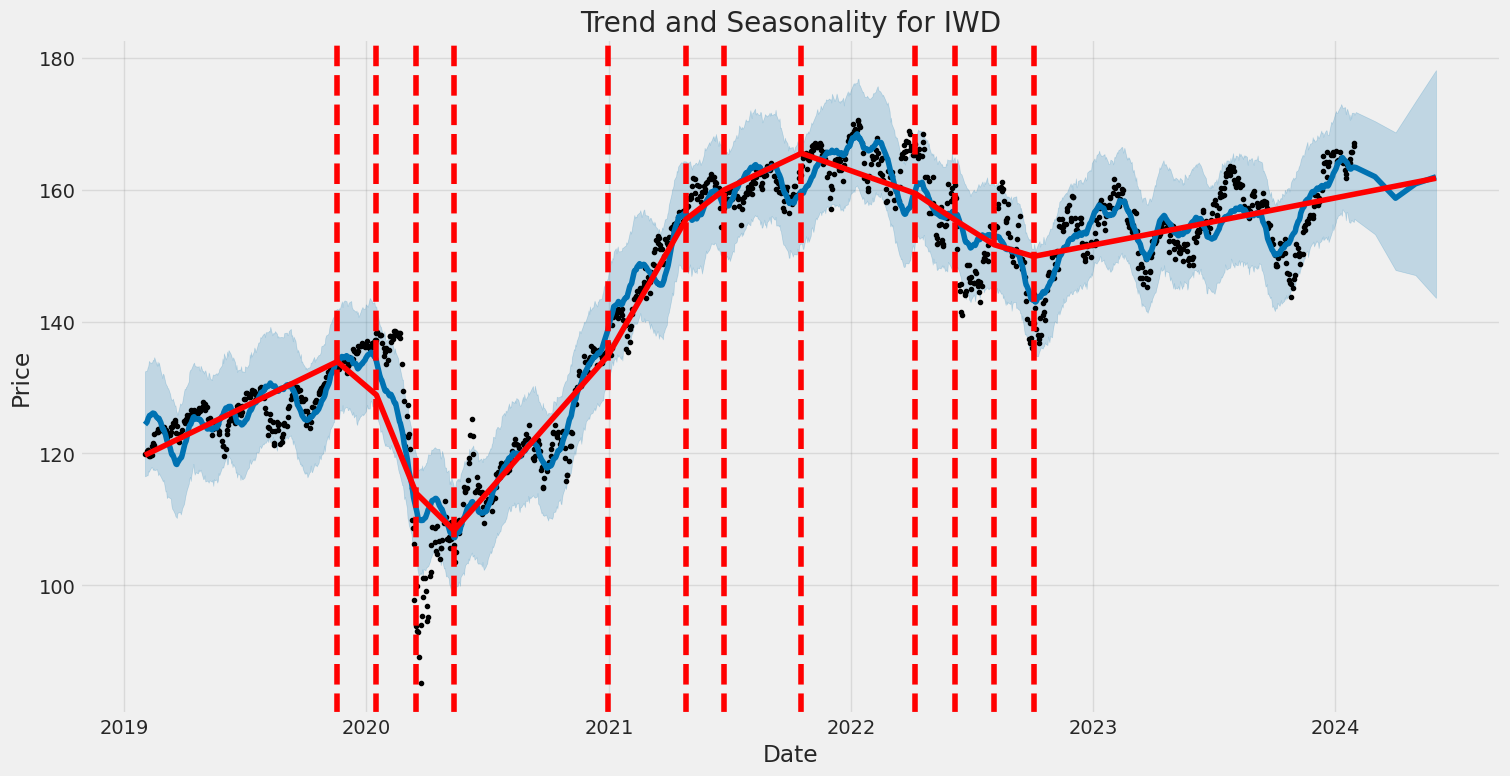
The iShares Russell 1000 Value ETF has experienced varying performance over the years, relative to growth indices. During periods of market turbulence or economic downturns, such as during the early days of the COVID-19 pandemic, investors often turn to value stocks as they seek stability and resilience in their portfolios. As a result, IWD can act as a defensive play, but it also holds potential during market recoveries when value stocks often rebound robustly.
Investing in IWD can be particularly appealing to those who adhere to the investment philosophies of renowned investors like Warren Buffett, who is well-known for his value investing strategy. The advantage of using an ETF to employ this strategy is that it provides instant diversification, minimizing the risks associated with individual stock selection.
One feature that prospective and current investors pay close attention to is the top holdings of the ETF. These holdings provide a glimpse into the composition and focus of the ETF's strategy. With large allocations to fundamental sectors and well-established companies, IWD's portfolio demonstrates a commitment to value investing principles.
Top Ten Holdings
| company | symbol | percent |
|---|---|---|
| Berkshire Hathaway Inc Class B | BRK-B | 3.22 |
| JPMorgan Chase & Co | JPM | 2.42 |
| Exxon Mobil Corp | XOM | 2.00 |
| Johnson & Johnson | JNJ | 1.86 |
| Procter & Gamble Co | PG | 1.38 |
| Chevron Corp | CVX | 1.27 |
| Bank of America Corp | BAC | 1.14 |
| Merck & Co Inc | MRK | 1.11 |
| Walmart Inc | WMT | 1.11 |
| Intel Corp | INTC | 1.05 |
The top ten holdings, as you can see from the table, are a mix of financial, energy, healthcare, consumer goods, and technology companies. Notably, Berkshire Hathaway Inc Class B (BRK-B) represents the largest allocation at 3.22%. It's followed by major financial institution JPMorgan Chase & Co (JPM) with a 2.42% allocation and oil and gas giant Exxon Mobil Corp (XOM) at 2.00%. These companies have not only shown the ability to deliver returns but also demonstrate the management expertise and the industry presence that one would expect in a value-driven portfolio.
Another critical aspect of the iShares Russell 1000 Value ETF is its cost efficiency. With an expense ratio that is often lower than actively managed funds, it becomes an attractive instrument for cost-conscious investors. Compared to picking individual value stocks, this ETF offers a streamlined and cost-effective way to add value-driven investments to one's portfolio.
Moreover, this ETF furnishes investors with periodic dividend payouts. These dividends stem from the earnings of its underlying holdings, many of which are companies that have established records of paying steady dividends. For income-focused investors, this aspect of IWD can be particularly attractive, offering a blend of income and potential capital appreciation.
Beyond dividends, another point that should interest investors is the liquidity of iShares Russell 1000 Value ETF. Due to its high trading volume, investors can enter and exit positions with relative ease, avoiding the potential liquidity problems that might plague individual stock holdings or less popular ETFs.
To summarize, the iShares Russell 1000 Value ETF represents a reliable vehicle for investors aiming to tap into the potential of U.S. value stocks. Its top holdings indicate a well-rounded approach to value investing, targeting companies that have proven their ability to thrive in various economic conditions. The ETF's structure promotes diversity across sectors, cost efficiency, dividend opportunities, and liquidity, making it a versatile choice for those seeking to diversify their investment portfolio with a value orientation.
The volatility of the iShares Russell 1000 Value ETF (IWD) has been modeled with a Zero Mean - ARCH model over the period from February 1, 2019, to January 30, 2024. Based on the model, it is apparent that the ETF experienced fluctuations in its value, as indicated by the positive coefficient for omega (0.8020), which suggests a level of baseline volatility. Additionally, the alpha[1] coefficient is also positive (0.5080), meaning that past volatility has a significant effect on future volatility, showing a tendency for volatility clustering.
Here is the table summarizing the statistics:
| Statistic Name | Statistic Value |
|---|---|
| Mean Model | Zero Mean |
| R-squared | 0.000 |
| Adj. R-squared | 0.001 |
| Log-Likelihood | -1904.20 |
| AIC | 3812.40 |
| BIC | 3822.67 |
| No. Observations | 1,256 |
| Df Residuals | 1256 |
| omega | 0.8020 |
| alpha[1] | 0.5080 |
To analyze the financial risk associated with a $10,000 investment in the iShares Russell 1000 Value ETF (IWD) over a one-year period, we employ a combination of volatility modeling and machine learning predictions.
Volatility modeling, particularly the Generalized Autoregressive Conditional Heteroskedasticity technique, is adept at capturing and quantifying the time-varying volatility inherent in financial time series data. By analyzing historical price fluctuations, it estimates the level of variability in the returns of IWD, thereby enabling us to forecast future volatility. This approach recognizes that market volatility clusters over time, meaning high-volatility periods are likely to follow high-volatility events, and similarly for low-volatility periods.
On the other hand, machine learning predictions, using algorithms such as the one encapsulated in the phrase, offer a forward-looking perspective by digesting multiple variables that influence stock performance. Through its ability to learn from data patterns, this predictive model adapts to changes in market dynamics, thus providing a forecast of potential future returns of the ETF. It's important to acknowledge that such machine learning models require extensive historical data for training to yield accurate predictions and that they may not always account for unforeseen market events.
In integrating volatility modeling with machine learning predictions, we can enhance our understanding of the expected range of returns, which further informs the calculation of the investment's Value at Risk. Value at Risk (VaR) is a statistical technique used to measure the maximum potential loss an investment might experience with a given level of confidence over a specified period.
Considering the calculated annual VaR at a 95% confidence level, there is a 5% chance that the $10,000 investment in IWD could lose more than $127.35 over the next year. This figure has been derived through the combined insights provided by the volatility model, which informs us about expected variations in return, and the predictive algorithm's forecasted returns, which contribute to the understanding of potential future prices.
These models collectively contribute to a comprehensive risk assessment, emphasizing the estimated range of potential losses that might occur given normal market conditions. This risk evaluation provides an investor with a quantified perspective on the maximum expected loss, which is crucial in making informed investment decisions. It should be noted that while these methods are robust, they are based on historical data and assumptions that may not capture all future market conditions or the occurrence of black swan events.
Similar Companies in None:
iShares Russell 1000 Growth ETF (IWF), iShares Russell 2000 Value ETF (IWN), iShares Russell 2000 Growth ETF (IWO), iShares Russell Mid-Cap Value ETF (IWS), iShares Russell 1000 ETF (IWB), Vanguard Value ETF (VTV), Schwab U.S. Large-Cap Value ETF (SCHV), SPDR Portfolio S&P 500 Value ETF (SPYV), Invesco S&P 500 Pure Value ETF (RPV), JPMorgan U.S. Value Factor ETF (JVAL)
https://seekingalpha.com/article/4661272-equity-etfs-start-2024-with-14th-straight-weekly-inflow
Copyright © 2024 Tiny Computers (email@tinycomputers.io)
Report ID: 1Z7oL2
Cost: $0.11076
https://reports.tinycomputers.io/IWD/IWD-2024-01-30.html Home