JPMorgan Nasdaq Equity Premium Income ETF (ticker: JEPQ)
2024-01-27
 JPMorgan Nasdaq Equity Premium Income ETF (ticker: JEPQ) represents an innovative investment vehicle combining the pursuit of income with growth potential within the equity market. This exchange-traded fund seeks to provide investors with exposure to the high-performing Nasdaq-100 Index while potentially generating income through a covered call strategy. Managed by JPMorgan Chase & Co., JEPQ systematically sells call options on the index to produce income, which is then distributed to shareholders, typically on a monthly basis. This strategy can serve to lower portfolio volatility and provide a cushion against market downturns. However, it might also cap potential gains from the equity holdings, particularly in strongly rising markets, as the sold call options may limit the upside. The ETF's dual focus on income and capital appreciation is designed to appeal to investors looking for equity exposure coupled with an income-oriented approach, thus offering a balanced option for those seeking diversified investment avenues within the growth-oriented technology and non-financial service sectors predominant in the Nasdaq-100.
| Previous Close | 51.80 | Open | 51.80 | Day Low | 51.735 |
| Day High | 51.89 | Trailing P/E | 32.43 | Volume | 2,572,249 |
| Average Volume | 2,664,601 | Average Volume 10 Days | 2,752,060 | Bid | 51.84 |
| Ask | 51.88 | Bid Size | 1,300 | Ask Size | 800 |
| Yield | 0.10% | Total Assets | $8,444,341,248 | 52 Week Low | 41.15 |
| 52 Week High | 51.91 | 50 Day Average | 49.8518 | 200 Day Average | 47.91975 |
| NAV Price | 51.713 | Currency | USD | YTD Return | 3.63% |
| Sharpe Ratio | -34.9581831211622 | Sortino Ratio | -529.86439077047 |
| Treynor Ratio | 0.3611359046075633 | Calmar Ratio | 4.8782590891281155 |
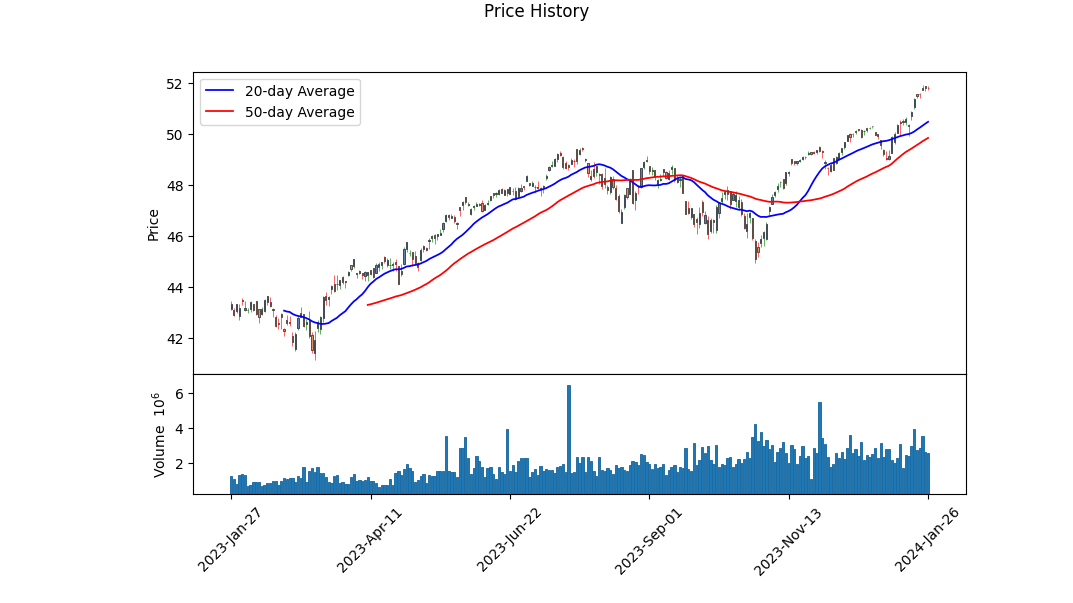
The analysis of JEPQ indicates a complex interplay between technical indicators and fundamental aspects. On the technical front, a positive uptrend is suggested by the incremental increase in the value of the OBV (On-Balance Volume) indicator, which has risen significantly from a level of 0.28735 million to 5.67902 million over the analyzed period. This volume-based metric suggests that buying pressure has been prevalent, which could be a bullish signal for future price movement. Additionally, the MACD (Moving Average Convergence Divergence) histogram has moved into positive territory indicating a possible continuation of the established upward momentum in the price.
The fundamental analysis paints a solid picture with the trailing Price to Earnings (PE) ratio of approximately 32.4 reflecting investors' expectation for the earnings growth. This PE level, compared to industry standards, suggests a market that recognizes JEPQ's potential for profitability. The asset base noted at approximately 8.44 billion alongside a healthy YTD (Year-to-Date) return of around 3.63% further emphasizes sturdy fund performance in the fiscal year.
However, remarkably negative Sharpe and Sortino ratios present a cautionary narrative, as they reflect drastic underperformance compared to the risk-free rate. Conversely, the Treynor and Calmar ratios are positive, with the Calmar Ratio, in particular, showcasing an impressive figure, indicating strong risk-adjusted returns when compared to the maximum drawdown over a one-year period. This juxtaposition of risk metrics suggests that while the fund has faced volatility, with appropriate risk management practices, it has the potential to reward risk-taking investors.
The fifty-two week range shows a recent test of its high, which alongside a steadily climbing fifty and two hundred-day moving average, implies a consolidation at higher price levels. An incremental progression leads to an inference that the fund may potentially continue its ascendant trajectory over the next few months, should the market conditions and investor sentiment maintain the current course.
In the absence of financial statements, our assessment strongly relies on the presented technical and fundamental data. Based on these factors and the prevailing market sentiment captured through these indicators, the likely movement in the stock price of JEPQ over the ensuing months potentially gestures towards an upward trend, albeit with advisable caution due to the underlined risk-adjusted performance metrics.
The Analyst Expectations underscore a rugged framework, with low expense ratios and decent yield, solidifying JEPQ's position in the current financial terrain. With its inception still in its nascent stage and lacking a historical beta for market comparison, it is prudent to monitor its performance keenly as the market adjusts to the fund's characteristics. It's vital to note that market conditions are subject to change, influenced by diverse macroeconomic factors, and thus active monitoring and adjustment of the analytic models would be essential to refining predictions in real-time.
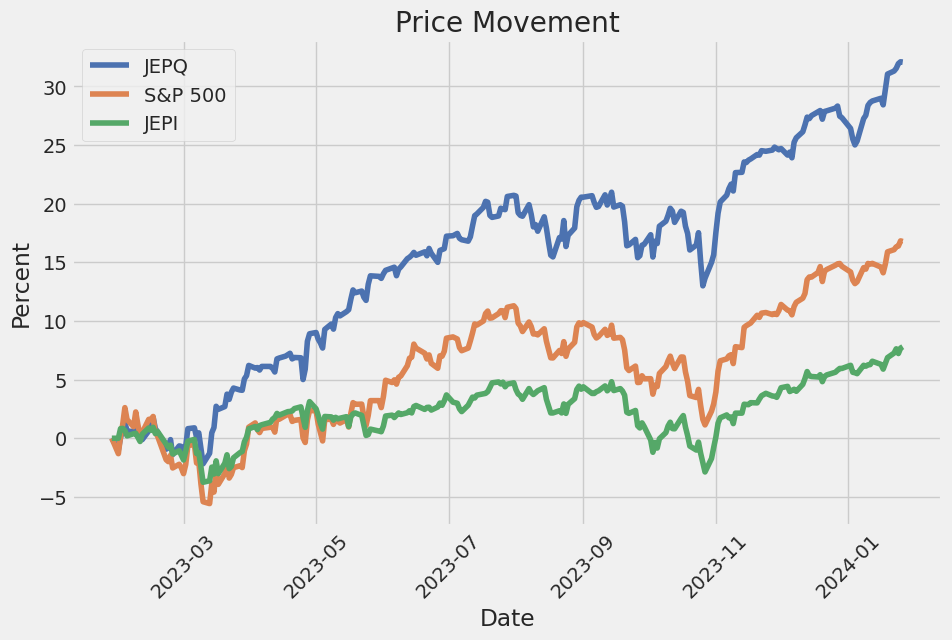
The linear regression analysis between JEPQ and SPY indicates a strong positive relationship, as evidenced by the high R-squared value of 0.879. This suggests that approximately 87.9% of the variability in JEPQ can be explained by movements in SPY, reflecting that JEPQ, to a large extent, follows the market trends represented by SPY. The coefficient for SPY is significant and positive, with a beta (slope) of approximately 0.8891, suggesting that for every one unit of change in SPY, JEPQ is expected to change by about 0.8891 units in the same direction. This shows that JEPQ is responsive to market movements, albeit not on a one-to-one basis, signifying less than proportional sensitivity to the market.
Focusing on the intercept term of the regression, also known as alpha, the model shows a value of approximately 0.0139. This alpha is statistically insignificant, with a p-value of 0.452, indicating that we cannot dismiss the null hypothesis that the true alpha is zero at standard confidence levels. A non-significant alpha implies that over the period in consideration, JEPQ does not systematically earn returns above or below what the market model would predict. Thus, after accounting for market movements, there is no evidence of persistent performance deviations by JEPQ from expected market returns based on its historical relationship with SPY.
| Statistic Name | Statistic Value |
| R-squared | 0.879 |
| Adj. R-squared | 0.879 |
| F-statistic | 3,140 |
| Prob (F-statistic) | < 0.001 |
| Log-Likelihood | -200.36 |
| AIC | 404.7 |
| BIC | 412.9 |
| coef (const) | 0.0139 |
| coef (SPY) | 0.8891 |
| std err (const) | 0.018 |
| std err (SPY) | 0.016 |
| t (const) | 0.752 |
| P>|t| (const) | 0.452 |
| [0.025 0.975] (const) | -0.022 0.050 |
The evolution of exchange-traded funds (ETFs) has seen innovative developments designed to suit various investor needs, including income generation and market volatility management. A prime example of this progression is the introduction of the JPMorgan Nasdaq Equity Premium Income ETF, a fund that employs options overlays to potentially enhance returns and provide a degree of protection against market fluctuations. In accordance with CNBC's "ETF Edge," these types of ETFs are projected to gain popularity as they bring a novel approach by coupling options strategies with traditional ETF investing.
Options overlays, succinctly, are strategies where investors can utilize options, such as covered calls, to generate income or protect against potential losses. This method adds a sophisticated layer to an ETF's operation, intending to squeeze additional yield or mitigate the downside of a volatile market landscape. Ben Slavin from BNY Mellon has underscored the increasing popularity of such products, likely due to the dual benefits they seem to offeradditional income in stable market situations and a safety net during downturns.
Taking this into account, it's evident that the market for ETFs is diversifying, with investors looking for varied tools to protect and grow their investments in a challenging economic environment. The JPMorgan Nasdaq Equity Premium Income ETF is at the forefront of these innovations, responding to investor demands for strategies that can adapt to changing market conditions while still aiming for consistent performance.
Examining the article from CNBC's "ETF Edge," aired on December 16, 2023, with a follow-up on January 24, 2024, provides us with a greater context for the discussion. This ETF offers a fresh perspective on how traditional index funds can be combined with options strategies to aim for higher yields, particularly important in a landscape that has become accustomed to low interest rates. To delve deeper into the discussions on options overlays and their potential impact, the original CNBC article can be accessed here.
Likewise, artificial intelligence (AI) has sparked intense interest, not just in the realm of technology but also within the investment community. As reported by Forbes on December 14, 2023, AI is driving investor sentiment and is anticipated to maintain its strong presence in the market throughout 2024. This enthusiasm is not unfounded, as companies leading in AI development are now major fixtures in investment portfolios, particularly those of income-focused investors.
For those investors aiming to gain from the tech sector's dividends and are intrigued by AI, the attraction of the JPMorgan Nasdaq Equity Premium Income ETF becomes more pronounced. This fund, under the ticker JEPQ, puts into practice a covered call strategy on the Nasdaq 100 index, holding considerable positions in technology behemoths like Microsoft and Alphabet (Google)both deeply entrenched in the AI sector. With a portfolio allocation of 8.7% to Microsoft and 5% to Google, the fund not only offers exposure to AI but does so while seeking to offer a decidedly generous yield.
It's instructive to note that these efforts are not just about capitalizing on the AI wave, but they provide a specific avenue for income-seekers to participate in the technological boom. More in-depth insights and strategies regarding AI and its effect on dividend yields can be explored through the Forbes Article.
An analysis of the JPMorgan Nasdaq Equity Premium Income ETF would be incomplete without exploring the present and prospective holdings that comprise its portfolio. These holdings are a direct reflection of the fund's strategy and targets:
| Company | Symbol | Percent |
|---|---|---|
| Microsoft Corp | MSFT | 7.48 |
| Apple Inc | AAPL | 7.16 |
| Amazon.com Inc | AMZN | 4.33 |
| Alphabet Inc Class C | GOOG | 4.29 |
| Meta Platforms Inc Class A | META | 3.46 |
| NVIDIA Corp | NVDA | 3.30 |
| Tesla Inc | TSLA | 2.90 |
| Name8 | Symbol8 | 0.00 |
| Name9 | Symbol9 | 0.00 |
| Name10 | Symbol10 | 0.00 |
Turning to more individual investor experiences within the income ETF landscape, the practical applications of these products are evidenced by Steven Fiorillo's narrative detailed in Seeking Alpha on January 25, 2024. He recounts the trajectory of his Dividend Harvesting Portfolio now entering week 151, noting notable progress alongside wider economic indicators. This close look at personal portfolio management reveals the real-world impact and investor confidence in dividends and income-focused products, which correlate with the broader theme of this report regarding yield-enhancing strategies, such as those utilized by the JPMorgan Nasdaq Equity Premium Income ETF.
The Dividend Harvesting Portfolio exemplifies a strategic distribution among equities, ETFs, and other income-generating investments. Notably, the JPMorgan Nasdaq Equity Premium Income ETF (JEPQ) features in Fiorillo's investment radar, providing a tangible example of how such ETFs play a role in individual strategies aiming for income and growth. As the market landscape alters and yields fluctuate, the role of strategic ETFs like JEPQ may only grow more pronounced in similar portfolios. For a closer examination of the portfolio's progression and Fiorillo's strategies, readers can reference the Seeking Alpha discussion at Dividend Harvesting Portfolio Week 151.
Although Fiorillo's approach and portfolio management offer a perspective on how an individual investor might navigate the ETF space, it is always essential for investors to do their due diligence or seek financial advice tailored to their specific circumstances. The narrative here does not constitute financial advice but rather serves as a testament to the strategies employed and the increasing role of options overlays within ETFs.
The volatility of the JPMorgan Nasdaq Equity Premium Income ETF (JEPQ) from May 4, 2022, to January 26, 2024, can be summarized in three points:
- The model used to estimate volatility, an ARCH model, indicates that there is very low predictability in the returns based on past values alone, as suggested by an R-squared value of 0.000.
- The data displays some level of volatility clustering with the ARCH effect being significant as seen from the alpha coefficient with a value of 0.4697, which means that past volatility is somewhat predictive of future volatility.
- The estimated constant term for volatility, omega, is 0.7694, which points to a baseline level of volatility that is present in the returns of the ETF.
Below is the HTML table with the details of the ARCH model statistics:
| Statistic Name | Statistic Value |
|---|---|
| R-squared | 0.000 |
| Adj. R-squared | 0.002 |
| Log-Likelihood | -643.733 |
| AIC | 1,291.47 |
| BIC | 1,299.61 |
| No. Observations | 434 |
| omega | 0.7694 |
| alpha[1] | 0.4697 |
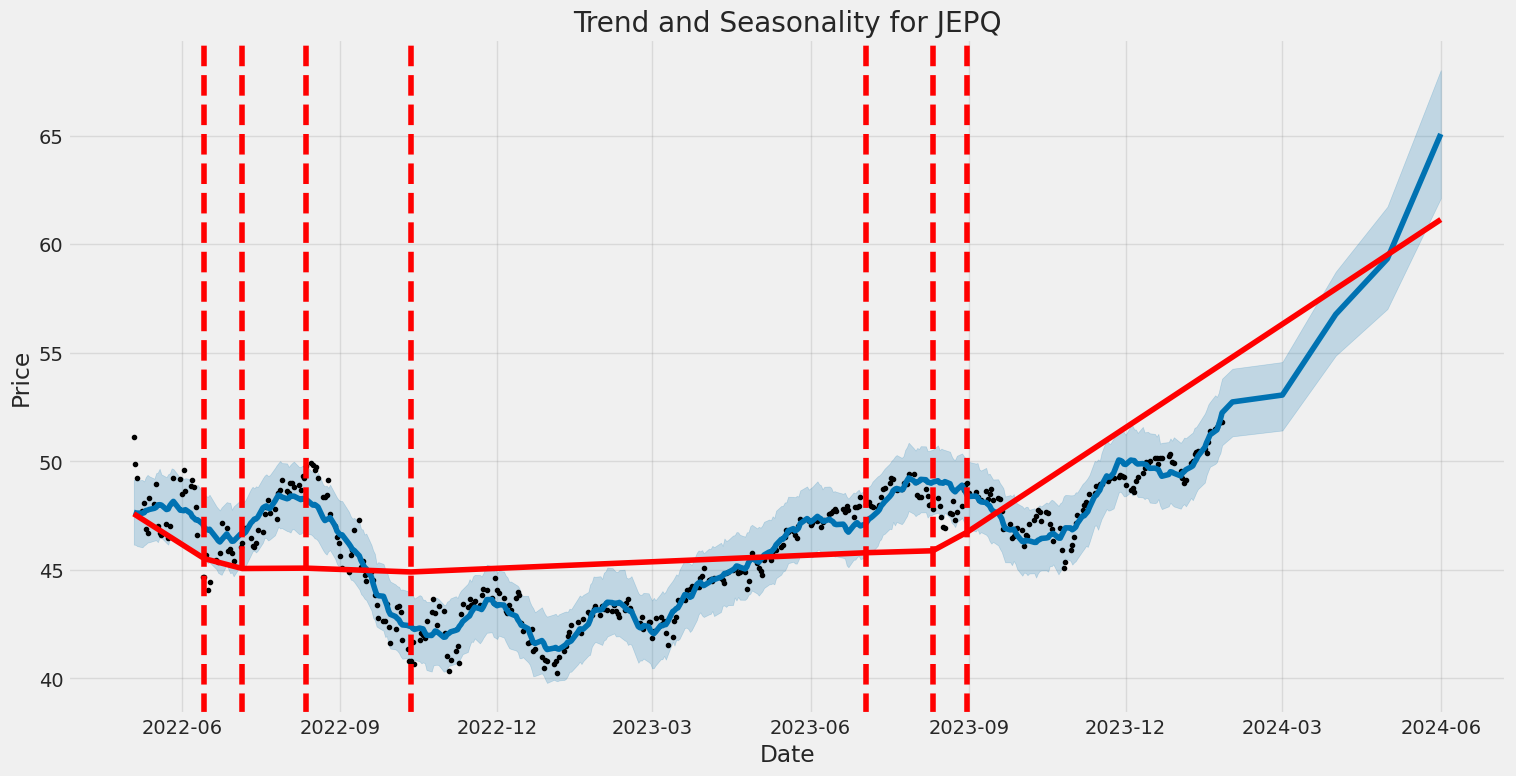
To commence, understanding the financial risk of investing in JPMorgan Nasdaq Equity Premium Income ETF (JEPQ) requires an analysis of historical price fluctuations, which furnish us with insights into future risks. Volatility modeling, with its roots in econometric techniques, becomes a critical tool in this assessment. Specifically, for JEPQ, a time-series model designed to capture and predict conditional variance in financial time series data can quantify the level of uncertainty or risk associated with its price movements over the forecasted one-year period.
By fitting this volatility model to the historical returns of JEPQ, the changing volatility over time is estimated. The model extracts long-term trends and short-term fluctuations in volatility, enabling us to project future volatility more accurately. This projection is essential for risk management purposes as it provides a measure of how much the value of the investment could potentially fluctate in a given time frame.
Moving forward, machine learning predictions play their role by drawing from a multitude of features, including historical returns and other relevant financial indicators, to forecast future returns of JEPQ. The ensemble technique, specifically using decision trees to average predictions and account for non-linear relationships, can handle the complexities of financial markets and capture patterns not easily discerned through traditional methods.
By applying this machine learning approach to predict future price movements, we have an additional layer of analysis that complements the volatility estimates. It incorporates more variables and potentially uncovers insights from the structure of the data that basic statistical models may miss.
Turning our attention to the results, the calculated Value at Risk (VaR) at a 95% confidence level stands as a keystone for this analysis. VaR offers a quantifiable assessment of the potential loss in value of the investment with a given level of confidence over a specified period. In this case, for a $10,000 investment in JEPQ, the annual VaR at a 95% confidence level has been computed to be $104.77. This suggests that, given normal market conditions, there's only a 5% chance that the investment will experience a loss exceeding $104.77 over the one-year period.
The employ of both volatility modeling and machine learning predictions elucidates the confluence of risk elements associated with the ETF. The volatility model underscores the ETF's intrinsic price instability, while the machine learning forecasts integrate a broader spectrum of influential factors. Together, these analytical frameworks offer an extensive viewpoint on the potential financial risks, particularly spotlighting the expected threshold of negative investment returns under assumed normal market conditions.
Similar Companies in None:
JPMorgan Equity Premium Income ETF (JEPI), Global X S&P 500 Covered Call ETF (XYLD), Amplify CWP Enhanced Dividend Income ETF (DIVO), Global X Russell 2000 Covered Call ETF (RYLD), Global X NASDAQ 100 Covered Call ETF (QYLD), Blackrock Inc. (BLK), Vanguard Group (N/A), State Street Corporation (STT), Invesco Ltd. (IVZ), Charles Schwab Corporation (SCHW), T. Rowe Price Group (TROW), Goldman Sachs Group, Inc. (GS)
https://seekingalpha.com/article/4657805-jepq-10-percent-yield-not-high-as-seems
https://www.forbes.com/sites/brettowens/2023/12/14/4-best-dividends-for-a-2024-ai-bubble/
https://seekingalpha.com/article/4658010-jepq-positioned-growth-income-2024-as-fed-has-spoken
https://www.cnbc.com/2023/12/16/this-etf-offering-could-become-next-years-hot-product.html
https://seekingalpha.com/article/4658551-jepq-why-i-sold-out-of-this-etf
https://seekingalpha.com/article/4660842-my-9-percent-income-portfolio-living-off-dividends
https://seekingalpha.com/article/4661802-5-impressive-high-yield-ideas-for-healthy-retirement
https://seekingalpha.com/article/4662929-jepq-more-underperformance-ahead
https://seekingalpha.com/article/4663820-jepq-great-etf-to-play-the-stock-market-in-2024
https://seekingalpha.com/article/4664539-jepq-2-key-reasons-to-avoid-this-etf-for-now
https://seekingalpha.com/article/4664583-a-look-at-the-boom-in-income-focused-nasdaq-etfs
Copyright © 2024 Tiny Computers (email@tinycomputers.io)
Report ID: uN21Yy
Cost: $0.21444
https://reports.tinycomputers.io/JEPQ/JEPQ-2024-01-27.html Home