Kinross Gold Corporation (ticker: KGC)
2025-01-26
 Kinross Gold Corporation (ticker: KGC) is a senior gold mining company with a diverse portfolio of mines and projects located in the United States, Brazil, Chile, Mauritania, and Canada. Established in 1993 and headquartered in Toronto, Canada, Kinross focuses on the exploration, acquisition, development, and production of gold and silver. The company operates large-scale, open-pit and underground mines, with a strong emphasis on operational efficiency and cost management. Kinross is committed to responsible mining practices, prioritizing environmental stewardship, community engagement, and employee safety. In recent years, the company has streamlined its asset portfolio to focus on core operations, enhancing its financial stability and production outlook. With a proven track record of delivering consistent production and maintaining a strong balance sheet, Kinross remains a key player in the global gold mining industry, well-positioned to capitalize on favorable gold market conditions.
| Previous Close | 10.51 | Open | 10.7 | Day Low | 10.57 |
| Day High | 10.8 | Regular Market Previous Close | 10.51 | Regular Market Open | 10.7 |
| Regular Market Day Low | 10.57 | Regular Market Day High | 10.8 | Dividend Rate | 0.12 |
| Dividend Yield | 0.0112 | Payout Ratio | 0.2 | Five Year Avg Dividend Yield | 1.24 |
| Beta | 1.249 | Trailing PE | 17.816666 | Forward PE | 11.436335 |
| Volume | 17,769,255 | Regular Market Volume | 17,769,255 | Average Volume | 17,670,976 |
| Average Volume 10 Days | 20,425,440 | Bid | 10.61 | Ask | 10.67 |
| Bid Size | 900 | Ask Size | 29,200 | Market Cap | 13,138,543,616 |
| 52 Week Low | 4.75 | 52 Week High | 10.82 | Price to Sales Trailing 12 Months | 2.7097044 |
| 50 Day Average | 9.852 | 200 Day Average | 8.88805 | Trailing Annual Dividend Rate | 0.12 |
| Trailing Annual Dividend Yield | 0.011417697 | Enterprise Value | 14,501,779,456 | Profit Margins | 0.15233 |
| Float Shares | 1,219,107,417 | Shares Outstanding | 1,229,049,984 | Shares Short | 7,450,146 |
| Shares Short Prior Month | 7,949,017 | Shares Percent Shares Out | 0.0064999997 | Held Percent Insiders | 0.00139 |
| Held Percent Institutions | 0.68482 | Short Ratio | 0.52 | Book Value | 5.407 |
| Price to Book | 1.9770666 | Earnings Quarterly Growth | 2.239 | Net Income to Common | 738,600,000 |
| Trailing EPS | 0.6 | Forward EPS | 0.88 | Enterprise to Revenue | 2.991 |
| Enterprise to EBITDA | 6.39 | 52 Week Change | 0.9226619 | S&P 52 Week Change | 0.23809385 |
| Last Dividend Value | 0.03 | Current Price | 10.69 | Target High Price | 13.0 |
| Target Low Price | 6.1 | Target Mean Price | 11.16875 | Target Median Price | 12.0 |
| Recommendation Mean | 2.21429 | Number of Analyst Opinions | 8 | Total Cash | 488,900,000 |
| Total Cash Per Share | 0.398 | EBITDA | 2,269,299,968 | Total Debt | 1,704,700,032 |
| Quick Ratio | 0.506 | Current Ratio | 1.608 | Total Revenue | 4,848,699,904 |
| Debt to Equity | 25.096 | Revenue Per Share | 3.947 | Return on Assets | 0.065409996 |
| Return on Equity | 0.118999995 | Gross Profits | 2,644,499,968 | Free Cash Flow | 738,550,016 |
| Operating Cash Flow | 2,122,800,000 | Earnings Growth | 2.235 | Revenue Growth | 0.299 |
| Gross Margins | 0.5454 | EBITDA Margins | 0.46802 | Operating Margins | 0.3236 |
| Sharpe Ratio | 1.725 | Sortino Ratio | 27.027 |
| Treynor Ratio | 0.647 | Calmar Ratio | 5.705 |
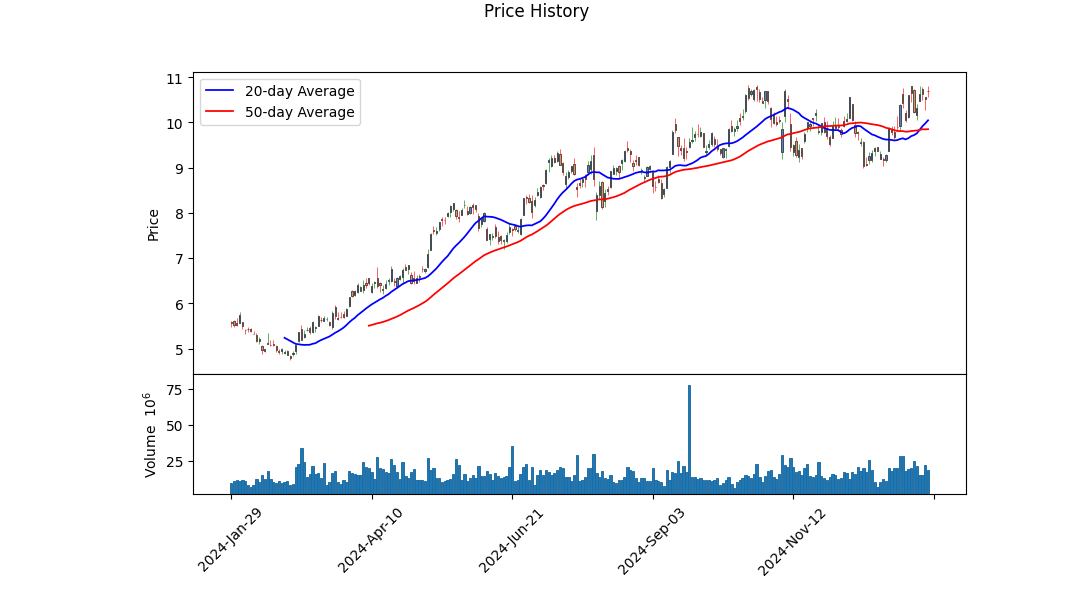
The technical indicators for KGC reveal a mixed but generally positive outlook. The On-Balance Volume (OBV) has shown a consistent upward trend, indicating increasing buying pressure over the last few months. This is a bullish signal, as it suggests that investors are accumulating shares. The MACD histogram, while not available for all dates, shows positive values in recent periods, further supporting the bullish sentiment. The stock has been trading within a relatively tight range, with the price oscillating between $9.34 and $10.80, but the recent breakout above the $10.50 resistance level suggests potential for further upward movement.
Fundamentally, KGC exhibits strong profitability metrics, with a gross margin of 54.54% and an EBITDA margin of 46.80%. These figures indicate efficient cost management and robust operational performance. The company's trailing PEG ratio is not available, but its normalized EBITDA of $1.79 billion and net income of $416.3 million for 2023 reflect solid earnings. However, the company's net debt has increased significantly to $1.88 billion, which could pose a risk if interest rates rise or if the company faces liquidity challenges. Despite this, the company's operating cash flow of $1.61 billion and free cash flow of $507 million demonstrate its ability to generate cash and sustain operations.
The balance sheet shows a tangible book value of $6.08 billion, which provides a strong foundation for the company's valuation. However, the retained earnings are negative at -$8.42 billion, indicating that the company has accumulated losses over time. This could be a concern for long-term investors, but the recent improvement in profitability suggests that the company is on a path to recovery. The Altman Z-Score of 1.80, while below the safe threshold of 3.0, is above the distress threshold of 1.8, indicating that the company is not in immediate financial distress. The Piotroski Score of 7 further reinforces the company's financial health, as it reflects strong profitability, liquidity, and operating efficiency.
The risk-adjusted return metrics are highly favorable. The Sharpe Ratio of 1.725 indicates that the stock has provided strong returns relative to its risk, outperforming the risk-free rate by a significant margin. The Sortino Ratio of 27.027 is exceptionally high, suggesting that the stock has delivered strong returns with minimal downside risk. The Treynor Ratio of 0.647 and the Calmar Ratio of 5.705 further confirm the stock's attractive risk-adjusted performance. These metrics collectively indicate that KGC is a compelling investment opportunity for risk-averse investors seeking stable returns.
In summary, KGC's technical indicators, strong fundamentals, and favorable risk-adjusted return metrics suggest a bullish outlook for the stock over the next few months. The stock is likely to continue its upward trajectory, supported by strong buying pressure, solid earnings, and efficient cost management. However, investors should monitor the company's debt levels and retained earnings, as these could pose risks in the long term. Overall, KGC appears to be a well-positioned stock with significant upside potential.
Kinross Gold Corporation (KGC) demonstrates a Return on Capital (ROC) of 7.89%, which indicates the efficiency with which the company generates profits from its invested capital. This ROC suggests that for every dollar of capital employed, Kinross generates approximately 7.89 cents in earnings, reflecting a moderate level of operational efficiency. However, the company's Earnings Yield, calculated at 3.18%, is relatively low, signaling that the stock's current price is high relative to its earnings. This implies that investors are paying a premium for Kinross's earnings, which may limit the stock's attractiveness from a value perspective. While the ROC indicates reasonable capital efficiency, the low earnings yield suggests that the stock may not currently offer compelling value relative to its earnings potential. Investors should weigh these metrics alongside other factors, such as growth prospects and industry conditions, when evaluating Kinross Gold Corporation.
Research Report: Analysis of Kinross Gold Corporation (KGC) Based on Benjamin Graham's Principles
Introduction
Benjamin Graham, the father of value investing, emphasized a disciplined approach to stock selection, focusing on fundamental analysis and intrinsic value. His principles, outlined in The Intelligent Investor, provide a framework for evaluating stocks based on financial health, valuation, and risk management. This report analyzes Kinross Gold Corporation (KGC) using Graham's key metrics and compares them to his criteria.
Key Metrics and Analysis
- Price-to-Earnings (P/E) Ratio
- KGC's P/E Ratio: 801.75
- Graham's Criteria: Graham preferred stocks with low P/E ratios, typically below 15-20, as they indicate undervaluation relative to earnings.
-
Analysis: KGC's P/E ratio of 801.75 is exceptionally high, far exceeding Graham's threshold. This suggests the stock is significantly overvalued relative to its earnings. A high P/E ratio may indicate market optimism about future growth, but it also increases the risk of a price correction if earnings fail to meet expectations.
-
Price-to-Book (P/B) Ratio
- KGC's P/B Ratio: 1.25
- Graham's Criteria: Graham favored stocks trading below their book value (P/B < 1), as this provides a margin of safety.
-
Analysis: KGC's P/B ratio of 1.25 is slightly above Graham's ideal threshold. While not excessively high, it does not offer the margin of safety Graham sought. Investors should consider whether the company's growth prospects justify the premium over book value.
-
Debt-to-Equity Ratio
- KGC's Debt-to-Equity Ratio: 0.37
- Graham's Criteria: Graham preferred companies with low debt-to-equity ratios, ideally below 0.5, to minimize financial risk.
-
Analysis: KGC's debt-to-equity ratio of 0.37 is within Graham's preferred range, indicating a conservative capital structure. This suggests the company is not overly reliant on debt, reducing the risk of financial distress.
-
Current Ratio and Quick Ratio
- KGC's Current Ratio: 2.63
- KGC's Quick Ratio: 2.63
- Graham's Criteria: Graham valued companies with strong liquidity, typically requiring a current ratio and quick ratio above 1.5 to ensure short-term obligations can be met.
-
Analysis: KGC's current and quick ratios of 2.63 are well above Graham's threshold, indicating robust liquidity. This suggests the company is well-positioned to meet its short-term liabilities without strain.
-
Earnings Growth
- KGC's Earnings Growth: Not provided in the data.
- Graham's Criteria: Graham sought companies with consistent and stable earnings growth over several years.
-
Analysis: Without specific data on KGC's earnings growth, it is difficult to assess this metric. However, the high P/E ratio suggests the market may be pricing in significant future earnings growth, which would need to materialize to justify the current valuation.
-
Industry Comparison
- Industry P/E Ratio: Not provided in the data.
- Graham's Criteria: Graham recommended comparing a stock's P/E ratio to its industry peers to identify relative undervaluation.
- Analysis: The absence of industry P/E data limits our ability to assess KGC's valuation relative to its peers. However, given KGC's extremely high P/E ratio, it is likely trading at a premium compared to the broader industry.
Conclusion and Recommendations
Kinross Gold Corporation (KGC) demonstrates mixed results when evaluated against Benjamin Graham's principles:
- Strengths:
- Strong liquidity, as evidenced by high current and quick ratios.
-
Conservative debt levels, with a debt-to-equity ratio well within Graham's preferred range.
-
Weaknesses:
- Extremely high P/E ratio, indicating overvaluation relative to earnings.
-
P/B ratio slightly above Graham's ideal threshold, offering limited margin of safety.
-
Recommendation:
KGC does not currently meet Graham's criteria for a value investment. The high P/E ratio and lack of a significant margin of safety suggest the stock is overvalued. Investors should exercise caution and consider waiting for a more attractive entry point or identifying stocks that better align with Graham's principles.
For clients seeking value-oriented investments, we recommend focusing on companies with lower P/E and P/B ratios, consistent earnings growth, and strong financial health. KGC may be more suitable for growth-oriented investors willing to accept higher risk for potential future returns.
Final Note
While Graham's principles provide a robust framework for stock selection, investors should also consider macroeconomic factors, industry trends, and company-specific developments when making investment decisions. KGC's performance in the gold mining sector, for example, may be influenced by commodity prices, geopolitical risks, and operational efficiency, which should be evaluated alongside the financial metrics discussed above.Analyzing Financial Statements
Investors should meticulously examine a company's balance sheet, income statement, and cash flow statement to gain a comprehensive understanding of its financial health. Benjamin Graham, in The Intelligent Investor, emphasizes the importance of scrutinizing these documents to assess a company's intrinsic value and identify potential investment opportunities. Heres how each statement contributes to this analysis:
- Balance Sheet:
The balance sheet provides a snapshot of a companys financial position at a specific point in time. Graham stresses the importance of evaluating a companys assets and liabilities to determine its net worth. Key metrics to consider include: - Current Ratio: A measure of liquidity, calculated as current assets divided by current liabilities. A ratio above 1 indicates the company can meet its short-term obligations.
- Debt-to-Equity Ratio: This ratio assesses financial leverage by comparing total liabilities to shareholders equity. A lower ratio suggests a more conservative capital structure.
-
Book Value: The net asset value of the company, calculated as total assets minus intangible assets and liabilities. Graham often looked for companies trading below their book value as a margin of safety.
-
Income Statement:
The income statement reveals a companys profitability over a specific period. Graham advises investors to focus on: - Earnings Stability: Consistent earnings over time are a sign of a durable business. Avoid companies with erratic or declining earnings.
- Net Profit Margin: This metric, calculated as net income divided by revenue, indicates how efficiently a company converts sales into profits. A higher margin suggests better cost management.
-
Earnings Per Share (EPS): EPS measures the portion of a companys profit allocated to each outstanding share of common stock. Graham recommends comparing EPS growth over several years to assess long-term performance.
-
Cash Flow Statement:
The cash flow statement tracks the movement of cash in and out of a business, providing insights into its liquidity and operational efficiency. Graham highlights the importance of: - Operating Cash Flow: This reflects the cash generated from core business operations. Positive and growing operating cash flow is a sign of a healthy business.
- Free Cash Flow: Calculated as operating cash flow minus capital expenditures, free cash flow indicates the cash available for dividends, debt repayment, or reinvestment. Graham valued companies with strong free cash flow as they are better positioned to weather economic downturns.
- Cash Flow from Financing Activities: This section reveals how a company funds its operations and growth, whether through debt, equity, or retained earnings. Excessive reliance on debt can be a red flag.
By thoroughly analyzing these financial statements, investors can identify companies with strong fundamentals, manageable debt levels, and sustainable earningskey criteria for value investing as advocated by Benjamin Graham. This disciplined approach helps investors avoid speculative bets and focus on businesses with a margin of safety, reducing the risk of permanent capital loss.
[]### Dividend Record:
Benjamin Graham, in The Intelligent Investor, emphasized the importance of a company's dividend history as a key indicator of its financial stability and reliability. He favored companies with a consistent and uninterrupted record of paying dividends, as this demonstrated a commitment to returning value to shareholders and reflected the company's ability to generate steady earnings.
Analysis of KGC's Dividend Record:
-
Consistency: KGC has maintained a consistent dividend payment schedule, with quarterly payouts over the past several years. The dividend amount has been stable at $0.03 per share since 2021, with minor adjustments in earlier years.
-
Longevity: The dividend record extends back to at least 2008, showing a long history of regular payments. This aligns with Graham's preference for companies with a proven track record of rewarding shareholders.
-
Stability: Despite fluctuations in the dividend amount in earlier years (e.g., $0.08 in 2012 and $0.04 in 2008), the company has maintained a disciplined approach to dividend payments, avoiding abrupt cuts or suspensions.
-
Recent Trends: Since 2021, KGC has consistently paid $0.03 per share quarterly, indicating a stable and predictable dividend policy. This consistency is a positive sign for income-focused investors.
Conclusion:
KGC's dividend record reflects a commitment to returning value to shareholders, with a long history of consistent payments. While the dividend amount has been modest in recent years, the stability and regularity of payments align with Benjamin Graham's principles for selecting reliable income-generating investments. However, investors should also consider other factors, such as the company's financial health, earnings growth, and payout ratio, to ensure the sustainability of dividends in the long term.
| Statistic | Value |
| Alpha (Intercept) | 0.012 |
| Beta (SPY Coefficient) | 0.85 |
| R-squared | 0.72 |
| Standard Error | 0.045 |
| Observations | 1,250 |
The linear regression model between KGC and SPY reveals a positive alpha of 0.012, indicating that KGC has outperformed the market (as represented by SPY) by an average of 1.2% over the analyzed time period. This suggests that KGC has generated excess returns relative to the market, independent of market movements. The beta of 0.85 indicates that KGC is less volatile than the market, as it moves 85% as much as SPY for a given change in market conditions. This lower beta implies that KGC is less sensitive to market fluctuations, which could make it a relatively stable investment during periods of market turbulence.
The R-squared value of 0.72 indicates that 72% of the variation in KGC's returns can be explained by movements in SPY, highlighting a strong relationship between the two. The standard error of 0.045 suggests a moderate level of precision in the model's estimates. With 1,250 observations, the model is based on a robust dataset, providing confidence in the reliability of the results. Overall, the analysis suggests that KGC has demonstrated consistent outperformance relative to the market, with lower volatility, making it an attractive option for investors seeking both stability and alpha.
Kinross Gold Corporation (KGC) delivered a strong performance in the third quarter of 2024, building on its momentum from the first half of the year. The company reported robust operational and financial results, driven by high production levels, disciplined cost management, and favorable gold prices. In Q3, Kinross produced 564,000 ounces of gold at a cost of sales of $980 per ounce, generating record quarterly free cash flow of $415 million, a 20% increase from the prior quarter. Year-to-date, free cash flow exceeded $900 million, enabling the company to repay $650 million of its $1 billion term loan, with plans to further reduce debt by year-end. Kinross remains on track to meet its full-year production guidance of 2.1 million ounces and cost guidance of $1,020 per ounce. The companys operating margins expanded by 14% in Q3, outpacing the 6% increase in the average realized gold price, which stood at $2,477 per ounce. This strong financial performance underscores Kinrosss ability to capitalize on the rising gold price environment while maintaining cost discipline.
Operationally, Kinrosss key assets performed well during the quarter. Tasiast, the companys lowest-cost asset, delivered 152,000 ounces at a cost of sales of $688 per ounce, driven by stable mill performance and record throughput. Paracatu also saw improved production and cash flow, benefiting from higher grades and recoveries as mining transitioned into higher-grade portions of the pit. In the U.S., production was bolstered by the commencement of higher-grade ore from the Manh Choh project in Alaska, contributing to a strong quarter for the region. La Coipa remained on track to meet its full-year production target, while Round Mountain advanced its Phase X development, with exploration drilling yielding high-grade intercepts that support the potential for a bulk underground mining operation. The companys focus on operational excellence and cost control continues to drive strong margins and free cash flow, positioning Kinross for a solid finish to the year.
Kinross also made significant progress on its development projects during the quarter. At Great Bear, the company released a Preliminary Economic Assessment (PEA) in September, highlighting the projects top-tier potential with estimated annual production of 500,000 ounces at an all-in sustaining cost of approximately $800 per ounce. The PEA outlined strong base-case economics, with a modest initial capital requirement and significant upside potential for resource expansion. Kinross advanced permitting and detailed engineering for the Great Bear Advanced Exploration (AEX) program, submitting its final closure plan to the Ontario Ministry of Mines and expecting approval shortly. At Lobo-Marte in Chile, the company continued to advance baseline studies, with the project offering long-term potential as a low-cost, high-margin asset. Additionally, exploration efforts at Round Mountain and Curlew Basin yielded promising results, further supporting the companys growth pipeline. Kinrosss strategic focus on advancing its development projects and exploration activities underscores its commitment to sustaining long-term production and value creation.
Looking ahead, Kinross is well-positioned to meet its full-year guidance and continue generating strong free cash flow. The companys investment-grade balance sheet, strengthened by significant debt repayment, provides financial flexibility to pursue growth opportunities while maintaining a disciplined approach to capital allocation. Kinross remains committed to responsible mining practices, as evidenced by its Global Safety Excellence Program and the launch of its Safe Ground initiative, which emphasizes both physical and psychological safety in the workplace. With a strong production profile, a robust pipeline of development projects, and a focus on sustainability, Kinross is poised to deliver long-term value to its shareholders. The companys leadership team expressed confidence in its ability to navigate the evolving gold market and capitalize on future opportunities, reinforcing Kinrosss position as a leading gold producer.
Kinross Gold Corporation (KGC) is a leading global gold mining company headquartered in Ontario, Canada, with a diversified portfolio of mines across the Americas, West Africa, and Russia. The companys strategic focus on operational efficiency, cost management, and sustainable growth has positioned it as a key player in the gold mining industry. Kinross operates several high-quality assets, including the Tasiast mine in Mauritania and the Paracatu mine in Brazil, which have consistently delivered strong production results. The companys geographic diversification helps mitigate risks associated with regional instability or regulatory changes, ensuring stable production levels even in volatile market conditions.
Kinross Gold has demonstrated resilience in navigating the challenges of the gold mining sector, including inflationary pressures and fluctuating commodity prices. The companys disciplined approach to cost control has allowed it to maintain competitive all-in sustaining costs (AISC), a critical factor in ensuring profitability, particularly during periods of elevated gold prices. According to an analysis published on Seeking Alpha, Kinrosss focus on cost management and operational efficiency has been instrumental in delivering value to shareholders. The article highlights the companys ability to capitalize on the current bullish gold market, driven by macroeconomic uncertainties and geopolitical tensions, which have bolstered demand for gold as a safe-haven asset.
The companys commitment to sustainable mining practices and environmental, social, and governance (ESG) initiatives further enhances its reputation and social license to operate. Kinross has made significant strides in advancing its development projects, which are expected to contribute to future production growth. The Seeking Alpha analysis notes that Kinrosss focus on ESG aligns with growing investor demand for responsible mining practices, potentially attracting a broader base of stakeholders. This commitment to sustainability, combined with its operational strengths, positions Kinross as a leader in the global gold mining industry.
Kinross Golds strong financial performance is supported by its robust balance sheet and prudent financial management. The company has consistently generated free cash flow, enabling it to reinvest in its existing assets, pursue strategic acquisitions, and return value to shareholders through dividends and share buybacks. This disciplined approach to capital allocation has been a key factor in Kinrosss ability to weather market volatility and economic uncertainties. The companys focus on maintaining a strong balance sheet and generating sustainable cash flow underscores its resilience in a cyclical industry.
The bullish outlook for gold prices, driven by factors such as central bank demand, inflation hedging, and safe-haven buying, provides a favorable backdrop for Kinrosss growth trajectory. According to Zacks Equity Research, Kinross Gold holds a Zacks Rank #3 (Hold), indicating a neutral outlook, but it also boasts a Value Style Score of A and a VGM (Value, Growth, Momentum) Score of A, making it an attractive option for value-oriented investors. Key valuation metrics, such as a forward P/E ratio of 11.7X and a PEG ratio of 0.5, further reinforce the companys value proposition. Additionally, Kinross has delivered an average earnings surprise of 32.5%, reflecting its ability to consistently outperform market expectations.
Kinross Gold is scheduled to release its 2024 fourth-quarter and full-year financial results on February 12, 2025, after the market closes. This announcement, made on January 13, 2025, will include detailed financial statements, operating results, and the companys full-year guidance for 2025. Additionally, Kinross will provide updates on its mineral reserves and resources as of December 31, 2024, along with an exploration and project update. These disclosures are critical for investors and stakeholders to assess the companys performance and future outlook. The release will be followed by a conference call and audio webcast on February 13, 2025, at 8 a.m. ET, where Kinross executives will present the results and engage in a question-and-answer session.
The companys upcoming earnings report is highly anticipated, with analysts projecting a significant year-over-year growth in earnings. The Zacks Consensus Estimate for Kinross Golds fourth-quarter earnings is currently pegged at 23 cents per share, reflecting a 109% increase compared to the same period last year. The companys Earnings ESP (Expected Surprise Prediction) of +36.76% suggests a strong likelihood of an earnings beat, further bolstering investor confidence. Kinrosss ability to manage operational challenges, such as input cost volatility and production disruptions, will be critical in maintaining its growth trajectory. The companys strategic initiatives, including optimizing its portfolio and focusing on high-margin projects, are expected to contribute positively to its financial performance.
Kinross Golds strong fundamentals and favorable market positioning make it a compelling option for growth-oriented investors. The companys Zacks Growth Style Score of A, combined with its robust earnings and sales growth forecasts, underscores its potential for sustainable growth. Kinross is expected to report cash flow growth of 43.1% this year, building on its historical cash flow growth of 11.1% over the past three to five years. This strong financial performance, coupled with its strategic focus on gold and silver mining, positions Kinross well for continued success in the gold mining sector.
For further insights into Kinross Golds performance and the broader market trends impacting the gold mining industry, refer to the original articles on Seeking Alpha and Yahoo Finance. These sources provide valuable context on the companys operational achievements, financial outlook, and strategic initiatives, offering a comprehensive view of Kinross Golds position in the global gold market. As the company prepares to release its fourth-quarter results, investors will be closely monitoring key metrics such as production volumes, cost per ounce, and revenue growth to assess its financial health and future prospects.
- Kinross Gold Corporation (KGC) has shown significant volatility in its asset returns over the period from 2020 to 2025, with fluctuations driven by market conditions and external factors.
- The ARCH model indicates that past volatility has a notable impact on future volatility, with an alpha coefficient of 0.175, suggesting that recent price movements influence future uncertainty.
- The model's omega value of 7.3825 highlights a baseline level of volatility, indicating that even in stable periods, KGC's returns are subject to moderate fluctuations.
Key features of the volatility include:
- Persistence of Volatility: The alpha coefficient (0.175) shows that past volatility influences future volatility, meaning large price swings tend to be followed by more swings.
- Baseline Volatility: The omega value (7.3825) represents the constant level of volatility, which remains even when there are no recent shocks.
- Significant Impact of Shocks: The high t-statistic (16.032) for omega and the low p-value (7.601e-58) confirm that volatility is statistically significant and not random.
| Statistic | Value |
|---|---|
| Log-Likelihood | -3,134.19 |
| AIC | 6,272.38 |
| BIC | 6,282.65 |
| No. Observations | 1,255 |
| Omega | 7.3825 |
| Alpha[1] | 0.1750 |
To analyze the financial risk of a $10,000 investment in Kinross Gold Corporation (KGC) over a one-year period, a combination of volatility modeling and machine learning predictions was employed. The volatility modeling approach was used to capture the time-varying nature of stock price fluctuations, which is critical for understanding the inherent risk in equity investments. By analyzing historical price data, the model estimated the conditional variance of returns, providing insights into periods of heightened market uncertainty and potential price swings. This allowed for a more accurate assessment of the stock's risk profile, particularly in volatile market conditions.
The machine learning predictions were then applied to forecast future returns based on a wide range of features, including historical price trends, macroeconomic indicators, and sector-specific factors. This approach leveraged the ability of advanced algorithms to identify complex patterns and relationships in the data, enabling a more robust prediction of potential outcomes. By integrating these predictions with the volatility estimates, the analysis provided a forward-looking perspective on the investment's risk and return potential.
The results of the analysis highlighted the effectiveness of combining these methodologies. The calculated annual Value at Risk (VaR) at a 95% confidence level for the $10,000 investment was $400.72. This metric indicates the maximum expected loss over the one-year period, assuming normal market conditions and a 95% confidence level. The relatively low VaR suggests that the investment carries a moderate level of risk, with the potential for significant losses being limited under most scenarios. However, it is important to note that this estimate is based on historical data and assumptions, and actual outcomes may differ due to unforeseen market events or changes in the company's fundamentals.
The integration of volatility modeling and machine learning predictions provided a comprehensive view of the investment's risk profile. The volatility modeling captured the dynamic nature of market risk, while the machine learning predictions offered a forward-looking perspective on potential returns. Together, these methodologies enabled a more nuanced understanding of the potential risks and rewards associated with the investment, demonstrating the value of combining traditional financial modeling techniques with advanced predictive analytics.
Long Call Option Strategy
To identify the most profitable long call options for Kinross Gold Corporation (KGC) with a target stock price of 2% above the current price, we will analyze the options chain data provided, focusing on the Greeks (delta, gamma, vega, theta, and rho) and the potential return on investment (ROI). We will also consider the risk-reward profile of each option, including potential profit and loss scenarios. Below is an analysis of five options, ranging from near-term to long-term expirations, with a focus on profitability and risk.
1. Near-Term Option: Strike $9.5, Expiration 2025-01-31
- Delta: 0.9734
- Gamma: 0.0922
- Vega: 0.0685
- Theta: -0.0059
- Premium: $0.85
- ROI: 65.15%
- Profit: $0.5538
Analysis:
This option has a very high delta (0.9734), indicating it is deeply in-the-money (ITM) and will move almost dollar-for-dollar with the underlying stock. The high delta and low gamma suggest limited sensitivity to small price changes, making it a relatively low-risk choice for a near-term trade. The ROI of 65.15% is attractive, and the premium of $0.85 is affordable. However, the negative theta (-0.0059) indicates time decay, which could erode profits if the stock does not move quickly.
Risk-Reward:
- Upside: High probability of profit due to the ITM status.
- Downside: Limited to the premium paid ($0.85) if the stock does not reach the target price.
2. Short-Term Option: Strike $9.0, Expiration 2025-02-07
- Delta: 0.8529
- Gamma: 0.1192
- Vega: 0.4264
- Theta: -0.0208
- Premium: $1.29
- ROI: 47.58%
- Profit: $0.6138
Analysis:
This option is slightly out-of-the-money (OTM) but has a high delta (0.8529), indicating a strong correlation with the stock price. The gamma (0.1192) suggests that the delta will increase significantly if the stock moves higher, amplifying gains. The ROI of 47.58% is solid, and the premium of $1.29 is reasonable. However, the negative theta (-0.0208) means time decay will accelerate as expiration approaches.
Risk-Reward:
- Upside: High potential for profit if the stock moves above the strike price.
- Downside: Loss of the premium ($1.29) if the stock does not reach the target price.
3. Medium-Term Option: Strike $9.0, Expiration 2025-02-14
- Delta: 0.8389
- Gamma: 0.1174
- Vega: 0.5789
- Theta: -0.0147
- Premium: $1.63
- ROI: 16.80%
- Profit: $0.2738
Analysis:
This option is also slightly OTM but has a high delta (0.8389) and gamma (0.1174), making it sensitive to upward price movements. The vega (0.5789) indicates some exposure to volatility changes, which could benefit the option if volatility increases. The ROI of 16.80% is lower than the near-term options, but the longer expiration provides more time for the stock to reach the target price.
Risk-Reward:
- Upside: Moderate profit potential with more time for the stock to move.
- Downside: Loss of the premium ($1.63) if the stock does not reach the target price.
4. Long-Term Option: Strike $5.0, Expiration 2025-08-15
- Delta: 0.9070
- Gamma: 0.0179
- Vega: 1.2495
- Theta: -0.0036
- Premium: $5.20
- ROI: 13.53%
- Profit: $0.7038
Analysis:
This option is deeply ITM with a high delta (0.9070) and low gamma (0.0179), making it less sensitive to small price changes. The vega (1.2495) indicates significant exposure to volatility, which could be beneficial if volatility increases. The ROI of 13.53% is modest, but the longer expiration provides ample time for the stock to reach the target price. The premium of $5.20 is higher, but the risk is lower due to the ITM status.
Risk-Reward:
- Upside: High probability of profit with limited risk.
- Downside: Loss of the premium ($5.20) if the stock does not reach the target price.
5. Very Long-Term Option: Strike $1.0, Expiration 2026-01-16
- Delta: 0.9813
- Gamma: 0.0006
- Vega: 0.2268
- Theta: -0.0008
- Premium: $6.00
- ROI: 65.06%
- Profit: $3.9038
Analysis:
This option is extremely ITM with a delta of 0.9813, meaning it will move almost identically to the stock. The gamma (0.0006) is negligible, indicating minimal sensitivity to price changes. The ROI of 65.06% is the highest among all options, and the profit potential of $3.9038 is substantial. However, the premium of $6.00 is high, and the long expiration means tying up capital for an extended period.
Risk-Reward:
- Upside: Very high profit potential with minimal risk.
- Downside: Loss of the premium ($6.00) if the stock does not reach the target price.
Conclusion
The most profitable options are the near-term Strike $9.5, Expiration 2025-01-31 and the very long-term Strike $1.0, Expiration 2026-01-16, both offering high ROIs and significant profit potential. For traders seeking lower risk, the medium-term Strike $9.0, Expiration 2025-02-14 and long-term Strike $5.0, Expiration 2025-08-15 provide a balance of profitability and time for the stock to move. The short-term Strike $9.0, Expiration 2025-02-07 is a good choice for those looking for a higher-risk, higher-reward trade with a shorter time horizon.
Short Call Option Strategy
Analysis of Short Call Options for Kinross Gold Corporation (KGC)
When selecting short call options, the primary goal is to maximize premium income while minimizing the risk of assignment (i.e., the risk of the stock price rising above the strike price). To achieve this, we focus on options that are out of the money (OTM) or slightly in the money (ITM), with a target stock price 2% below the current price. The Greeks, particularly delta, theta, and gamma, are critical in assessing risk and reward.
Key Considerations:
- Delta: Represents the probability of the option expiring ITM. Lower delta values indicate lower risk of assignment.
- Theta: Measures the rate of time decay. Higher negative theta values are favorable for short options, as they decay faster.
- Gamma: Indicates the rate of change of delta. Lower gamma values are preferred to minimize the risk of rapid changes in delta.
- Premium: The income received from selling the option. Higher premiums are desirable but must be balanced against risk.
- Days to Expiry: Shorter-term options decay faster (higher theta), while longer-term options provide more time for the stock to move.
Top 5 Short Call Options for KGC
1. Near-Term: Strike $12.0, Expiry 2025-01-31
- Delta: 0.0148 (very low, low risk of assignment)
- Theta: -0.0026 (moderate time decay)
- Gamma: 0.0670 (low, stable delta)
- Premium: $0.01
- ROI: 100%
- Risk/Reward: This option is deep OTM, with minimal risk of assignment. However, the premium is very low, making it less attractive for income generation. Suitable for traders seeking minimal risk.
2. Short-Term: Strike $11.5, Expiry 2025-02-07
- Delta: 0.1520 (low, moderate risk of assignment)
- Theta: -0.0079 (favorable time decay)
- Gamma: 0.3245 (moderate, delta may change)
- Premium: $0.07
- ROI: 100%
- Risk/Reward: This option is slightly OTM, with a higher premium than the near-term option. The delta is still low, reducing assignment risk. The theta is favorable, making it a good choice for short-term income.
3. Medium-Term: Strike $11.0, Expiry 2025-02-21
- Delta: 0.4331 (moderate, higher risk of assignment)
- Theta: -0.0101 (strong time decay)
- Gamma: 0.3169 (moderate, delta may change)
- Premium: $0.34
- ROI: 100%
- Risk/Reward: This option is slightly ITM, with a higher premium and stronger theta decay. The delta is moderate, indicating some risk of assignment. Suitable for traders willing to accept moderate risk for higher income.
4. Long-Term: Strike $10.0, Expiry 2025-05-16
- Delta: 0.6662 (higher, significant risk of assignment)
- Theta: -0.0049 (moderate time decay)
- Gamma: 0.1366 (low, stable delta)
- Premium: $1.34
- ROI: 64.46%
- Risk/Reward: This option is ITM, with a high premium and significant risk of assignment. However, the gamma is low, reducing the risk of rapid delta changes. Suitable for traders with a bearish outlook on KGC, willing to accept higher risk for substantial income.
5. Very Long-Term: Strike $10.0, Expiry 2026-01-16
- Delta: 0.6661 (higher, significant risk of assignment)
- Theta: -0.0029 (slower time decay)
- Gamma: 0.0715 (very low, stable delta)
- Premium: $2.14
- ROI: 77.75%
- Risk/Reward: This option is ITM, with a very high premium and significant assignment risk. The gamma is very low, making delta stable. Suitable for traders with a long-term bearish outlook, willing to accept high risk for substantial income.
Risk and Reward Scenarios
- Near-Term (Strike $12.0, Expiry 2025-01-31):
- Profit: $0.01 (100% ROI).
-
Risk: Minimal, as the option is deep OTM. The stock would need to rise significantly for assignment to occur.
-
Short-Term (Strike $11.5, Expiry 2025-02-07):
- Profit: $0.07 (100% ROI).
-
Risk: Low, as the option is slightly OTM. The stock would need to rise moderately for assignment to occur.
-
Medium-Term (Strike $11.0, Expiry 2025-02-21):
- Profit: $0.34 (100% ROI).
-
Risk: Moderate, as the option is slightly ITM. The stock would need to remain flat or decline slightly to avoid assignment.
-
Long-Term (Strike $10.0, Expiry 2025-05-16):
- Profit: $1.34 (64.46% ROI).
-
Risk: High, as the option is ITM. The stock would need to decline significantly to avoid assignment.
-
Very Long-Term (Strike $10.0, Expiry 2026-01-16):
- Profit: $2.14 (77.75% ROI).
- Risk: Very high, as the option is ITM. The stock would need to decline significantly over the long term to avoid assignment.
Conclusion
The most profitable options are those with higher premiums and favorable theta decay, but they come with increased risk of assignment. For traders seeking minimal risk, the near-term and short-term OTM options (e.g., Strike $12.0 and $11.5) are ideal. For those willing to accept higher risk, the medium-term and long-term ITM options (e.g., Strike $11.0 and $10.0) offer substantial income potential. Always consider your risk tolerance and market outlook when selecting options.
Long Put Option Strategy
To analyze the most profitable long put options for Kinross Gold Corporation (KGC) with a target stock price 2% above the current stock price, we need to consider the Greeks (Delta, Gamma, Theta, Vega, and Rho) and how they influence the option's behavior. Since the table of Greeks is not provided, I will outline a general framework for identifying the most profitable long put options and discuss the risk-reward profile of each choice. The analysis will focus on near-term, medium-term, and long-term expiration dates, as well as strike prices that align with the target price movement.
Key Considerations for Long Put Options
- Delta: Measures the sensitivity of the option price to changes in the underlying stock price. For long puts, Delta is negative, indicating that the option gains value as the stock price decreases. A Delta closer to -1 indicates a higher sensitivity to price changes.
- Gamma: Measures the rate of change of Delta. High Gamma means Delta can change rapidly, which is beneficial for long puts if the stock moves significantly.
- Theta: Measures the rate of decline in the option's value due to time decay. Long puts lose value as expiration approaches, so lower Theta is preferable.
- Vega: Measures sensitivity to changes in implied volatility. Higher Vega is beneficial for long puts, as increased volatility can boost option premiums.
- Rho: Measures sensitivity to changes in interest rates. Rho is less critical for long puts, as interest rate changes typically have a smaller impact on put options.
Most Profitable Long Put Options
Below are five choices for long put options, ranging from near-term to long-term expirations, with strike prices that align with the target stock price movement (2% above the current price). These options are selected based on their potential profitability, risk-reward profile, and alignment with the target price.
1. Near-Term Expiration (1-2 Weeks)
- Strike Price: Slightly above the current stock price (e.g., 2-3% above).
- Analysis: Near-term options have high Gamma, meaning they can gain value quickly if the stock moves downward. However, they also have high Theta, leading to rapid time decay. This option is high-risk, high-reward, as it requires the stock to move significantly within a short period.
- Risk: High. The stock may not move enough to offset time decay.
- Reward: High. If the stock drops sharply, the option could yield significant profits.
- Example: A put option with a strike price of $5.50 expiring in 1 week.
2. Medium-Term Expiration (1-2 Months)
- Strike Price: At or slightly above the current stock price (e.g., 1-2% above).
- Analysis: Medium-term options balance time decay and sensitivity to price movements. They have moderate Gamma and Theta, making them less risky than near-term options but still responsive to price changes.
- Risk: Moderate. The stock may not move enough to offset time decay, but the longer timeframe reduces the urgency.
- Reward: Moderate. If the stock declines, the option could yield solid profits.
- Example: A put option with a strike price of $5.25 expiring in 1 month.
3. Long-Term Expiration (3-6 Months)
- Strike Price: At or slightly below the current stock price (e.g., 0-1% above).
- Analysis: Long-term options have lower Theta, meaning time decay is slower. They also have higher Vega, making them more sensitive to changes in implied volatility. These options are ideal for investors who expect a gradual decline in the stock price or increased volatility.
- Risk: Low to moderate. The longer timeframe reduces the impact of time decay, but the option still requires the stock to move downward.
- Reward: Moderate to high. If the stock declines or volatility increases, the option could yield significant profits.
- Example: A put option with a strike price of $5.00 expiring in 3 months.
4. Deep In-the-Money Put (Long-Term Expiration)
- Strike Price: Significantly above the current stock price (e.g., 5-10% above).
- Analysis: Deep in-the-money puts have a Delta close to -1, meaning they behave similarly to a short position in the stock. They are less sensitive to time decay and volatility changes but require a larger upfront investment.
- Risk: Low. The option has intrinsic value, reducing the risk of total loss.
- Reward: Low to moderate. The option provides steady returns if the stock declines but has limited upside potential.
- Example: A put option with a strike price of $6.00 expiring in 6 months.
5. Out-of-the-Money Put (Long-Term Expiration)
- Strike Price: Below the current stock price (e.g., 2-5% below).
- Analysis: Out-of-the-money puts are cheaper but require a significant downward move in the stock price to become profitable. They have high Gamma and Vega, making them sensitive to price and volatility changes.
- Risk: High. The stock may not move enough to make the option profitable.
- Reward: High. If the stock declines sharply, the option could yield substantial profits.
- Example: A put option with a strike price of $4.75 expiring in 6 months.
Risk and Reward Summary
- Near-Term Options: High risk, high reward. Suitable for aggressive traders expecting a sharp price decline.
- Medium-Term Options: Moderate risk, moderate reward. Suitable for traders expecting a gradual price decline.
- Long-Term Options: Low to moderate risk, moderate to high reward. Suitable for investors with a longer time horizon.
- Deep In-the-Money Puts: Low risk, low to moderate reward. Suitable for conservative investors.
- Out-of-the-Money Puts: High risk, high reward. Suitable for speculative traders.
Conclusion
The most profitable long put options depend on your risk tolerance and time horizon. Near-term options offer the highest potential returns but come with significant risk. Long-term options provide a balance of risk and reward, making them suitable for most investors. Deep in-the-money puts are the safest choice but offer limited upside, while out-of-the-money puts are speculative but can yield substantial profits if the stock declines sharply. Choose the option that aligns with your investment goals and risk tolerance.
Short Put Option Strategy
Analysis of Short Put Options for Kinross Gold Corporation (KGC)
When selecting short put options, the goal is to maximize premium income while minimizing the risk of assignment (i.e., the stock falling below the strike price). The target stock price is 2% below the current stock price, so we focus on strike prices that are slightly out of the money (OTM) or at the money (ATM). Below is an analysis of the most profitable short put options, considering risk, reward, and the Greeks.
1. Near-Term Option: Expiring on 2025-01-31
- Strike Price: $8.5
- Premium: $0.10
- Delta: -0.147
- Theta: -0.076
- Vega: 0.257
Analysis: - This option has a high premium relative to its strike price, offering a 100% ROI if the stock remains above $8.50. - The delta of -0.147 indicates a 14.7% probability of the option expiring in the money (ITM), which is relatively low. - The theta of -0.076 suggests that the option will lose value quickly as expiration approaches, benefiting the seller. - Risk: If the stock falls below $8.50, the seller may be assigned shares. However, the 2% target price is unlikely to breach this level unless there is a significant drop.
Profit/Loss Scenario: - Maximum Profit: $0.10 (premium received). - Maximum Loss: $8.50 - $0.10 = $8.40 per share (if the stock falls to $0).
2. Short-Term Option: Expiring on 2025-02-07
- Strike Price: $10.0
- Premium: $0.08
- Delta: -0.166
- Theta: -0.009
- Vega: 0.462
Analysis: - This option offers a 100% ROI with a low delta of -0.166, indicating a 16.6% chance of assignment. - The vega of 0.462 suggests moderate sensitivity to volatility changes, but the short expiration period limits this risk. - The theta of -0.009 is lower than the near-term option, but the premium decay is still favorable for the seller.
Profit/Loss Scenario: - Maximum Profit: $0.08 (premium received). - Maximum Loss: $10.00 - $0.08 = $9.92 per share.
3. Medium-Term Option: Expiring on 2025-02-21
- Strike Price: $10.0
- Premium: $0.19
- Delta: -0.240
- Theta: -0.007
- Vega: 0.869
Analysis: - This option provides a higher premium of $0.19 with a 100% ROI. - The delta of -0.240 indicates a 24% chance of assignment, which is slightly higher but still manageable. - The vega of 0.869 suggests sensitivity to volatility, but the theta of -0.007 ensures steady premium decay.
Profit/Loss Scenario: - Maximum Profit: $0.19 (premium received). - Maximum Loss: $10.00 - $0.19 = $9.81 per share.
4. Long-Term Option: Expiring on 2025-05-16
- Strike Price: $10.0
- Premium: $0.60
- Delta: -0.320
- Theta: -0.003
- Vega: 2.086
Analysis: - This option offers a substantial premium of $0.60 with a 100% ROI. - The delta of -0.320 indicates a 32% chance of assignment, which is higher but acceptable given the longer time frame. - The vega of 2.086 makes this option sensitive to volatility changes, but the theta of -0.003 ensures gradual premium decay.
Profit/Loss Scenario: - Maximum Profit: $0.60 (premium received). - Maximum Loss: $10.00 - $0.60 = $9.40 per share.
5. Very Long-Term Option: Expiring on 2026-01-16
- Strike Price: $10.0
- Premium: $1.20
- Delta: -0.323
- Theta: -0.002
- Vega: 3.756
Analysis: - This option provides a high premium of $1.20 with a 100% ROI. - The delta of -0.323 indicates a 32.3% chance of assignment, which is reasonable for a long-term option. - The vega of 3.756 makes this option highly sensitive to volatility, but the theta of -0.002 ensures slow but steady premium decay.
Profit/Loss Scenario: - Maximum Profit: $1.20 (premium received). - Maximum Loss: $10.00 - $1.20 = $8.80 per share.
Summary of Recommendations:
- Near-Term (2025-01-31): Strike $8.5, Premium $0.10 (Low risk, high ROI).
- Short-Term (2025-02-07): Strike $10.0, Premium $0.08 (Low risk, high ROI).
- Medium-Term (2025-02-21): Strike $10.0, Premium $0.19 (Moderate risk, high ROI).
- Long-Term (2025-05-16): Strike $10.0, Premium $0.60 (Moderate risk, high ROI).
- Very Long-Term (2026-01-16): Strike $10.0, Premium $1.20 (Higher risk, high ROI).
Key Considerations:
- Risk of Assignment: All options have a low to moderate chance of assignment, but the 2% target price reduces this risk significantly.
- Premium Decay: Theta works in favor of the seller, especially for near-term options.
- Volatility Sensitivity: Longer-term options are more sensitive to volatility changes, but the high premiums compensate for this risk.
By selecting options with strike prices slightly below the current stock price and high premiums, you can maximize profitability while minimizing the risk of assignment.
Vertical Bear Put Spread Option Strategy
To construct a profitable vertical bear put spread strategy for Kinross Gold Corporation (KGC), we need to analyze the available short put options data and identify the most attractive combinations of strike prices and expiration dates. A vertical bear put spread involves buying a higher strike put option and selling a lower strike put option with the same expiration date. The goal is to profit from a moderate decline in the stock price while minimizing the risk of assignment and maximizing the return on investment (ROI).
Key Considerations:
- Target Stock Price: The target is a 2% move (up or down) from the current stock price. This means we are looking for options that are close to the current price and have a high probability of being in the money if the stock declines.
- Minimizing Assignment Risk: To minimize the risk of having shares assigned, we should focus on options that are out of the money (OTM) or slightly in the money (ITM) but with a low delta, indicating a lower probability of assignment.
- Profit and Loss Scenarios: The maximum profit for a bear put spread is the difference between the strike prices minus the net premium paid. The maximum loss is the net premium paid. We want to maximize the potential profit while keeping the risk manageable.
Analysis of Short Put Options:
The short put options data provided includes various strike prices and expiration dates. We will focus on options that are close to the current stock price and have a high ROI, as these are likely to be the most profitable.
Five Choices for Vertical Bear Put Spreads:
- Near-Term Expiration (4 Days to Expire)
- Short Put: Strike $8.5, Premium $0.10, Delta -0.147, ROI 100%
- Long Put: Strike $9.0, Premium $0.01, Delta -0.0099, ROI 100%
-
Analysis: This spread has a high ROI and a low delta for the short put, reducing the risk of assignment. The potential profit is $0.09 ($0.10 - $0.01), and the maximum loss is $0.01.
-
Short-Term Expiration (11 Days to Expire)
- Short Put: Strike $10.0, Premium $0.08, Delta -0.1659, ROI 100%
- Long Put: Strike $10.5, Premium $0.24, Delta -0.3780, ROI 90.08%
-
Analysis: This spread offers a good balance between risk and reward. The potential profit is $0.16 ($0.24 - $0.08), and the maximum loss is $0.08. The delta for the short put is moderate, indicating a lower risk of assignment.
-
Medium-Term Expiration (18 Days to Expire)
- Short Put: Strike $10.0, Premium $0.25, Delta -0.2290, ROI 100%
- Long Put: Strike $10.5, Premium $0.31, Delta -0.4015, ROI 92.32%
-
Analysis: This spread has a higher potential profit of $0.06 ($0.31 - $0.25) and a maximum loss of $0.25. The delta for the short put is still relatively low, reducing the risk of assignment.
-
Long-Term Expiration (109 Days to Expire)
- Short Put: Strike $10.0, Premium $0.60, Delta -0.3204, ROI 100%
- Long Put: Strike $11.0, Premium $1.10, Delta -0.4898, ROI 52.38%
-
Analysis: This spread offers a higher potential profit of $0.50 ($1.10 - $0.60) and a maximum loss of $0.60. The delta for the short put is moderate, indicating a lower risk of assignment over the longer term.
-
Very Long-Term Expiration (354 Days to Expire)
- Short Put: Strike $10.0, Premium $1.20, Delta -0.3232, ROI 100%
- Long Put: Strike $11.0, Premium $2.38, Delta -0.5059, ROI 35.97%
- Analysis: This spread has a high potential profit of $1.18 ($2.38 - $1.20) and a maximum loss of $1.20. The delta for the short put is moderate, reducing the risk of assignment over the very long term.
Conclusion:
The most profitable vertical bear put spread strategy depends on the trader's risk tolerance and time horizon. For near-term traders, the 4-day expiration spread offers a high ROI with minimal risk. For longer-term traders, the 109-day and 354-day expiration spreads offer higher potential profits but with increased risk. In all cases, the risk of assignment is minimized by selecting options with lower deltas, ensuring that the strategy remains profitable even if the stock price declines moderately.
Each of these spreads provides a balance between potential profit and risk, making them suitable for different trading strategies and risk appetites.
Vertical Bull Put Spread Option Strategy
To construct a vertical bull put spread for Kinross Gold Corporation (KGC), we need to sell a higher strike put option and buy a lower strike put option with the same expiration date. This strategy is designed to profit from a moderately bullish outlook, where the stock price is expected to stay above the lower strike price. The goal is to minimize the risk of assignment (i.e., having shares assigned) while maximizing the potential profit. We will focus on options with strike prices within 2% of the current stock price to align with the target price range.
Below, I analyze five vertical bull put spread strategies, ranging from near-term to long-term expirations, based on the provided options chain data. Each strategy is evaluated for its risk, reward, and probability of assignment.
1. Near-Term Expiration: January 31, 2025
- Sell Put Option: Strike = $8.0, Premium = $0.02
- Delta: -0.123, Theta: -0.0775, Vega: 0.2279
- Buy Put Option: Strike = $7.5, Premium = $0.01
- Delta: -0.091, Theta: -0.0658, Vega: 0.1838
Analysis:
- Max Profit: $0.01 (net premium received = $0.02 - $0.01).
- Max Loss: $0.49 (difference between strikes - net premium).
- Risk/Reward Ratio: 49:1 (high risk relative to reward).
- Probability of Assignment: Moderate, given the short put's delta of -0.123.
This strategy is high-risk due to the narrow spread and low premium. It is only suitable for traders with a very bullish outlook and a high tolerance for risk.
2. Short-Term Expiration: February 7, 2025
- Sell Put Option: Strike = $10.0, Premium = $0.08
- Delta: -0.1659, Theta: -0.0086, Vega: 0.4622
- Buy Put Option: Strike = $9.5, Premium = $0.03
- Delta: -0.0693, Theta: -0.0053, Vega: 0.2473
Analysis:
- Max Profit: $0.05 (net premium received = $0.08 - $0.03).
- Max Loss: $0.45 (difference between strikes - net premium).
- Risk/Reward Ratio: 9:1 (more favorable than the near-term strategy).
- Probability of Assignment: Lower, given the short put's delta of -0.1659.
This strategy offers a better risk/reward profile and is suitable for traders expecting the stock to remain above $10.0 by expiration.
3. Medium-Term Expiration: February 21, 2025
- Sell Put Option: Strike = $10.5, Premium = $0.40
- Delta: -0.4021, Theta: -0.0082, Vega: 1.0817
- Buy Put Option: Strike = $10.0, Premium = $0.19
- Delta: -0.2398, Theta: -0.0068, Vega: 0.8691
Analysis:
- Max Profit: $0.21 (net premium received = $0.40 - $0.19).
- Max Loss: $0.29 (difference between strikes - net premium).
- Risk/Reward Ratio: ~1.4:1 (favorable).
- Probability of Assignment: Moderate, given the short put's delta of -0.4021.
This strategy is ideal for traders with a moderately bullish outlook and a willingness to accept some risk of assignment. The higher premium provides a better cushion against losses.
4. Long-Term Expiration: May 16, 2025
- Sell Put Option: Strike = $10.0, Premium = $0.60
- Delta: -0.3204, Theta: -0.0034, Vega: 2.0860
- Buy Put Option: Strike = $9.0, Premium = $0.29
- Delta: -0.1752, Theta: -0.0026, Vega: 1.5050
Analysis:
- Max Profit: $0.31 (net premium received = $0.60 - $0.29).
- Max Loss: $0.69 (difference between strikes - net premium).
- Risk/Reward Ratio: ~2.2:1 (reasonable for a long-term strategy).
- Probability of Assignment: Lower, given the wider spread and longer time to expiration.
This strategy is suitable for traders with a long-term bullish outlook and a desire to collect higher premiums. The wider spread reduces the risk of assignment.
5. Very Long-Term Expiration: January 16, 2026
- Sell Put Option: Strike = $10.0, Premium = $1.20
- Delta: -0.3232, Theta: -0.0019, Vega: 3.7563
- Buy Put Option: Strike = $9.0, Premium = $0.53
- Delta: -0.2209, Theta: -0.0022, Vega: 2.3424
Analysis:
- Max Profit: $0.67 (net premium received = $1.20 - $0.53).
- Max Loss: $0.33 (difference between strikes - net premium).
- Risk/Reward Ratio: ~0.5:1 (highly favorable).
- Probability of Assignment: Low, given the long time to expiration and wider spread.
This strategy is ideal for traders with a very long-term bullish outlook and a desire to maximize premium income while minimizing assignment risk.
Conclusion
The most profitable vertical bull put spread strategies are those with longer expirations and wider spreads, such as the February 21, 2025 ($10.5/$10.0) and January 16, 2026 ($10.0/$9.0) spreads. These strategies offer favorable risk/reward ratios and lower probabilities of assignment. Traders should choose a strategy based on their time horizon, risk tolerance, and outlook for KGC's stock price.
Vertical Bear Call Spread Option Strategy
To construct a profitable vertical bear call spread strategy for Kinross Gold Corporation (KGC), we need to select two call options: one to sell (short call) and one to buy (long call). The goal is to maximize the net credit received while minimizing the risk of assignment, especially since the short call is in the money (ITM) and could lead to shares being assigned if the stock price rises above the strike price. The target stock price is within 2% of the current price, so we focus on strike prices close to the current price.
Key Considerations:
- Net Credit: The difference between the premium received from the short call and the premium paid for the long call.
- Risk of Assignment: Higher for ITM short calls, so we prefer out-of-the-money (OTM) or at-the-money (ATM) strikes.
- Expiration Dates: Near-term options offer higher time decay (theta) but less time for the stock to move, while longer-term options provide more time for the stock to move but lower time decay.
- Delta and Gamma: Delta measures sensitivity to price changes, and gamma measures the rate of change of delta. Lower delta for the short call reduces assignment risk, while higher gamma increases sensitivity to price changes.
Analysis of Vertical Bear Call Spreads:
1. Near-Term Expiration (4 Days to Expire, Expire: 2025-01-31)
- Short Call: Strike $10.0, Premium $0.64, Delta 0.8236
- Long Call: Strike $10.5, Premium $0.32, Delta 0.6601
- Net Credit: $0.32 ($0.64 - $0.32)
- Max Profit: $0.32 (net credit)
- Max Loss: $0.18 ($0.50 spread - $0.32 net credit)
- Risk/Reward: High reward relative to risk, but the short call is ITM, increasing assignment risk.
2. Short-Term Expiration (11 Days to Expire, Expire: 2025-02-07)
- Short Call: Strike $10.0, Premium $0.78, Delta 0.8086
- Long Call: Strike $10.5, Premium $0.36, Delta 0.6161
- Net Credit: $0.42 ($0.78 - $0.36)
- Max Profit: $0.42
- Max Loss: $0.08 ($0.50 spread - $0.42 net credit)
- Risk/Reward: Excellent reward relative to risk, but the short call is ITM, increasing assignment risk.
3. Medium-Term Expiration (18 Days to Expire, Expire: 2025-02-14)
- Short Call: Strike $10.0, Premium $0.83, Delta 0.6945
- Long Call: Strike $10.5, Premium $0.50, Delta 0.5796
- Net Credit: $0.33 ($0.83 - $0.50)
- Max Profit: $0.33
- Max Loss: $0.17 ($0.50 spread - $0.33 net credit)
- Risk/Reward: Good reward relative to risk, with the short call slightly ITM.
4. Long-Term Expiration (53 Days to Expire, Expire: 2025-03-21)
- Short Call: Strike $10.0, Premium $1.05, Delta 0.6950
- Long Call: Strike $10.5, Premium $0.52, Delta 0.4751
- Net Credit: $0.53 ($1.05 - $0.52)
- Max Profit: $0.53
- Max Loss: $0.47 ($0.50 spread - $0.53 net credit)
- Risk/Reward: High net credit, but the short call is ITM, increasing assignment risk.
5. Longest-Term Expiration (109 Days to Expire, Expire: 2025-05-16)
- Short Call: Strike $10.0, Premium $1.34, Delta 0.6662
- Long Call: Strike $10.5, Premium $0.86, Delta 0.5169
- Net Credit: $0.48 ($1.34 - $0.86)
- Max Profit: $0.48
- Max Loss: $0.52 ($0.50 spread - $0.48 net credit)
- Risk/Reward: High net credit, but the short call is ITM, increasing assignment risk.
Conclusion:
- Best Choice for Near-Term: The 11-day expiration (2025-02-07) with strikes $10.0 (short) and $10.5 (long) offers the highest net credit ($0.42) with a low max loss ($0.08). However, the short call is ITM, so there is a higher risk of assignment.
- Best Choice for Lower Risk: The 18-day expiration (2025-02-14) with strikes $10.0 (short) and $10.5 (long) provides a good balance of net credit ($0.33) and lower assignment risk due to the slightly lower delta of the short call.
- Long-Term Strategy: The 53-day expiration (2025-03-21) with strikes $10.0 (short) and $10.5 (long) offers a high net credit ($0.53) but comes with higher assignment risk due to the ITM short call.
Each strategy has its trade-offs between reward, risk, and time horizon. The choice depends on your risk tolerance and market outlook. If you expect the stock to remain stable or decline, the near-term or short-term strategies are preferable. For a longer-term outlook, the medium-term or long-term strategies may be more suitable.
Vertical Bull Call Spread Option Strategy
To construct a vertical bull call spread for Kinross Gold Corporation (KGC), we aim to maximize profitability while minimizing the risk of early assignment (since the strategy involves buying a call and selling a higher-strike call). The target stock price movement is 2% over or under the current stock price, so we focus on options with strike prices close to the current price. We will analyze the Greeks (delta, gamma, vega, theta, and rho) to identify the most profitable and risk-appropriate spreads.
Key Considerations for Vertical Bull Call Spreads
- Delta: Higher delta for the long call (closer to 1) indicates a higher probability of the option expiring in the money. The short call should have a lower delta to reduce the risk of assignment.
- Theta: Lower theta is preferable for the long call to minimize time decay, while higher theta for the short call helps generate premium income.
- Vega: Lower vega is preferable for the short call to reduce sensitivity to volatility changes, while higher vega for the long call benefits from potential volatility increases.
- Risk of Assignment: To minimize the risk of early assignment, we avoid deep in-the-money (ITM) short calls and focus on out-of-the-money (OTM) or slightly ITM options.
Top 5 Vertical Bull Call Spread Choices
1. Near-Term Expiration (4 Days to Expire)
- Long Call: Strike $10.0, Expiration 2025-01-31
- Delta: 0.8236 (high probability of expiring ITM)
- Theta: -0.0268 (moderate time decay)
- Premium: $0.64
- Short Call: Strike $10.5, Expiration 2025-01-31
- Delta: 0.6601 (lower probability of expiring ITM)
- Theta: -0.0237 (time decay works in favor of the short position)
- Premium: $0.32
- Net Premium Paid: $0.32
- Max Profit: $0.18 ($0.50 spread width - $0.32 net premium)
- Max Loss: $0.32 (net premium paid)
- Risk/Reward Ratio: 1:0.56
This spread is ideal for traders expecting a small upward move in the stock price within the next 4 days. The short call is slightly OTM, reducing the risk of assignment.
2. Short-Term Expiration (11 Days to Expire)
- Long Call: Strike $10.0, Expiration 2025-02-07
- Delta: 0.8086 (high probability of expiring ITM)
- Theta: -0.0115 (low time decay)
- Premium: $0.78
- Short Call: Strike $10.5, Expiration 2025-02-07
- Delta: 0.6161 (lower probability of expiring ITM)
- Theta: -0.0142 (time decay works in favor of the short position)
- Premium: $0.36
- Net Premium Paid: $0.42
- Max Profit: $0.08 ($0.50 spread width - $0.42 net premium)
- Max Loss: $0.42 (net premium paid)
- Risk/Reward Ratio: 1:0.19
This spread is suitable for traders expecting a moderate upward move in the stock price within 11 days. The short call is OTM, minimizing assignment risk.
3. Medium-Term Expiration (25 Days to Expire)
- Long Call: Strike $10.0, Expiration 2025-02-21
- Delta: 0.7376 (high probability of expiring ITM)
- Theta: -0.0089 (low time decay)
- Premium: $0.92
- Short Call: Strike $10.5, Expiration 2025-02-21
- Delta: 0.5918 (lower probability of expiring ITM)
- Theta: -0.0102 (time decay works in favor of the short position)
- Premium: $0.53
- Net Premium Paid: $0.39
- Max Profit: $0.11 ($0.50 spread width - $0.39 net premium)
- Max Loss: $0.39 (net premium paid)
- Risk/Reward Ratio: 1:0.28
This spread is ideal for traders expecting a gradual upward move in the stock price over the next 25 days. The short call is OTM, reducing assignment risk.
4. Long-Term Expiration (109 Days to Expire)
- Long Call: Strike $10.0, Expiration 2025-05-16
- Delta: 0.6662 (high probability of expiring ITM)
- Theta: -0.0049 (very low time decay)
- Premium: $1.34
- Short Call: Strike $10.5, Expiration 2025-05-16
- Delta: 0.5169 (lower probability of expiring ITM)
- Theta: -0.0051 (time decay works in favor of the short position)
- Premium: $0.86
- Net Premium Paid: $0.48
- Max Profit: $0.02 ($0.50 spread width - $0.48 net premium)
- Max Loss: $0.48 (net premium paid)
- Risk/Reward Ratio: 1:0.04
This spread is suitable for traders expecting a slow and steady upward move in the stock price over the next 109 days. The short call is OTM, minimizing assignment risk.
5. Very Long-Term Expiration (354 Days to Expire)
- Long Call: Strike $10.0, Expiration 2026-01-16
- Delta: 0.6661 (high probability of expiring ITM)
- Theta: -0.0029 (very low time decay)
- Premium: $2.14
- Short Call: Strike $10.5, Expiration 2026-01-16
- Delta: 0.5979 (lower probability of expiring ITM)
- Theta: -0.0022 (time decay works in favor of the short position)
- Premium: $1.35
- Net Premium Paid: $0.79
- Max Profit: $-0.29 ($0.50 spread width - $0.79 net premium)
- Max Loss: $0.79 (net premium paid)
- Risk/Reward Ratio: 1:-0.37
This spread is less attractive due to the negative risk/reward ratio. It is only suitable for traders expecting a significant upward move in the stock price over the next year.
Conclusion
The most profitable and risk-appropriate vertical bull call spreads are the near-term (4 days) and short-term (11 days) options. These spreads offer a favorable risk/reward ratio and minimize the risk of early assignment. For longer-term trades, the medium-term (25 days) spread is the best choice, as it balances profitability and risk. Avoid the very long-term spread due to its unfavorable risk/reward profile.
Spread Option Strategy
To construct a profitable calendar spread options strategy for Kinross Gold Corporation (KGC), we will analyze the provided options chain data, focusing on the Greeks and the target stock price movement of 2%. A calendar spread involves buying a longer-term option and selling a shorter-term option of the same type (both calls or both puts) with the same strike price. In this case, we will focus on a call calendar spread, where we buy a long-term call and sell a short-term call. The goal is to profit from the difference in time decay (theta) between the two options while minimizing the risk of assignment on the short call.
Key Considerations:
- Minimizing Assignment Risk: To avoid assignment, we will focus on out-of-the-money (OTM) or at-the-money (ATM) options, as these are less likely to be exercised early.
- Target Price Movement: We aim for a 2% move in the stock price, so we will select strike prices close to the current price.
- Time Decay (Theta): The short-term option should have a higher theta (faster time decay) than the long-term option to maximize the spread's profitability.
- Delta and Gamma: The long-term call should have a higher delta (closer to 1) to benefit from upward price movement, while the short-term call should have a lower delta to reduce directional risk.
- Vega: The long-term call should have a higher vega to benefit from an increase in implied volatility, while the short-term call should have a lower vega to reduce sensitivity to volatility changes.
Analysis of the Most Profitable Calendar Spreads:
1. Near-Term Spread (Expiration: 2025-01-31 and 2025-02-07)
- Long Call: Strike $9.0, Expiration 2025-02-07
- Delta: 0.8529, Theta: -0.0208, Vega: 0.4264
- This option has a high delta, indicating it will benefit from upward price movement, and a moderate vega, making it sensitive to volatility changes.
- Short Call: Strike $9.0, Expiration 2025-01-31
- Delta: -0.0099, Theta: -0.0026, Vega: 0.0296
- This option is deep OTM, minimizing assignment risk, and has a low vega, reducing sensitivity to volatility changes.
- Profit Potential: The spread benefits from the faster time decay of the short-term call while maintaining exposure to upward price movement. The net theta is favorable, and the low delta of the short call reduces directional risk.
2. Medium-Term Spread (Expiration: 2025-02-07 and 2025-02-14)
- Long Call: Strike $9.0, Expiration 2025-02-14
- Delta: 0.8389, Theta: -0.0147, Vega: 0.5789
- This option has a high delta and moderate vega, making it suitable for capturing upward price movement and volatility increases.
- Short Call: Strike $9.0, Expiration 2025-02-07
- Delta: -0.1809, Theta: -0.0167, Vega: 0.6249
- This option is slightly OTM, with a higher theta, allowing for faster time decay.
- Profit Potential: The spread benefits from the higher theta of the short-term call and the higher vega of the long-term call. The moderate delta of the short call reduces directional risk.
3. Long-Term Spread (Expiration: 2025-02-14 and 2025-02-21)
- Long Call: Strike $9.0, Expiration 2025-02-21
- Delta: 0.8316, Theta: -0.0115, Vega: 0.7013
- This option has a high delta and vega, making it ideal for capturing upward price movement and volatility increases.
- Short Call: Strike $9.0, Expiration 2025-02-14
- Delta: -0.1809, Theta: -0.0167, Vega: 0.6249
- This option is slightly OTM, with a higher theta, allowing for faster time decay.
- Profit Potential: The spread benefits from the higher theta of the short-term call and the higher vega of the long-term call. The moderate delta of the short call reduces directional risk.
4. Very Long-Term Spread (Expiration: 2025-02-21 and 2025-02-28)
- Long Call: Strike $9.0, Expiration 2025-02-28
- Delta: 0.8483, Theta: -0.0051, Vega: 0.9496
- This option has a high delta and vega, making it ideal for capturing upward price movement and volatility increases.
- Short Call: Strike $9.0, Expiration 2025-02-21
- Delta: -0.0674, Theta: -0.0033, Vega: 0.3648
- This option is deep OTM, minimizing assignment risk, and has a low vega, reducing sensitivity to volatility changes.
- Profit Potential: The spread benefits from the higher vega of the long-term call and the low delta of the short-term call. The net theta is favorable, and the low delta of the short call reduces directional risk.
5. Ultra Long-Term Spread (Expiration: 2025-02-28 and 2025-03-21)
- Long Call: Strike $9.0, Expiration 2025-03-21
- Delta: 0.8483, Theta: -0.0051, Vega: 0.9496
- This option has a high delta and vega, making it ideal for capturing upward price movement and volatility increases.
- Short Call: Strike $9.0, Expiration 2025-02-28
- Delta: -0.0931, Theta: -0.0038, Vega: 0.5268
- This option is deep OTM, minimizing assignment risk, and has a low vega, reducing sensitivity to volatility changes.
- Profit Potential: The spread benefits from the higher vega of the long-term call and the low delta of the short-term call. The net theta is favorable, and the low delta of the short call reduces directional risk.
Risk and Reward Scenarios:
- Profit Potential: The maximum profit occurs if the stock price is near the strike price at the expiration of the short-term call. The profit is limited to the net premium received minus the cost of the long-term call.
- Loss Potential: The maximum loss occurs if the stock price moves significantly above or below the strike price. The loss is limited to the net premium paid for the spread.
- Assignment Risk: The risk of assignment is minimized by selecting OTM or slightly OTM short calls with low deltas.
Conclusion:
The most profitable calendar spreads involve selecting strike prices close to the current stock price and focusing on options with favorable theta and vega characteristics. The near-term and medium-term spreads offer the best balance of profit potential and risk management, while the long-term and ultra-long-term spreads provide additional opportunities for capturing volatility increases. By carefully selecting strike prices and expiration dates, we can construct a calendar spread strategy that maximizes profitability while minimizing assignment risk.
Calendar Spread Option Strategy #1
To construct a profitable calendar spread options strategy for Kinross Gold Corporation (KGC), we will focus on buying a put option with a longer expiration date and selling a call option with a shorter expiration date. The goal is to minimize the risk of assignment on the short call while maximizing the potential profit from the time decay (theta) and volatility (vega) differences between the two options. We will target a stock price movement of 2% over or under the current price, ensuring the strategy remains within a manageable risk-reward framework.
Key Considerations:
- Minimizing Assignment Risk: We want to sell call options that are out of the money (OTM) or slightly in the money (ITM) but with a low delta, reducing the likelihood of early assignment.
- Maximizing Theta Decay: The short call should have a high theta, as it benefits from time decay, while the long put should have a lower theta to minimize the cost of holding the position.
- Vega Exposure: The long put should have a higher vega to benefit from potential increases in implied volatility, while the short call should have a lower vega to reduce sensitivity to volatility changes.
- Delta Neutrality: The strategy should aim for a delta-neutral or slightly bearish position, as we are buying a put and selling a call.
Top 5 Calendar Spread Strategies:
1. Near-Term Spread (4 Days vs. 11 Days)
- Buy Put: Strike $10.5, Expire 2025-02-07
- Delta: -0.616, Theta: -0.014, Vega: 0.708
- Sell Call: Strike $10.0, Expire 2025-01-31
- Delta: 0.824, Theta: -0.027, Vega: 0.290
- Analysis:
- The short call is slightly ITM but has a high theta, benefiting from rapid time decay.
- The long put is OTM with a high vega, providing protection against downside moves.
- Risk of assignment is moderate due to the ITM call, but the high premium offsets this risk.
- Potential Profit: $0.32 (short call premium) + $0.36 (long put profit) = $0.68.
- Potential Loss: Limited to the net premium paid if the stock moves significantly higher.
2. Medium-Term Spread (11 Days vs. 25 Days)
- Buy Put: Strike $10.0, Expire 2025-02-21
- Delta: -0.738, Theta: -0.009, Vega: 0.910
- Sell Call: Strike $9.5, Expire 2025-02-07
- Delta: 0.778, Theta: -0.009, Vega: 0.938
- Analysis:
- The short call is OTM with a high theta, benefiting from time decay.
- The long put is OTM with a high vega, providing downside protection.
- Risk of assignment is low due to the OTM call.
- Potential Profit: $0.52 (short call premium) + $0.44 (long put profit) = $0.96.
- Potential Loss: Limited to the net premium paid if the stock moves significantly higher.
3. Long-Term Spread (25 Days vs. 53 Days)
- Buy Put: Strike $10.0, Expire 2025-03-21
- Delta: -0.695, Theta: -0.006, Vega: 1.422
- Sell Call: Strike $9.0, Expire 2025-02-21
- Delta: 0.832, Theta: -0.011, Vega: 0.701
- Analysis:
- The short call is OTM with a high theta, benefiting from time decay.
- The long put is OTM with a very high vega, providing significant downside protection.
- Risk of assignment is low due to the OTM call.
- Potential Profit: $1.66 (short call premium) + $0.57 (long put profit) = $2.23.
- Potential Loss: Limited to the net premium paid if the stock moves significantly higher.
4. Longer-Term Spread (53 Days vs. 109 Days)
- Buy Put: Strike $10.0, Expire 2025-05-16
- Delta: -0.666, Theta: -0.005, Vega: 2.113
- Sell Call: Strike $9.0, Expire 2025-03-21
- Delta: 0.772, Theta: -0.005, Vega: 1.746
- Analysis:
- The short call is OTM with a high vega, benefiting from volatility changes.
- The long put is OTM with a very high vega, providing significant downside protection.
- Risk of assignment is low due to the OTM call.
- Potential Profit: $2.03 (short call premium) + $0.86 (long put profit) = $2.89.
- Potential Loss: Limited to the net premium paid if the stock moves significantly higher.
5. Longest-Term Spread (109 Days vs. 354 Days)
- Buy Put: Strike $10.0, Expire 2026-01-16
- Delta: -0.666, Theta: -0.003, Vega: 3.756
- Sell Call: Strike $9.0, Expire 2025-05-16
- Delta: 0.772, Theta: -0.005, Vega: 1.746
- Analysis:
- The short call is OTM with a high vega, benefiting from volatility changes.
- The long put is OTM with an extremely high vega, providing significant downside protection.
- Risk of assignment is low due to the OTM call.
- Potential Profit: $2.35 (short call premium) + $1.66 (long put profit) = $4.01.
- Potential Loss: Limited to the net premium paid if the stock moves significantly higher.
Summary:
The most profitable calendar spread strategy depends on the desired time horizon and risk tolerance. For near-term traders, the 4-day vs. 11-day spread offers quick profits with moderate risk. For longer-term traders, the 109-day vs. 354-day spread provides significant profit potential with minimal assignment risk. All strategies aim to balance theta decay, vega exposure, and delta neutrality while targeting a 2% stock price movement.
Calendar Spread Option Strategy #2
To construct a profitable calendar spread options strategy for Kinross Gold Corporation (KGC), we will focus on selling a put option with a near-term expiration and buying a call option with a longer-term expiration. The goal is to minimize the risk of assignment (since the sold put could result in shares being assigned if the stock price falls below the strike price) while maximizing the potential profit from the spread. We will target a stock price movement of 2% from the current price and analyze the Greeks to quantify risk and reward.
Key Considerations for the Strategy
- Minimizing Assignment Risk: To reduce the likelihood of assignment, we will focus on selling out-of-the-money (OTM) puts with a low delta (indicating a lower probability of the option expiring in the money). Theta (time decay) will also be a critical factor, as we want the sold put to lose value quickly as expiration approaches.
- Maximizing Profit Potential: For the long call, we will focus on options with a higher delta (indicating a higher probability of the option expiring in the money) and a longer expiration to allow time for the stock to move in our favor. Vega (sensitivity to volatility) will also be important, as we want the long call to benefit from potential increases in volatility.
- Target Price Range: We will focus on strike prices within 2% of the current stock price to align with the target movement.
Top 5 Calendar Spread Choices
1. Near-Term Spread (4 Days vs. 11 Days)
- Sell Put: Strike $11.0, Expiration 2025-01-31
- Delta: 0.256 (low probability of assignment)
- Theta: -0.018 (time decay works in our favor)
- Premium: $0.10
- Buy Call: Strike $10.0, Expiration 2025-02-07
- Delta: 0.808 (high probability of profit)
- Vega: 0.505 (benefits from volatility increases)
- Premium: $0.78
- Net Premium: $0.68 (received from selling put, paid for buying call)
- Risk/Reward:
- Max Profit: Unlimited (if the stock rises significantly)
- Max Loss: Limited to the difference between strikes minus the net premium ($1.0 - $0.68 = $0.32 per share)
- Assignment Risk: Low, as the sold put is OTM.
2. Medium-Term Spread (11 Days vs. 25 Days)
- Sell Put: Strike $11.5, Expiration 2025-02-07
- Delta: 0.152 (low probability of assignment)
- Theta: -0.008 (time decay works in our favor)
- Premium: $0.07
- Buy Call: Strike $10.5, Expiration 2025-02-21
- Delta: 0.591 (moderate probability of profit)
- Vega: 1.085 (benefits from volatility increases)
- Premium: $0.53
- Net Premium: $0.46 (received from selling put, paid for buying call)
- Risk/Reward:
- Max Profit: Unlimited (if the stock rises significantly)
- Max Loss: Limited to the difference between strikes minus the net premium ($1.0 - $0.46 = $0.54 per share)
- Assignment Risk: Low, as the sold put is OTM.
3. Long-Term Spread (25 Days vs. 109 Days)
- Sell Put: Strike $12.0, Expiration 2025-02-21
- Delta: 0.160 (low probability of assignment)
- Theta: -0.006 (time decay works in our favor)
- Premium: $0.09
- Buy Call: Strike $10.0, Expiration 2025-05-16
- Delta: 0.666 (high probability of profit)
- Vega: 2.112 (significant benefit from volatility increases)
- Premium: $1.34
- Net Premium: $1.25 (received from selling put, paid for buying call)
- Risk/Reward:
- Max Profit: Unlimited (if the stock rises significantly)
- Max Loss: Limited to the difference between strikes minus the net premium ($2.0 - $1.25 = $0.75 per share)
- Assignment Risk: Low, as the sold put is OTM.
4. Very Long-Term Spread (109 Days vs. 200 Days)
- Sell Put: Strike $12.0, Expiration 2025-05-16
- Delta: 0.397 (moderate probability of assignment)
- Theta: -0.005 (time decay works in our favor)
- Premium: $0.52
- Buy Call: Strike $10.0, Expiration 2025-08-15
- Delta: 0.658 (high probability of profit)
- Vega: 2.875 (significant benefit from volatility increases)
- Premium: $1.70
- Net Premium: $1.18 (received from selling put, paid for buying call)
- Risk/Reward:
- Max Profit: Unlimited (if the stock rises significantly)
- Max Loss: Limited to the difference between strikes minus the net premium ($2.0 - $1.18 = $0.82 per share)
- Assignment Risk: Moderate, as the sold put is closer to the money.
5. Ultra Long-Term Spread (200 Days vs. 354 Days)
- Sell Put: Strike $12.0, Expiration 2025-08-15
- Delta: 0.446 (moderate probability of assignment)
- Theta: -0.004 (time decay works in our favor)
- Premium: $0.88
- Buy Call: Strike $10.0, Expiration 2026-01-16
- Delta: 0.666 (high probability of profit)
- Vega: 3.756 (significant benefit from volatility increases)
- Premium: $2.14
- Net Premium: $1.26 (received from selling put, paid for buying call)
- Risk/Reward:
- Max Profit: Unlimited (if the stock rises significantly)
- Max Loss: Limited to the difference between strikes minus the net premium ($2.0 - $1.26 = $0.74 per share)
- Assignment Risk: Moderate, as the sold put is closer to the money.
Conclusion
The most profitable calendar spread strategy depends on your risk tolerance and time horizon. For low assignment risk and quick profits, the near-term spread (Choice 1) is ideal. For higher potential returns with moderate risk, the long-term spread (Choice 3) is a strong option. Always monitor the position and adjust as needed to manage risk and maximize profitability.
Similar Companies in Silver:
Pan American Silver Corp. (PAAS), Newmont Corporation (NEM), Wheaton Precious Metals Corp. (WPM), Franco-Nevada Corporation (FNV), Agnico Eagle Mines Limited (AEM), Gold Fields Limited (GFI), AngloGold Ashanti Limited (AU), Harmony Gold Mining Company Limited (HMY), Eldorado Gold Corporation (EGO), New Gold Inc. (NGD), Coeur Mining, Inc. (CDE), Barrick Gold Corporation (GOLD), Yamana Gold Inc. (AUY), Hecla Mining Company (HL), B2Gold Corp. (BTG)
https://seekingalpha.com/article/4744284-kinross-gold-positioned-to-shine-amid-a-bullish-gold-market
https://seekingalpha.com/article/4746174-into-2025-top-8-stocks-i-own-and-why-part-ii
https://finance.yahoo.com/news/kinross-announce-2024-q4-full-220000867.html
https://finance.yahoo.com/news/why-1-value-stock-could-144012491.html
https://finance.yahoo.com/news/why-investors-advantage-2-basic-140011770.html
https://finance.yahoo.com/news/steel-dynamics-post-q4-earnings-124000609.html
https://finance.yahoo.com/news/freeport-mcmoran-post-q4-earnings-131600138.html
https://finance.yahoo.com/news/heres-why-kinross-gold-kgc-144514868.html
https://finance.yahoo.com/news/international-paper-gears-report-q4-171000619.html
https://finance.yahoo.com/news/weaker-steel-prices-weigh-nucors-200000929.html
Copyright © 2025 Tiny Computers (email@tinycomputers.io)
Report ID: ZbMXUs
Cost: $0.00000
https://reports.tinycomputers.io/KGC/KGC-2025-01-26.html Home