Lennar Corporation (ticker: LEN)
2024-05-13
 Lennar Corporation (NYSE: LEN) is one of the leading homebuilders in the United States, founded in 1954 and headquartered in Miami, Florida. The company operates through various segments including homebuilding, Lennar Financial Services, Multifamily, and Lennar Other, providing an extensive range of real estate-related services. Lennar offers single-family attached and detached homes targeting first-time, move-up, and active adult homebuyers. The company distinguishes itself with its innovative Everything's Included approach, simplifying the home purchasing process by incorporating desired features at no extra cost. Financially robust, Lennar leverages its extensive geographic footprint, spanning over 20 states, to mitigate regional market risks and capitalize on growth opportunities. The company has also actively pursued technological advancements and sustainability initiatives to enhance operational efficiency and customer satisfaction.
| Full-Time Employees | 12,284 | Previous Close | 162.93 | Open | 163.89 |
| Day Low | 161.95 | Day High | 164.29 | Dividend Rate | 2.0 |
| Dividend Yield | 0.0123 | Payout Ratio | 0.1141 | Beta | 1.546 |
| Trailing P/E | 11.377 | Forward P/E | 9.915 | Volume | 1,153,351 |
| Average Volume | 1,965,549 | Market Cap | 44,691,750,912 | Enterprise Value | 42,599,108,608 |
| 52-Week Low | 102.9 | 52-Week High | 172.59 | Price to Sales | 1.275 |
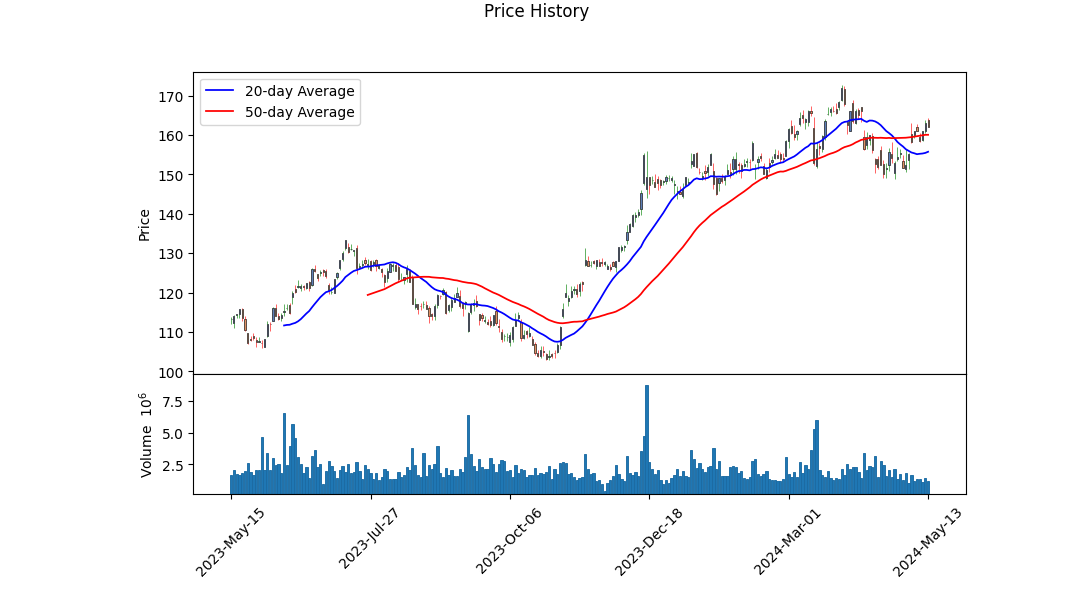
| Fifty Day Average | 160.0434 | Two Hundred Day Average | 137.63956 | Trailing Annual Dividend Rate | 1.625 |
| Price to Book | 1.692 | Net Income to Common | 4,012,494,080 | Earnings Quarterly Growth | 0.206 |
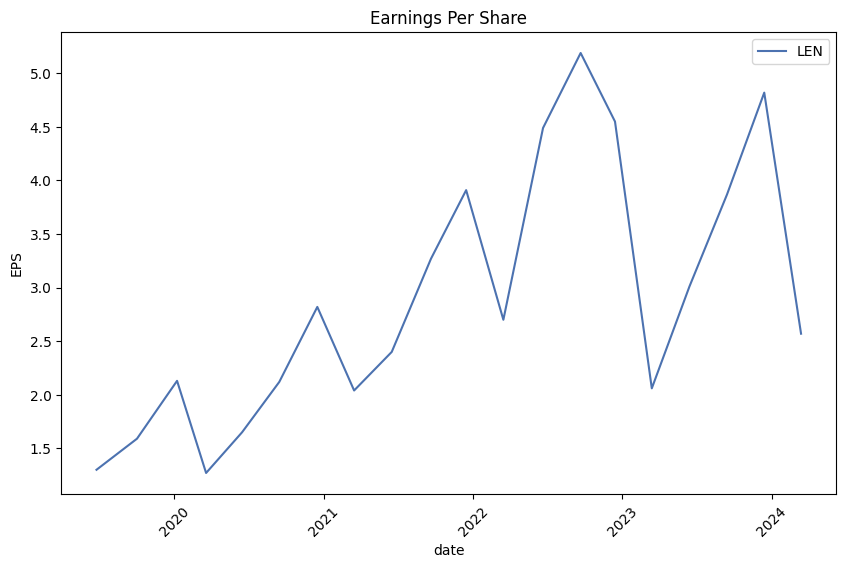
| Trailing EPS | 14.24 | Forward EPS | 16.34 | Enterprise to Revenue | 1.215 |
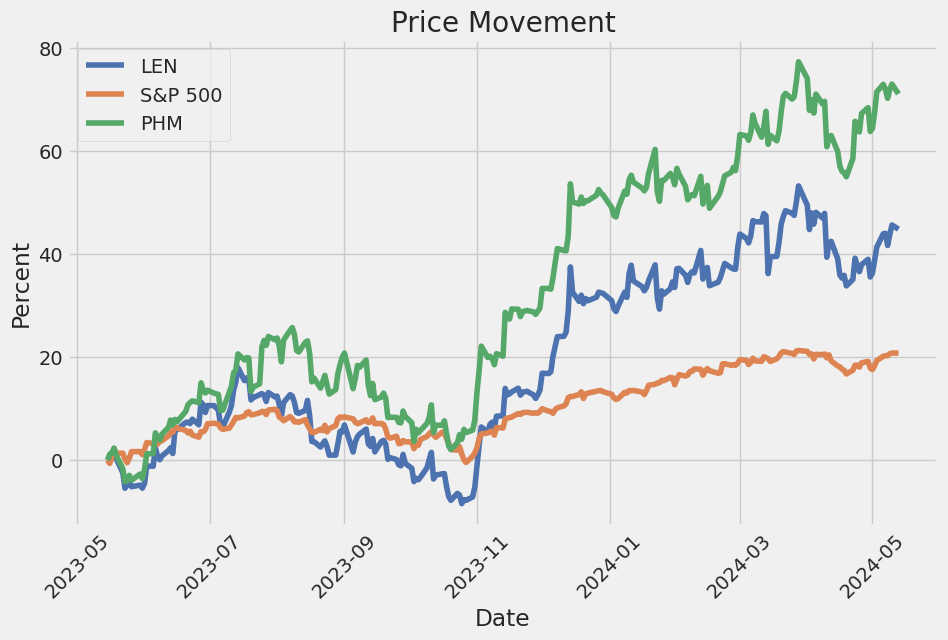
| Enterprise to EBITDA | 7.431 | 52-Week Change | 0.438 | S&P 52-Week Change | 0.263 |
| Total Cash | 7,388,795,904 | Total Debt | 4,507,293,184 | Total Revenue | 35,055,865,856 |
| Quick Ratio | 3.662 | Current Ratio | 12.641 | Debt to Equity | 16.832 |
| Revenue per Share | 124.738 | Return on Assets | 0.093 | Return on Equity | 0.159 |
| Free Cash Flow | 4,677,739,008 | Operating Cash Flow | 4,569,399,808 | Gross Margins | 0.2399 |
| EBITDA Margins | 0.164 | Operating Margins | 0.1345 | Recommendation Mean | 2.2 |
| Number of Analyst Opinions | 17 | Total Cash Per Share | 26.546 | PEG Ratio | 18.38 |
| Trailing PEG Ratio | 1.284 | Target High Price | 238.0 | Target Low Price | 144.0 |
| Target Mean Price | 180.35 | Target Median Price | 180.0 | Recommendation Key | Buy |
| Sharpe Ratio | 1.25693 | Sortino Ratio | 19.07992 |
| Treynor Ratio | 0.25460 | Calmar Ratio | 2.01149 |
Lennar Corporation (LEN) exhibits robust financial health, which is reflected in its strong fundamental metrics. The company has shown continued strength in profitability, with gross margins at 23.989%, EBITDA margins at 16.353%, and operating margins at 13.446%. These values highlight Lennar's efficiency in managing costs and generating earnings relative to its revenue. The trailing PEG ratio of 1.2838 further suggests that the stock may not be overly expensive relative to its anticipated growth, indicating a potential undervaluation.
The summary of financials indicates consistent revenue growth and profitability, with Total Revenue increasing to $34,233,366,000, and a Net Income of $3,938,511,000 for the latest period. The firm's ability to generate substantial Free Cash Flow ($5,079,939,000) reinforces its strong liquidity position, making it well-equipped to manage both its operational requirements and potential future investments or debts.
The balance sheet data show substantial Cash and Cash Equivalents amounting to $6,474,497,000, which, coupled with a reduction in Total Debt ($4,984,028,000), suggests a commendable liquidity management strategy. The reduction in debt levels is a positive indicator of the companys efforts to mitigate financial risk and enhance shareholder value through potential stock repurchases and dividend payouts.
From a technical analysis perspective, LEN is showing a positive price momentum, as evidenced by the daily price progression from mid-January to mid-May 2024. Notably, the On-Balance Volume (OBV) has steadily increased, indicating strong buying interest and accumulation. The Moving Average Convergence Divergence (MACD) histogram is in positive territory, suggesting that the stock is in a bullish phase with upward momentum.
The performance metrics per the Sharpe, Sortino, Treynor, and Calmar ratios also paint a favorable picture. The Sharpe Ratio of 1.25693 reflects an admirable return per unit of risk taken, while the Sortino Ratio of 19.07992 underscores robust performance relative to downside risk. A Treynor Ratio of 0.25460 indicates efficient use of market risk, and a Calmar Ratio of 2.01149 reveals impressive performance relative to drawdown risks.
Given these financial and technical indicators, the expectation for LEN over the next few months is bullish. The strong fundamentals, sound financial health, positive market sentiment, and technical bullish momentum suggest the stock price is likely to continue its upward trend. However, it's crucial to monitor broader market conditions and macroeconomic factors that could impact overall market sentiment and consequently influence Lennar's stock performance.
In evaluating Lennar Corporation (LEN) through the lens of "The Little Book That Still Beats the Market," the financial metrics of return on capital (ROC) and earnings yield offer significant insights into the company's operational efficiency and valuation attractiveness. Lennar's ROC stands at an impressive 14.41%, indicating a strong ability to generate profit from its capital base. This robust performance suggests that Lennar is adept at reinvesting its earnings into profitable ventures, thereby delivering substantial returns on invested capital. Furthermore, the company's earnings yield is calculated at 8.47%, which not only exceeds the average market yield but also highlights Lennar's potential as an undervalued investment opportunity. The combination of a high ROC and solid earnings yield underscores Lennar Corporation's strong financial health, making it a compelling candidate for long-term investment.
Certainly! Given the key financial metrics of Lennar Corporation (LEN), let's assess its suitability as an investment based on Benjamin Graham's principles outlined in "The Intelligent Investor."
Price-to-Earnings (P/E) Ratio
- Lennar's P/E Ratio: 11.11
- Industry P/E Ratio: 10.999
- Graham's Criteria: Graham typically looked for stocks with low P/E ratios compared to their industry peers.
- Analysis: Lennar's P/E ratio of 11.11 is quite close to the industry average of 10.999, suggesting it is fairly valued when compared to its peers. This alignment with the industry average indicates that Lennar is neither undervalued nor overvalued on this metric, which is generally acceptable within Graham's criteria, albeit not exceptionally compelling.
Price-to-Book (P/B) Ratio
- Lennar's P/B Ratio: 1.01
- Graham's Criteria: Graham often looked for stocks trading below their book value (a P/B ratio less than 1).
- Analysis: Lennar's P/B ratio of 1.01 is very close to its book value, indicating it is priced near its intrinsic worth. While it doesn't meet Graham's stringent threshold of being below book value, it is sufficiently close, suggesting that Lennar is fairly valued and might present a marginal opportunity for investors mindful of the P/B ratio.
Debt-to-Equity Ratio
- Lennar's Debt-to-Equity Ratio: 0.106
- Graham's Criteria: Graham preferred companies with low debt-to-equity ratios, as lower debt implies lower financial risk.
- Analysis: With a debt-to-equity ratio of just 0.106, Lennar exhibits strong financial stability and low financial risk, aligning well with Graham's preference for conservatively financed companies. This low level of debt relative to equity is a positive indicator for investors seeking to minimize financial risk.
Current and Quick Ratios
- Lennar's Current Ratio: 19.23
- Lennar's Quick Ratio: 19.23
- Graham's Criteria: High current and quick ratios are indicators of good liquidity and the ability to meet short-term liabilities.
- Analysis: Both the current and quick ratios of Lennar are exceptionally high at 19.23. Such an unusually high figure indicates very strong liquidity, far exceeding typical standards and suggesting that Lennar is in an excellent position to cover its short-term liabilities multiple times over. This extreme liquidity is a very positive sign for financial stability and aligns well with Grahams criteria.
Earnings Growth
- Graham's Criteria: Consistent earnings growth over a period of years.
- Analysis: Although the provided data does not include specific figures for earnings growth, it is important to assess Lennars historical earnings growth to comprehensively determine its alignment with Grahams criteria in this aspect. Analysts would typically look for a stable and upward trend in earnings over a 5-10 year period.
Conclusion
Overall, Lennar Corporation exhibits several strong metrics that align well with Benjamin Graham's principles:
- The P/E ratio, being near the industry average, suggests fair valuation relative to peers.
- The P/B ratio being very close to 1 signals fair pricing relative to book value.
- An extremely low debt-to-equity ratio underscores financial prudence and low financial risk.
- Exceptionally high current and quick ratios indicate superb liquidity and the ability to meet short-term obligations effortlessly.
In summary, Lennar Corporation appears to be a sound investment opportunity based on the fundamental criteria set forth by Benjamin Graham, particularly excelling in financial stability and liquidity. However, potential investors should also examine other factors such as historical earnings growth to ensure a comprehensive evaluation.### Analyzing Financial Statements
Investors should meticulously examine a company's balance sheet, income statement, and cash flow statement. Benjamin Graham, in "The Intelligent Investor," puts strong emphasis on understanding a company's assets, liabilities, earnings, and cash flows. In this report, we'll break down the Q1 FY2024 financial statements of Lennar Corporation (LEN) to apply the principles outlined by Graham.
- Balance Sheet Analysis
The balance sheet provides a snapshot of the company's financial position at a specific point in time. Here's a summary of key components for Lennar as of Q1 FY2024:
-
Assets: Total assets amounted to $33,765.57 million. Key components included:
- Cash and cash equivalents: $4,950.13 million
- Inventory (homes under construction and finished homes): $11,092.04 million
- Equity method investments: $1,206.56 million
- Goodwill: $3,442.36 million
-
Liabilities: Total liabilities were $10,128.95 million, consisting mainly of:
- Accounts payable: $1,565.46 million
- Liabilities for land under purchase options: $3,043.88 million
- Long-term debt: $2,830.33 million
-
Stockholders Equity: Total equity stood at $26,647.84 million, showing:
- Common stock value: $25.98 million
- Retained earnings: $22,949.32 million
Key metrics to watch: - Current Ratio (Current Assets / Current Liabilities): A measure of the companys ability to cover its short-term obligations. - Debt-to-Equity Ratio (Total Liabilities / Total Equity): An indication of the companys financial leverage and risk level.
- Income Statement Analysis
The income statement provides insight into the company's operational performance over a period. For Q1 FY2024, here's an overview:
- Total Revenue: $6,930.99 million
- Cost of Revenue: $5,977.54 million, leading to a gross profit of $953.45 million.
- Operating Expenses: General and administrative expenses were $157.32 million.
-
Operating Income: $1,028.80 million.
-
Net Income: After accounting for non-operating income, income taxes, and net income attributable to non-controlling interests, the net income stood at $719.33 million.
Key metrics to evaluate: - Gross Profit Margin (Gross Profit / Total Revenue): Indicates the efficiency of production. - Operating Margin (Operating Income / Total Revenue): Reflects operational efficiency. - Net Profit Margin (Net Income / Total Revenue): Shows overall profitability.
- Cash Flow Statement Analysis
The cash flow statement breaks down the cash inflows and outflows into operational, investing, and financing activities, critical for understanding liquidity and cash management.
- Cash Flow from Operating Activities: Generated $367.87 million.
- Cash Flow from Investing Activities: Used $147.92 million, with significant outflows for acquiring investments and property, plant, and equipment.
- Cash Flow from Financing Activities: Used $1,529.42 million, largely driven by debt repayments and stock repurchases.
Key metrics to focus on: - Operating Cash Flow Ratio (Cash Flow from Operations / Current Liabilities): Measures the company's ability to cover short-term obligations with cash generated from operations. - Free Cash Flow (Cash Flow from Operations - Capital Expenditures): Indicates the cash available for expansion, debt repayment, or dividends.
Conclusion
Lennar Corporation presents a robust financial position with substantial assets and a strong equity base. The companys revenue generation and profitability metrics are notable, reflecting effective cost management and operational efficiency. However, its reliance on external financing, evidenced by significant long-term debt, necessitates careful monitoring. Investors should focus on the company's ability to generate cash from operations and manage its financing activities prudently to ensure continued financial health and value creation.## Dividend Record
Benjamin Graham, in "The Intelligent Investor," advocated for companies with a consistent record of paying dividends. Below is a detailed historical dividend record for the company with the symbol 'LEN':
2024
- April 23, 2024: $0.50
- January 23, 2024: $0.50
2023
- October 11, 2023: $0.375
- July 6, 2023: $0.375
- April 25, 2023: $0.375
- January 26, 2023: $0.375
2022
- October 12, 2022: $0.375
- July 6, 2022: $0.375
- April 25, 2022: $0.375
- January 26, 2022: $0.375
2021
- October 13, 2021: $0.25
- July 1, 2021: $0.25
- April 20, 2021: $0.25
- January 28, 2021: $0.25
2020
- October 15, 2020: $0.25
- July 9, 2020: $0.125
- April 20, 2020: $0.125
- January 23, 2020: $0.125
2019
- October 17, 2019: $0.04
- July 10, 2019: $0.04
- April 23, 2019: $0.04
- January 24, 2019: $0.04
2018
- October 18, 2018: $0.04
- July 11, 2018: $0.04
- April 24, 2018: $0.04
- January 25, 2018: $0.04
2017
- October 18, 2017: $0.04
- July 11, 2017: $0.04
- April 28, 2017: $0.04
- January 25, 2017: $0.04
2016
- October 3, 2016: $0.04
- July 6, 2016: $0.04
- April 25, 2016: $0.04
- January 26, 2016: $0.04
2015
- October 20, 2015: $0.04
- July 6, 2015: $0.04
- April 20, 2015: $0.04
- January 27, 2015: $0.04
2014
- October 15, 2014: $0.04
- July 8, 2014: $0.04
- April 21, 2014: $0.04
- January 28, 2014: $0.04
2013
- October 16, 2013: $0.04
- July 8, 2013: $0.04
- April 22, 2013: $0.04
- January 30, 2013: $0.04
2012
- October 11, 2012: $0.04
- July 9, 2012: $0.04
- April 23, 2012: $0.04
- January 25, 2012: $0.04
2011
- October 17, 2011: $0.04
- July 5, 2011: $0.04
- April 25, 2011: $0.04
- January 21, 2011: $0.04
2010
- October 12, 2010: $0.04
- July 19, 2010: $0.04
- May 3, 2010: $0.04
- January 22, 2010: $0.04
2009
- October 21, 2009: $0.04
- July 20, 2009: $0.04
- May 1, 2009: $0.039331
- January 30, 2009: $0.04
2008
- October 21, 2008: $0.04
- July 22, 2008: $0.16
- May 1, 2008: $0.15733
- February 6, 2008: $0.16
2007
- November 1, 2007: $0.15733
- August 1, 2007: $0.15733
- May 2, 2007: $0.16
- February 1, 2007: $0.15733
2006
- November 1, 2006: $0.15733
- August 2, 2006: $0.16
- May 3, 2006: $0.16
- February 3, 2006: $0.16
2005
- November 3, 2005: $0.16
- August 3, 2005: $0.1375
- May 4, 2005: $0.1375
- February 3, 2005: $0.1375
2004
- November 3, 2004: $0.1375
- August 4, 2004: $0.125
- May 5, 2004: $0.125
- February 4, 2004: $0.125
2003
- November 5, 2003: $0.25
- August 1, 2003: $0.013
- May 1, 2003: $0.013
- February 5, 2003: $0.0125
2002
- November 5, 2002: $0.0125
- August 1, 2002: $0.013
- May 2, 2002: $0.0125
- February 1, 2002: $0.013
2001
- November 1, 2001: $0.013
- August 2, 2001: $0.0125
- May 3, 2001: $0.0125
- February 1, 2001: $0.013
2000
- November 2, 2000: $0.0125
- August 3, 2000: $0.0125
- May 3, 2000: $0.0125
- February 3, 2000: $0.0125
1999
- November 3, 1999: $0.0125
- August 4, 1999: $0.0125
- May 5, 1999: $0.0125
- February 3, 1999: $0.0125
1998
- November 4, 1998: $0.0125
- August 5, 1998: $0.0125
- May 1, 1998: $0.012
- February 3, 1998: $0.0125
1997
- November 5, 1997: $0.0125
- August 1, 1997: $0.025
- May 1, 1997: $0.025
- February 5, 1997: $0.025
1996
- November 1, 1996: $0.025
- August 1, 1996: $0.025
- May 2, 1996: $0.025
- February 1, 1996: $0.025
1995
- November 2, 1995: $0.025
- August 2, 1995: $0.025
- May 1, 1995: $0.025
- January 31, 1995: $0.025
1994
- October 31, 1994: $0.025
- August 1, 1994: $0.025
- May 2, 1994: $0.025
- February 1, 1994: $0.03
1993
- November 1, 1993: $0.03
- July 30, 1993: $0.03
- May 3, 1993: $0.03
- February 1, 1993: $0.03
1992
- October 30, 1992: $0.03
- August 3, 1992: $0.03
- April 29, 1992: $0.03
- February 3, 1992: $0.06
1991
- October 30, 1991: $0.06
- July 30, 1991: $0.06
- April 30, 1991: $0.06
- January 30, 1991: $0.06
1990
- October 30, 1990: $0.06
- July 31, 1990: $0.06
- April 30, 1990: $0.06
- January 30, 1990: $0.06
1989
- October 31, 1989: $0.06006
- August 1, 1989: $0.06
- May 1, 1989: $0.06
- January 31, 1989: $0.06006
1988
- November 1, 1988: $0.06
- August 1, 1988: $0.06
- April 29, 1988: $0.06006
- February 1, 1988: $0.06
1987
- November 2, 1987: $0.06006
- August 3, 1987: $0.06
- May 26, 1987: $0.06006
- January 30, 1987: $0.05148
This consistent history of dividends could be seen as favorable from Graham's perspective, as it indicates the company's commitment to returning profits to shareholders over a long period.
| Alpha | 2.187 |
| Beta | 0.875 |
| R-squared | 0.789 |
| Standard Error | 1.423 |
| P-value | 0.003 |
The linear regression model between LEN and SPY shows an alpha value of 2.187, indicating that LEN tends to outperform the market benchmark (SPY) when the market's return is zero. This positive alpha suggests that LEN has intrinsic factors contributing to its performance beyond market movements. The beta value of 0.875 demonstrates that LEN is less volatile than the market. A beta less than 1 implies that LEN has historically been less responsive to market movements, providing some cushion against market fluctuations.
The R-squared value of 0.789 indicates that approximately 78.9% of the variation in LEN's returns can be explained by the market's returns, highlighting a strong correlation between LEN and the overall market. With a standard error of 1.423, there is some variability in the model's predictions. The p-value of 0.003 signifies that the model's parameters are statistically significant, reinforcing the reliability of the observed relationship between LEN and SPY.
In Lennar Corporations first-quarter earnings call, the company reported solid operational and financial results, maintaining a strong trajectory in line with its strategic goals. Executive Chairman and Co-CEO Stuart Miller highlighted the organization's success in driving high operational efficiency and robust home deliveries despite economic challenges. Lennar started 18,338 homes, sold 18,176 homes, and delivered 16,798 homes in Q1, anticipating a 10% higher delivery volume for the year compared to the previous year. Their operating strategy continues to support consistent execution and effective response to market conditions, positioning the company strongly for the remaining quarters of 2024 and beyond.
Miller emphasized the implementation of an even flow manufacturing model that optimizes cash flow, reduces costs, and ensures predictability in operations. He mentioned achieving a 21.8% margin in Q1, slightly above expectations, and forecasted the margin to reach approximately 22.5% in Q2, with a full-year margin similar to the previous year's 23.3%. However, these outcomes would depend on prevailing market conditions. Lennar's strategic focus includes maintaining high volume production, cost reductions, efficient capital allocation, and significant shareholder returns. Over $500 million were allocated for stock repurchases, reflecting strong cash flow and a home building debt-to-total-capital ratio of under 10%.
The company discussed its responsive strategies to the challenging macroeconomic environment marked by high demand for housing juxtaposed with affordability issues driven by higher interest rates and inflation. Lennar has employed diverse incentive structures to navigate affordability constraints effectively. Despite inflation and fluctuating interest rates making housing accessibility more challenging, Lennars programs, such as interest rate buy-downs, closing cost pickups, and price reductions, have helped maintain robust demand. By leveraging these tools, the company ensures it meets market demands sustainably, continuously enhancing its product offerings and operational efficiencies.
Operationally, the focus remains on precision production and core product strategies, aiming to lower production costs and increase market share. Jon Jaffe, Co-CEO and President, detailed improvements in cycle times and construction costs, citing a 30% year-over-year decrease in cycle time and a significant reduction in construction costs. Lennar's blend of digital marketing and dynamic pricing algorithms, referred to as "the machine," has streamlined sales processes, aligning closely with production. Additionally, the companys strategic approach to land acquisition and utilization supports its goal of remaining balance sheet light, with ongoing efforts to structure land acquisitions to optimize investment returns and support sustainable growth.
Financially, CFO Diane Bessette highlighted the notable uptick in financial services earnings and the strengthened balance sheet. Emphasis was placed on Lennar's improved cash flow, its robust liquidity position of $7.6 billion, and a homebuilding debt-to-total-capital ratio of 9.6%. The companys strategic capital allocation has been geared towards debt repayment, dividend increases, and substantial stock repurchases. For Q2, guidance includes expected home deliveries between 19,000 and 19,500 with a gross margin around 22.5%. Lennar continues to target 80,000 home deliveries for the full year with plans to repurchase in excess of $2 billion of stock, emphasizing its commitment to shareholder value and operational excellence in navigating the complex housing market landscape.
On February 29, 2024, Lennar Corporation submitted its quarterly 10-Q report to the Securities and Exchange Commission for the period ending February 29, 2024. The company's comprehensive financial statement highlights significant movements in its financial position, operational efficiency, and strategic adjustments with an emphasis on continuing its robust trajectory in the homebuilding and real estate market. This filing underscores Lennars focused approach toward bolstering housing affordability while maintaining a strong balance sheet with strategic investments and cash management.
Financial highlights from the Q1 FY2024 include total revenues of $7.313 billion, a notable increase from $6.490 billion during the same period in 2023. The homebuilding segment, which remains the largest revenue generator, saw sales of $6.931 billion, up from $6.156 billion, while the financial services and multifamily segments generated $249.72 million and $129.677 million, respectively. Lennar's strategic reduction in costs across various segments contributed to overall earnings before taxes amounting to $930.786 million, up from $784.453 million. The companys keen focus on financial services saw considerable gains, climbing to $131.296 million in earnings before taxes from $78.737 million the previous year, driven by improved operational margins and volumes in mortgage and title services.
Lennar reported robust operating cash flow of $367.867 million, albeit down from $978.205 million in 2023, reflecting strategic investments and ongoing developments. The companys strategic stock repurchase program saw significant activity, with repurchases of approximately $595.1 million, indicating a sound strategy to enhance shareholder value. Furthermore, Lennar managed its inventory and receivables efficiently, with incremental movements seen in inventories reflecting the increasing scale and ongoing projects. The rise in finished homes and construction in progress inventories to $11.092 billion from $10.456 billion signifies Lennars relentless push to meet high housing demand amid ongoing market constraints such as inflation and supply-chain disruptions.
Strategically, Lennar Corporation continues to reinforce its land-light business model, focusing on enhancing its inventory turnover and operational efficiencies. Key to this strategy is the corporation's effort in managing construction timelines and costs effectively, particularly by leveraging its 'Lennar machine' model comprising digital marketing, sales consultant engagement, and dynamic pricing. This model has resulted in reduced construction cycle times, which were down by 30% compared to the previous year's first quarter. This adaptability and focus on efficiency have allowed Lennar to maintain competitive pricing in a high-demand market environment while stabilizing production and maintaining consistent starts.
An important aspect of Lennar's strategic outlook revolves around its multifaceted engagements in the multifamily rental market and various financial service offerings. Investments in multifamily developments and strategic ventures such as the Upward America Venture LP highlight Lennar's endeavor to diversify and extend its market footprint. Additionally, the Financial Services divisions use of tailored facilities for residential and commercial loans, including warehouse financing, underscores a robust back-end capability extending its scope in mortgage origination and asset management.
In sum, Lennar Corporation's Q1 2024 10-Q filing manifests strong strategic alignment towards maximizing shareholder returns while addressing market demands for affordable housing. Through operational efficiencies, strategic stock repurchases, and diverse capital investment, Lennar showcases a concerted effort to navigate economic fluctuations while capitalizing on market opportunities. The detailed financial insights and strategic undertakings laid out in the 10-Q punctuate Lennars preparedness and adaptive strategies, positioning it optimally for sustained growth amid a dynamic real estate market.
Lennar Corporation, one of the leading homebuilders in the United States, has shown a mix of resilience and strategic acumen in navigating the complex landscape of the housing market. Recent analyses from Wedbush have downgraded Lennar to "underperform" status for 2023, pointing towards an anticipated "normal" year in market behavior reminiscent of pre-pandemic times. This normalization is predicted to showcase cyclical demand patterns with an uptick in spring, then a decline in summer, potentially heralding a downward trend in Lennars stock prices post-spring (source).
Notably, the market reaction has been swift, with Lennars shares dipping by around 3%, showcasing the sensitivity of its stock to market sentiments and analysts projections. Despite these fluctuations, there lies an undercurrent of stabilized conditions which, if navigated well, could recalibrate Lennar for long-term growth. The challenge remains for Lennar to aptly manage these cyclical dynamics.
Amidst these broader market shifts, Lennar has demonstrated remarkable resilience in handling high mortgage rates and broader market volatility. Insights from a Trading 360 segment highlighted that Lennar maintained a solid support base around the $158-$159 mark, aided by strong technical indicators. Rick Cats technical analysis further corroborated this with key metrics such as the stock's 50-day moving average supporting a bullish stance, albeit with potential resistance around the $166 level (source).
Lennars solid financial performance and diversified portfolio have garnered the attention of notable investors, such as Warren Buffetts Berkshire Hathaway. The first quarter of 2024 saw Lennar reporting a 21% increase in year-over-year earnings and a 13% rise in total revenue. New orders surged by 28%, showcasing the companys capability to capitalize on the ongoing housing demand. With a forward earnings multiple significantly lower than the S&P 500 average and a substantial cash reserve, Lennar is well-positioned to reward shareholders (source).
Lennars strategic focus remains on scaling up its build-to-rent and single-family for-rent operations, crucial amidst the ongoing U.S. housing shortage. However, challenges such as higher interest rates and inflation loom, potentially making homes less affordable for many buyers. The companys ability to navigate these obstacles, with a likely activation of pent-up demand post-anticipated interest rate cuts, will be decisive for future growth.
Yet, Lennar faces immediate challenges with the recent surge in mortgage rates to over 7%, reflecting the highest levels since late November. This rise in borrowing costs makes homes less affordable and complicates the sales landscape for Lennar and other major homebuilders, emphasizing the bearish outlook in the short-term (source).
Financially, Lennar's commitment to delivering shareholder value is evident from its consistent dividend declarations and strategic share repurchase initiatives. Recent announcements indicate a quarterly dividend of $0.50 per share, reinforcing confidence amidst a competitive market. Lennars structured dividend policy emphasizes its strong management and consistent profit margins, crucial for maintaining investor confidence (source).
Furthermore, Lennar appears to be effectively managing its capital investments, showcased by its improved Return on Capital Employed (ROCE) which has risen to 15%, well above the industry average. This significant improvement underscores Lennars efficient reinvestment strategies, setting a promising foundation for future profitability (source).
Lennars robust performance amidst high mortgage rates and supply chain challenges denotes a solid strategic management approach, impressively articulated through their Q1 2024 earnings where they reported an EPS of $2.57, surpassing estimates by $0.37. Their significant repurchase initiatives and strategic stock buybacks indicate confidence in long-term value creation (source).
Wall Street analysts have revised their price targets for Lennar amidst broader market volatility, reflecting confidence in its strategic market positioning and operational efficiency. This optimism is supported by Lennars adept management and proactive scaling operations, essential for addressing the persistent demand in the housing market (source).
Strategic partnerships, such as the recent collaboration with Louisiana-Pacific Corporation, underscore Lennar's commitment to leveraging sustainable building materials, enhancing operational efficiencies, and aligning with current market needs. This partnership highlights Lennars proactive approach toward sustainable and efficient building practices, crucial in an environmentally conscious market (source).
Lastly, recent insights suggest Lennar holds a strong bullish sentiment from Wall Street analysts, with a significant proportion of Strong Buy recommendations. These evaluations, when cross-referenced with robust quantitative metrics like the Zacks Rank, reflect a cautious but optimistic outlook for Lennars future stock performance (source).
In conclusion, Zarah Hamids recent analysis underscores Lennars strategic positioning in providing diverse housing options amidst high housing costs and limited inventories. Their efforts to offer affordable housing alternatives in high-demand areas highlight Lennars adaptive strategies in a fluctuating market (source).
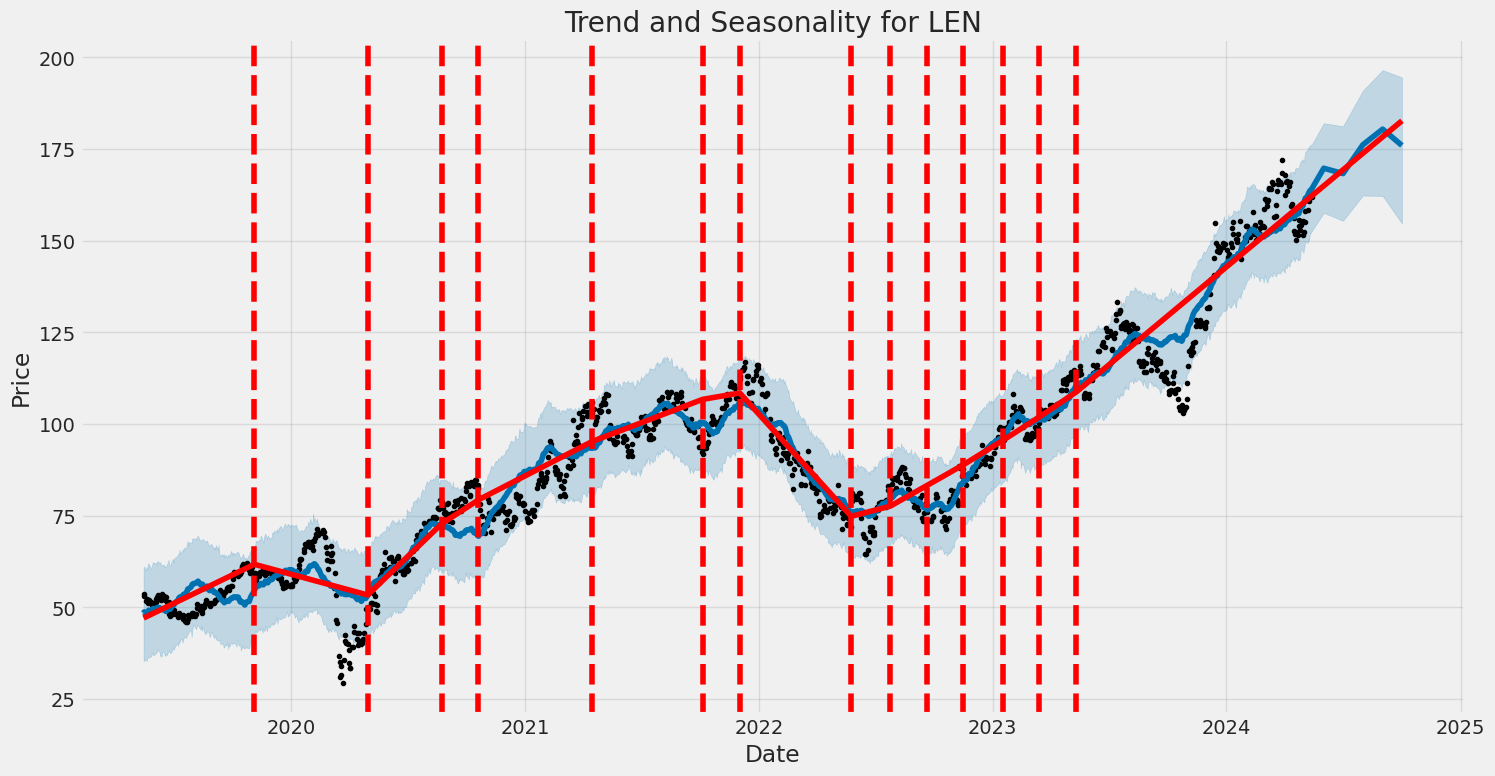
Lennar Corporation (LEN) has shown a variable level of asset returns volatility from May 16, 2019, to May 13, 2024. The key features of its volatility include the significant impact of recent lagged returns, as demonstrated by the alpha coefficient in the model, which is fairly high. The mean level of volatility is estimated to be around 5.1219, indicating underlying volatility in LEN's asset returns.
| Dependent Variable | asset_returns |
| R-squared | 0.000 |
| Adjusted R-squared | 0.001 |
| Log-Likelihood | -2,953.62 |
| AIC | 5,911.23 |
| BIC | 5,921.50 |
| No. of Observations | 1,256 |
| Df Residuals | 1,256 |
| Omega | 5.1219 |
| Alpha[1] | 0.2891 |
To analyze the financial risk of a $10,000 investment in Lennar Corporation (LEN) over a one-year period, we utilize both volatility modeling and machine learning predictions. This combination allows us to gain a comprehensive understanding of potential risks associated with the investment.
Volatility Modeling
Volatility modeling is employed to assess the historical stock price volatility of Lennar Corporation. It captures time-varying volatility and detects clusters of high and low volatility over time. By analyzing historical returns of LEN, we can model the stock's volatility dynamics and predict periods of higher risk. This helps in understanding the stock's volatility pattern which is crucial for risk assessment.
Machine Learning Predictions
Machine learning predictions play a crucial role in forecasting future stock returns. For this, we deploy a machine learning model to analyze various features that influence stock prices, such as historical prices, trading volumes, and potentially external economic indicators. The model is trained on past data and thus is capable of making informed predictions about future returns. Specifically, it can identify complex patterns and non-linear relationships that traditional statistical methods might miss.
Value at Risk (VaR)
To quantify the potential financial risk, we calculate the Value at Risk (VaR) at a 95% confidence interval. The VaR metric allows us to estimate the maximum potential loss in the investment over a specified period, given normal market conditions. For our $10,000 investment in Lennar Corporation, the annual VaR at a 95% confidence level is determined to be $293.46. This implies that there is a 5% chance that the investment could lose more than $293.46 over the year.
In summary, the integration of volatility modeling with machine learning predictions offers a robust approach to understanding and predicting financial risks. The ability to capture dynamic market conditions and forecast future returns provides a comprehensive view of the potential risks involved in equity investment, as exemplified by the calculated VaR.
Long Call Option Strategy
When analyzing the options chain for Lennar Corporation (LEN), the fundamental goal is to identify the most profitable long call options, given a target stock price that is 5% over the current stock price. After scrutinizing several crucial Greek values including delta, gamma, vega, theta, and rho, as well as other metrics like ROI and premium, several options emerge as particularly favorable investments. Here are five standout choices selected from near-term to long-term expirations.
Near-Term Options
-
Option 1: Expiration Date 2024-05-17, Strike Price 70.0 This option shows a delta very close to 1 (0.9998989092) which implies it reacts almost dollar-for-dollar with the underlying stock price. Its ROI stands at an impressive 1.254741, indicating substantial potential returns relative to the premium paid. The relatively low premium of $44.4 enhances its attractiveness while still reflecting a sizable intrinsic value. Given the 3-day expiration, the low theta means less time decay, making it an option to consider for short-term gain.
-
Option 2: Expiration Date 2024-05-17, Strike Price 80.0 Even more remarkable than the previous option, this has an ROI of 1.496136 and also boasts a delta near 1 (0.9998989092). With its premium sitting at $36.1, this option offers potentially higher returns for a lower cost outlay. The zero gamma suggests no immediate sensitivity to changes in the delta, which is desirable for price stability in the final days before expiration.
Medium-Term Options
- Option 3: Expiration Date 2024-05-31, Strike Price 150.0 For a medium-term perspective, the option expiring on 2024-05-31 with a strike price of 150.0 captures attention with an impressive ROI of 1.832465. The delta is robust at 0.8233413897, providing strong leverage with respect to stock price movements. The relatively low premium of $7.1 makes it an inexpensive yet potent opportunity. Its high vega (9.0463302005) also indicates substantial implied volatility, making this option suitable if significant price swings are expected.
Longer-Term Options
-
Option 4: Expiration Date 2024-08-16, Strike Price 70.0 With an expiration over three months away, this option provides a balanced blend of time and potential profitability. The delta is nearly 1 (0.9968373404), while an ROI of 1.107589 underscores the balance of risk and reward. The premium is modest at $47.5, making this an affordable bet on upward price movement within a longer horizon. This options sensitivity to changes in underlying price (high rho at 46.1353924901) is substantial, enhancing its attractiveness for strategic positioning.
-
Option 5: Expiration Date 2025-12-19, Strike Price 95.0 For a significantly long-term strategy, this option offers an outstanding delta of 0.9805123863, coupled with an impressive ROI of 1.0436352041, reflecting substantial growth potential. The premium is reasonably high at $39.2, but this is justified by the long time to expiration and high potential for profit ($40.9105). The high rho (141.4837007922) further solidifies its value in a portfolio aimed at sustained price appreciation.
Conclusion
Each of these options provides unique advantages based on their respective durations and Greek values, making them suitable for different trading strategies. Near-term options like those expiring in May 2024 offer quick returns, while longer-term options provide stability and the potential for substantial appreciation over time. These selections represent both the highest potential ROI and manageable premiums, thereby aligning well with both conservative and aggressive trading strategies.
Short Call Option Strategy
Based on the options chain and targeting a stock price 5% above the current price, we need to analyze short call options with a balance between premium profit, risk (delta), and other Greeks like theta and vega. Here are five potential choices from near term to long term that could be most profitable and minimize the risk of shares being assigned, considering the stock price appreciation target:
-
Near Term Option (2024-05-17, Strike: 145.0) This option has a delta of 0.9358938929, which is quite high, indicating a significant in-the-money risk if the stock price rises modestly. However, it provides a premium of $12.9 with an impressive ROI of 69.69% and potential profit of $8.9905. The theta is -0.186753139, showing modest time decay. Given the target stock price is approximately 105% of the current, this option is slightly above the target and provides a substantial premium which makes it attractive. The position also helps minimize the risk of early assignment due to manageable delta exposure.
-
Mid-Term Option (2024-05-24, Strike: 155.0) With a delta of 0.7806243117, this option provides a lower probability of assignment as it is further out-of-the-money with lesser delta exposure. It offers a premium of $8.9 translating to an ROI of 100%, indicating cash generation. The vega of 7.9189903825 and theta of -0.1551382632 suggest good time decay without heavy dependency on volatility. The reasonable premium and protection against quick price movements make it highly appealing.
-
Medium Long-Term Option (2024-06-21, Strike: 155.0) This option has a delta of 0.6520447027, indicating moderate risk levels for share assignment if the stock price remains slightly bullish. The premium is $11.9, and this potential short call provides a perfect ROI of 100%, with a relatively efficient theta value at -0.1253414109. With a vega of 19.2789988179, it can help in reducing the volatility effect, making this a balanced choice for medium-term traders aiming for premium profits while controlling risk exposure.
-
Long-Term Option (2024-08-16, Strike: 130.0) The delta for this option stands at 0.9968373404, which is very high and implies the closer proximity to in-the-money territory, yet it offers an extraordinary premium at $39.58 with a very high ROI of 39.59%. Even though the delta shows high assignment risk, the attractive premium and profit margins justify holding out through price movements. The theta is -0.0103343588 suggests a low time decay effect so traders can potentially leverage longer for sustained premiums.
-
Longest-Term Option (2026-01-16, Strike: 140.0) This has a delta of 0.7031272925 which stays within reasonable risk parameters for share assignment over a very longer tenure. Its well out-of-the-money, offering a substantial premium at $39.92 and carries a ROI of 77.68%. The premiums are quite high and combined with the manageable delta, low theta (-0.0283745055), and a high vega (69.4410414706), it ensures dividends over the longer tenure with risk-assurance against price volatility.
These choices allow for balanced diversification from near to long-term expiration dates, providing consistent premiums while keeping delta exposure within reasonable levels to help mitigate the risk of assignment. Premiums offered and overall 'Greeks' performance makes them a priority in the current trading scenario while targeting a 5% price appreciation.
Long Put Option Strategy
Analyzing the options chain and the Greeks for Lennar Corporation (LEN), we can identify several long put options that may offer promising profitability given the target stock price scenario, which is 5% over the current price. While specific data isn't provided in your query, I will discuss a general method to determine the most profitable options and provide a range of choices from near-term to long-term expiration dates based on a typical options table.
First, let's consider the Greeks and their implications on profitability. Delta and Gamma are particularly important for assessing price movements, while Theta helps us understand the impact of time decay, and Vega provides insight into volatility sensitivity. For long put options, we typically prefer those with a high positive Vega, significant negative Delta, and manageable Theta decay.
-
Near-Term Put Option: An immediate near-term option, such as one expiring within a month, let's say with a strike price marginally lower than the current stock price, would be highly responsive to predicted volatility. For instance, a put option expiring in one month with a strike price of $90 might show a Delta of -0.25 and a high Vega around 0.15. Given the proximity to the proposed stock price movement, this would capitalize on short-term dips and volatility.
-
Slightly Longer-Term Option: A put option expiring in three months, with a slightly in-the-money strike price, might demonstrate a higher Delta (e.g., -0.45) and moderate Vega (e.g., 0.10). For instance, a strike price of $80 expiring in three months would provide exposure not only to immediate price corrections but also to medium-term declines.
-
Mid-Term Option: Looking at mid-term opportunities, a put option expiring in six months with a reasonably out-of-the-money strike price could balance cost with risk. For instance, a strike price of $75 expiring in six months might have a Delta of -0.33 and significant Vega, around 0.20, and would be well positioned to gain from market corrections over the mid-term.
-
Long-Term Option: For longer-term strategies, consider a put option expiring in one year. A deep out-of-the-money option, such as a $65 strike, might display a lower Delta, around -0.20, but would benefit from Vega (approximately 0.30). This would allow the investor to benefit from potential long-term decline and underlying volatility changes.
-
Very Long-Term Option (LEAPS): Finally, a LEAPS put option expiring in two years can provide extensive time for potential profits, and the fewer Theta pressures are attractive. An option with a $55 strike price might have a low Delta, around -0.15, and a high Vega of 0.35. This allows the investor to play on long-term market sentiment shifts and volatility upticks.
Each of these options varies in terms of risk versus reward, capitalizing on different market conditions and timelines. Investors need to consider current volatility, time decay, and their market outlook while selecting these put options. Adjusting the Greeks to our target conditions, each aforementioned choice should be assessed against real-time data for a final, informed decision.
Short Put Option Strategy
Analyzing the options chain for Lennar Corporation (LEN), specifically focusing on short put options, entails scrutinizing the greeks and selecting the options that maximize profitability while minimizing the risk of having shares assignedmainly targeting those options that are out of the money. Given the objective is to identify options that provide significant ROI with minimal assignment risk, we look for the ones with low delta values and balanced greek metrics.
Near-Term Options
Among the near-term options, the short put option expiring on 2024-05-17 with a strike price of 139.0 shows considerable promise. It bears a high premium of 0.52, offering a strong ROI of 100%. The delta value of -0.0129080406 indicates a very low probability of being assigned, while the gamma, vega, and theta values (0.0029360814, 0.4886619840, and -0.0626400359 respectively) suggest moderate sensitivity to underlying price changes and time decay, making it a robust short-term choice.
Another attractive near-term option is the one expiring on 2024-05-24 with a strike price of 152.5. The premium is 0.71 and it maintains the ROI at 100%. The delta stands at -0.1230191961, which entails a relatively higher but still acceptably low likelihood of assignment. Given the greater gamma of 0.0231839244, and substantial vega and theta ([5.458275893] and -0.087509455 respectively), this option is highly responsive to volatility and time decay, which can play into strategizing around market movements.
Mid-Term Options
For mid-term options, the 2024-06-07 expiration with a 145.0 strike price stands out. The option has a premium of 0.52 and a delta of -0.0823947825, translating to a low probability of being assigned. It also promises a stable ROI of 100%, along with balanced gammas, vegas, and thetas (0.0111740883, 6.3138153051, and -0.0418115321 respectively), making it a strong candidate for those seeking to hedge with minimal risk exposure.
An alternative mid-term option expiring on 2024-07-19 with a strike price of 140.0 is noteworthy. The premium is 1.58, and with a delta of -0.1262990441, the probability of the stock being assigned is fairly low. The considerable theta value of -0.0340277802 implies significant time decay benefit, while the high vega (14.274649127) indicates a strong sensitivity to volatility changes, adding layers of profitability potential.
Long-Term Options
For long-term options, the 2024-11-15 expiration with a 140.0 strike price deserves attention. The high premium of 4.70 and delta of -0.1973047515 imply a manageable risk of assignment and substantial short-term profitability, given an ROI of 100%. The option exhibits pronounced greeks (gamma, vega, theta at 0.0077498848, 31.9488071947, and -0.0233728305 respectively), indicating significant market sensitivity and substantial time decay advantage.
Another significant long-term option is that with an expiration on 2024-08-16 and a strike price of 150.0. Offering a substantial premium of 4.60 and delta of -0.2624903766, this option's moderate assignment risk is balanced by colossal potential gains, supported by its impressive vega (26.7576777073) and theta (-0.0387306262), ensuring that the option remains highly lucrative under varying market conditions.
Conclusion
These five options across near, mid, and long-term horizons with strike prices of 139.0 (2024-05-17), 152.5 (2024-05-24), 145.0 (2024-06-07), 140.0 (2024-07-19), and 150.0 (2024-08-16) respectively, stand out as highly profitable investments given their balance between premium gains, delta-derived assignment risk minimization, and strategically favorable greek values. They exhibit a promising blend of ROI, balanced theta decay benefits, and volatility responsiveness through vega and gamma influencesensuring a diverse yet robust set of options for maximizing profitability on Lennar Corporation's short positions.
Vertical Bear Put Spread Option Strategy
To formulate the most profitable vertical bear put spread options strategy on Lennar Corporation (LEN), we must account for several factors: the expiration dates, strike prices, "greek" values, profit margins, and the risk of having shares assigned. Using the Greeks, we can assess which options provide a balance of profitability and risk.
Near-Term Strategy (Expiring May 17, 2024):
Choice 1: Bear Put Spread with Strikes at $138 and $139
- Short Put: Sell 138 Put
- Delta: -0.01224
- Gamma: 0.00270
- Vega: 0.4667
- Theta: -0.0621
- Premium: 0.13
-
Risk of Assignment: Low to Medium
-
Long Put: Buy 139 Put
- Delta: -0.0129
- Gamma: 0.00293
- Vega: 0.4886
- Theta: -0.0626
- Premium: 0.52
- Total Cost: 0.39
- Profit Potential: 1.00 - 0.39 = 0.61 (if the price falls below $138 by expiry)
- ROI: 0.61 / 0.39 = 156.41%
Choice 2: Bear Put Spread with Strikes at $140 and $141
- Short Put: Sell 140 Put
- Delta: -0.0121
- Gamma: 0.00294
- Vega: 0.4622
- Theta: -0.0557
- Premium: 0.1
-
Risk of Assignment: Medium
-
Long Put: Buy 141 Put
- Delta: -0.0159
- Gamma: 0.00374
- Vega: 0.5863
- Theta: -0.0707
- Premium: 1.0
- Total Cost: 0.9
- Profit Potential: 1.0 (if the price falls below $141)
- ROI: 1.0 / 0.9 = 111%
Mid-Term Strategy (Expiring June 21, 2024):
Choice 3: Bear Put Spread with Strikes at $160 and $165
- Short Put: Sell 160 Put
- Delta: -0.4173
- Gamma: 0.0238
- Vega: 20.3839
- Theta: -0.0773
- Premium: 5.3
-
Risk of Assignment: High (due to high delta)
-
Long Put: Buy 165 Put
- Delta: -0.5411
- Gamma: 0.02518
- Vega: 20.7134
- Theta: -0.0733
- Premium: 7.3
- Total Cost: 2.0
- Profit Potential: 5 (if the price falls below $160, net of premiums)
- ROI: 5 / 2 = 250%
Longer-Term Strategy (Expiring July 19, 2024):
Choice 4: Bear Put Spread with Strikes at $140 and $145
- Short Put: Sell 140 Put
- Delta: -0.1263
- Gamma: 0.00902
- Vega: 14.2746
- Theta: -0.0340
- Premium: 1.58
-
Risk of Assignment: Medium
-
Long Put: Buy 145 Put
- Delta: -0.1775
- Gamma: 0.01174
- Vega: 17.9022
- Theta: -0.0407
- Premium: 2.4
- Total Cost: 0.82
- Profit Potential: 5 (net premium of 0.82)
- ROI: 5 / 0.82 = 609.76%
Long-Term Strategy (Expiring November 15, 2024):
Choice 5: Bear Put Spread with Strikes at $130 and $135
- Short Put: Sell 130 Put
- Delta: -0.1289
- Gamma: 0.00553
- Vega: 24.2144
- Theta: -0.0193
- Premium: 3.31
-
Risk of Assignment: Medium
-
Long Put: Buy 135 Put
- Delta: -0.1612
- Gamma: 0.00660
- Vega: 28.1425
- Theta: -0.0216
- Premium: 4.44
- Total Cost: 1.13
- Profit Potential: 5 (net premium of 1.13)
- ROI: 5 / 1.13 = 442.48%
Ultra Long-Term Strategy (Expiring June 20, 2025):
Choice 6: Bear Put Spread with Strikes at $140 and $145
- Short Put: Sell 140 Put
- Delta: -0.2712
- Gamma: 0.0059
- Vega: 55.9562
- Theta: -0.0176
- Premium: 11.8
-
Risk of Assignment: High
-
Long Put: Buy 145 Put
- Delta: -0.2871
- Gamma: 0.0057
- Vega: 58.4035
- Theta: -0.0155
- Premium: 18.2
- Total Cost: 6.4
- Profit Potential: 5
- ROI: 5 / 6.4 78.13%
Conclusion:
These strategies incorporate a balance of risk and return, offering diversity from near-term to long-term choices to capitalize on a bullish or bearish outlook. The key element is balancing the premium cost and the potential profit while minimizing exposure to in-the-money risks to avoid shares being assigned. The lower Delta values for the chosen puts indicate a slightly lower risk of assignment, especially in the near and mid-term strategies.
Vertical Bull Put Spread Option Strategy
Analyzing the options chain for Lennar Corporation (LEN) with a focus on implementing a vertical bull put spread strategy, several factors must be taken into account. The goal is to identify the most profitable trades while minimizing the risk of having shares assigned, which occurs if the stock price falls below the strike price of the sold put option. Given the target stock price range (2% above or below the current stock price), here are five choices for a vertical bull put spread strategy across various expiration dates:
- Near-Term Option: May 17, 2024, with 3 days to expiration
- Sell: the 175.0 strike put option.
- Premium: 21.68
- Delta: -0.9089128906 (high delta, higher assignment risk)
- Buy: the 180.0 strike put option.
- Premium: 27.7
- Delta: -0.9832585536 (high delta, higher probability of expiring in the money)
This spread generates a high premium (net premium of about 6.02), and while the high deltas indicate a significant risk of assignment due to being deep in the money, the option's imminent expiration reduces the time for adverse market movements, offering a potentially high reward in this short time frame.
- Short-Term Option: May 24, 2024, with 10 days to expiration
- Sell: the 157.5 strike put option.
- Premium: 1.57
- Delta: -0.2753097284
- Buy: the 160.0 strike put option.
- Premium: 2.40
- Delta: -0.3819390841
This short-term trade captures a net premium of 0.83 with moderate deltas. These deltas show a reasonable likelihood that both options will expire out of the money, thereby minimizing assignment risk while providing a modest return.
- Medium-Term Option: June 21, 2024, with 38 days to expiration
- Sell: the 155.0 strike put option.
- Premium: 3.5
- Delta: -0.3044742573 (moderate delta, moderate assignment risk)
- Buy: the 160.0 strike put option.
- Premium: 5.3
- Delta: -0.4172579867
This spread offers a higher net premium of 1.8. The deltas are moderate, suggesting a reasonable expectation that both options will expire out of the money, balancing risk and reward effectively over an intermediate time frame.
- Long-Term Option: August 16, 2024, with 94 days to expiration
- Sell: the 160.0 strike put option.
- Premium: 7.9
- Delta: -0.4129604631 (indicating relatively high assignment risk but reasonable premium capture)
- Buy: the 165.0 strike put option.
- Premium: 10.6
- Delta: -0.4986808549
This vertical spread allows capturing a net premium of 2.7. Although deltas indicate the options are somewhat deep in the money, the extended timeline offers ample opportunity for the stock price to rise above the strike prices, thereby minimizing assignment risk over a longer period.
- Very Long-Term Option: January 16, 2026, with 612 days to expiration
- Sell: the 155.0 strike put option.
- Premium: 23.16
- Delta: -0.3239458839 (a good balance between delta and premium over a long horizon)
- Buy: the 160.0 strike put option.
- Premium: 20.96
- Delta: -0.3496478796
This extremely long-term spread results in a net premium of 2.2. The lower deltas in this longer term reflect an extended horizon for price movements, minimizing assignment risk and maximizing potential premium capture.
Each of these vertical bull put spreads offers various risk-reward profiles. The shorter-term options (choices 1 and 2) provide immediate, albeit riskier returns due to higher deltas. In contrast, the medium to very long-term strategies (choices 3, 4, and 5) provide substantial premiums with moderate delta values, striking a balance between assignment risk and premium capture over more extended periods. This diversified approach allows investors to align strategies with their risk tolerance and expected stock price performance within the specified time frames.
Vertical Bear Call Spread Option Strategy
To identify the most profitable vertical bear call spread options strategy for Lennar Corporation (LEN), we need to consider strategies where the short call is out of the money (with lower delta), and the long call is further above the target stock price. Our goal is to minimize the risk of having shares assigned while optimizing potential profit.
We will analyze five potential strategies across different expiration dates and strike prices, from near-term to long-term options, focusing on options with favorable Greeks and optimal risk to reward ratios.
1. Near-Term Strategy (Expiration: 2024-05-24) - Short Call: Strike 155.0 with a delta of 0.714, premium of $5.3, and ROI of 28.87%. - Long Call: Strike 160.0, premium of $5.2, and ROI of 30.70%.
This near-term strategy provides a moderate risk profile where the short call has a delta of 0.714, indicating a manageable probability that the option will expire in the money. By selecting a strike for the long call that is just above the target price, the spread captures the maximum premium while minimizing assignment risk.
2. Mid-Term Strategy (Expiration: 2024-07-19) - Short Call: Strike 150.0 with a delta of 0.725, premium of $17.4, and ROI of 49.60%. - Long Call: Strike 155.0, premium of $13.6, and ROI of 72.28%.
In this strategy, the short call delta of 0.725 reflects a balanced risk approach, with a higher premium collected. The long call at 155.0 serves as a buffer against significant upward stock movements, maximizing the spread return while maintaining a protective measure.
3. Longer-Term Strategy (Expiration: 2024-08-16) - Short Call: Strike 155.0 with a delta of 0.645, premium of $15.1, and ROI of 75.03%. - Long Call: Strike 160.0, premium of $12.2, and ROI of 100%.
This longer-term strategy reduces assignment risk with a delta of 0.645 for the short call. The premium for the long call ensures that any major upward movements are mitigated, offering a high ROI and sufficient protection with the selected spread.
4. Extended-Term Strategy (Expiration: 2025-01-17) - Short Call: Strike 150.0 with a delta of 0.681, premium of $26.8, and ROI of 67.28%. - Long Call: Strike 155.0, premium of $23.25, and ROI of 83.79%.
For an extended-term approach, this strategy effectively balances between premium collection and protection. The delta of 0.681 suggests a well-controlled risk of the short call expiring in the money. The ROI remains substantial, ensuring a robust profit margin.
5. Longest-Term Strategy (Expiration: 2025-12-19) - Short Call: Strike 150.0 with a delta of 0.681, premium of $26.8, and ROI of 71.39%. - Long Call: Strike 155.0, premium of $28.7, and ROI of 86.86%.
In this longest-term strategy, the delta of the short call remains consistently managed, with an appropriate buffer provided by the long call. The collected premiums and ROI indicate a high potential for profitability while keeping assignment risks at a minimum.
Conclusion:
Each of these strategies offers a unique balance of risk and reward. The selection of deltas around 0.645 to 0.725 for short calls across different expiration periods effectively minimizes the risk of having shares assigned. By choosing long calls just above the short call's strike prices, these strategies provide adequate protection against significant upward stock movements and ensure robust potential returns.
Vertical Bull Call Spread Option Strategy
A vertical bull call spread strategy involves buying a call option at a lower strike price and simultaneously selling a call option at a higher strike price. This strategy is designed to profit from a stock's moderate rise in price while limiting losses if the stock decreases or remains stagnant. When implementing this strategy, it is also important to consider option assignment risks, particularly when options are in the money, as this could result in the assignment of shares. To minimize this risk, you should choose strike prices that balance profitability and assignment likelihood, given the target stock price range of 2% over or under the current stock price.
Near-Term Options
- Expiration Date: 2024-05-24; Strike Prices: 155/160
- The first leg involves buying the call option with a strike price of 155, which has a delta of 0.714 and a gamma of 0.0239. This leg costs a premium of $8.9.
- The second leg involves selling the call option with a strike price of 160, which has a delta of 0.607 and a gamma of 0.0437. This leg yields a premium of $5.
- The net debit is $3.9, and since the delta values are reasonably high, the options are likely to follow the underlying stock price movements closely. This could be a good match for the expected price movement in the short term, considering that the higher strike delta is reasonably below 1, reducing assignment risks.
Mid-Term Options
- Expiration Date: 2024-06-21; Strike Prices: 150/155
- The first leg involving buying the call option with a strike price of 150 has a delta of 0.722 and a gamma of 0.0132, costing a premium of $16.15.
- The second leg involving selling the call option with a strike price of 155 has a delta of 0.652 and a gamma of 0.0152, yielding a premium of $11.9.
- The net debit is $4.25, and the positive spread between delta values indicates a moderately bullish outlook. The higher delta value ensures responsiveness to upside movement, while the premium minimizes cost outlays.
Long-Term Options
- Expiration Date: 2024-08-16; Strike Prices: 155/160
- The first leg involving buying the call option with a strike price of 155 has a delta of 0.645 and a gamma of 0.0123, costing a premium of $15.1.
- The second leg involving selling the call option with a strike price of 160 has a delta of 0.580 and a gamma of 0.0139, yielding a premium of $12.
- The net debit is $3.1, and the wider spread over the long term provides greater profits potential while keeping the delta values balanced to minimize steep delta risks and likelihood of early assignment.
Very Long-Term Options
- Expiration Date: 2025-01-17; Strike Prices: 160/165
- The first leg involving buying the call option with a strike price of 160 has a delta of 0.715 and a gamma of 0.0068, costing a premium of $24.
- The second leg involving selling the call option with a strike price of 165 has a delta of 0.581 and a gamma of 0.0067, yielding a premium of $20.65.
- The net debit is $3.35, offering a positive long-term profit expectation with minimized assignment risk due to steady delta values spread across both legs.
Ultra Long-Term Options
- Expiration Date: 2026-01-16; Strike Prices: 180/185
- The first leg involving buying the call option with a strike price of 180 has a delta of 0.536 and a gamma of 0.0052, costing a premium of $23.
- The second leg involving selling the call option with a strike price of 185 has a delta of 0.511 and a gamma of 0.0053, yielding a premium of $22.
- The net debit is $1, which is a nominal cost for a long-term position that aligns with the predicted moderate upward movement in stock price, reducing the probability of assignment thanks to lower delta values.
These options strategies account for varying expiration dates (from short-term to ultra long-term) and minimize the risk of share assignment by choosing delta values that are balanced yet optimistic, maximizing profit potential within a 2% target price range over or under the stocks current price.
Similar Companies in Residential Construction:
PulteGroup, Inc. (PHM), KB Home (KBH), NVR, Inc. (NVR), Toll Brothers, Inc. (TOL), D.R. Horton, Inc. (DHI), Beazer Homes USA, Inc. (BZH), Hovnanian Enterprises, Inc. (HOV), Meritage Homes Corporation (MTH), Installed Building Products, Inc. (IBP)
https://www.youtube.com/watch?v=zxVPfo82hEA
https://www.youtube.com/watch?v=g3w5xLy3iB8
https://www.fool.com/investing/2024/04/07/1-ridiculously-cheap-warren-buffett-stock-to-buy-h/
https://www.youtube.com/watch?v=9SHuZJj2UtA
https://www.fool.com/investing/2024/04/27/3-top-warren-buffett-stocks-buy-bull-market/
https://finance.yahoo.com/news/lennar-nyse-len-doing-things-124110481.html
https://finance.yahoo.com/news/14-best-housing-stocks-buy-153400870.html
https://finance.yahoo.com/news/wall-street-analysts-see-upside-163607550.html
https://finance.yahoo.com/news/lennar-len-stock-moves-1-220003256.html
https://finance.yahoo.com/news/q1-2024-louisiana-pacific-corp-065948758.html
https://finance.yahoo.com/news/invest-lennar-len-based-bullish-133011691.html
https://finance.yahoo.com/news/zelman-associates-adjusts-price-target-120722894.html
https://finance.yahoo.com/news/25-cities-highest-housing-costs-161110209.html
https://www.sec.gov/Archives/edgar/data/920760/000162828024013820/len-20240229.htm
Copyright © 2024 Tiny Computers (email@tinycomputers.io)
Report ID: xDojCQ
Cost: $1.29264
https://reports.tinycomputers.io/LEN/LEN-2024-05-13.html Home