Lam Research Corporation (ticker: LRCX)
2024-01-27
 Lam Research Corporation (NASDAQ: LRCX) is a prominent global supplier of wafer fabrication equipment and services to the semiconductor industry. With headquarters in Fremont, California, Lam Research designs, manufactures, and services semiconductor processing equipment used in the fabrication of integrated circuits. The company is reputed for its expertise in etch and single-wafer clean systems, which are critical in the multiple stages of the chip-making process, especially as semiconductor devices become more advanced and complex. The company's product portfolio is essential for clients who are involved in the production of a wide array of semiconductor devices. Its position in the market is marked by a robust focus on technological innovation and customer collaboration, which enables it to align with the rapidly evolving technology demands. As of the knowledge cutoff in 2023, Lam Research remains a key player in the semiconductor equipment industry, showcasing sustained financial performance and strong demand for its products as the need for semiconductor devices continues to grow across various sectors, including computing, mobile, automotive, and the Internet of Things (IoT).
| Full Time Employees | 17,200 | Previous Close | 865.6 | Open | 853.0 |
| Day Low | 836.63 | Day High | 860.0 | Dividend Rate | 8.0 |
| Dividend Yield | 0.92% | Payout Ratio | 28.73% | Five Year Avg Dividend Yield | 1.36% |
| Beta | 1.548 | Trailing PE | 32.40788 | Forward PE | 23.681625 |
| Volume | 1,671,210 | Average Volume | 1,002,104 | Average Volume 10 Days | 1,348,790 |
| Market Cap | 110,147,493,888 | 52 Week Low | 467.03 | 52 Week High | 900.09 |
| Price to Sales Trailing 12 Months | 7.6933966 | 50 Day Average | 748.5458 | 200 Day Average | 649.9092 |
| Trailing Annual Dividend Rate | 7.45 | Trailing Annual Dividend Yield | 0.8606747% | Enterprise Value | 112,980,008,960 |
| Profit Margins | 24.154% | Float Shares | 130,768,641 | Shares Outstanding | 131,278,000 |
| Shares Short | 2,805,199 | Held Percent Insiders | 0.269% | Held Percent Institutions | 89.176% |
| Short Ratio | 3.05 | Short Percent of Float | 2.14% | Book Value | 62.634 |
| Price to Book | 13.395919 | Last Fiscal Year End | Mar 25, 2023 | Earnings Quarterly Growth | -35.0% |
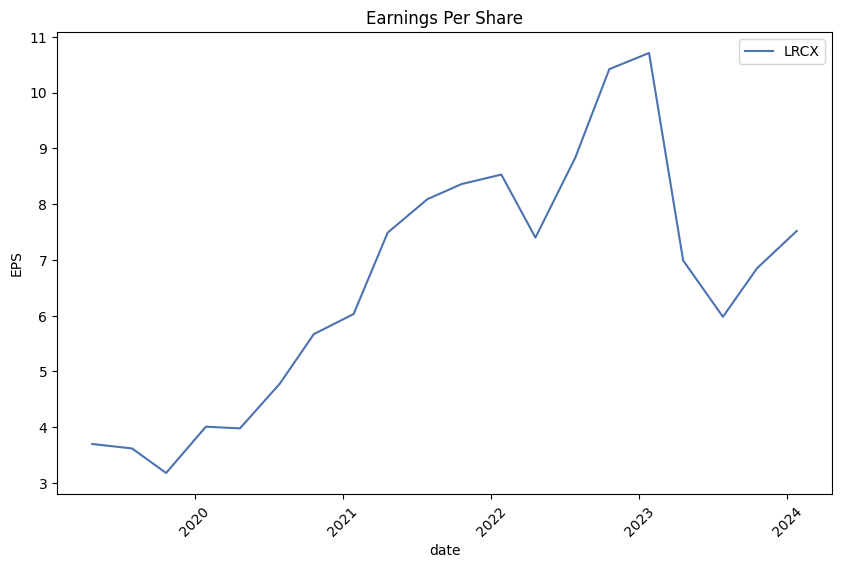
| Net Income To Common | 3,458,209,024 | Trailing EPS | 25.89 | Forward EPS | 35.43 |
| Peg Ratio | 3.94 | Last Split Factor | 3:1 | Enterprise To Revenue | 7.891 |
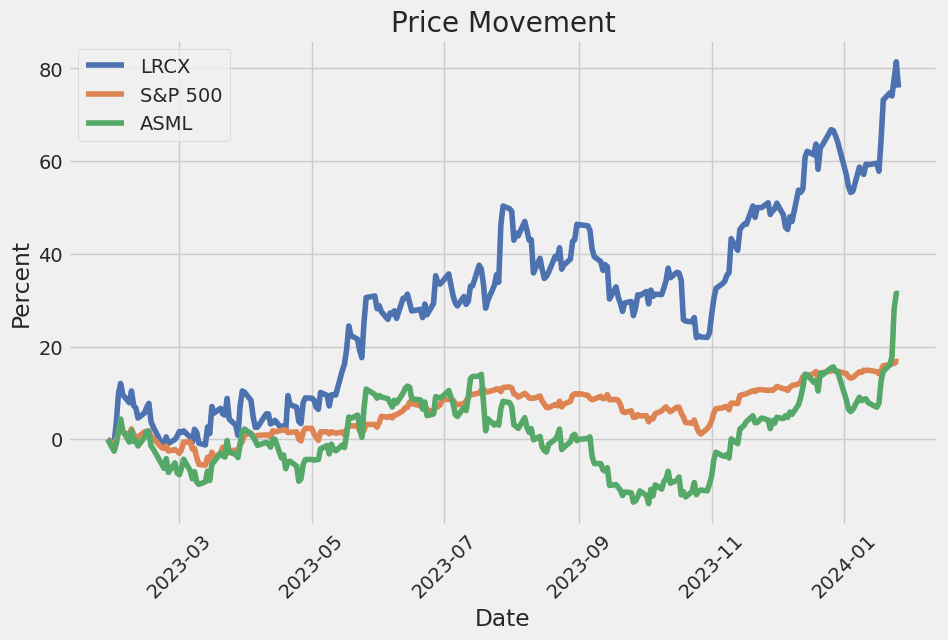
| Enterprise To EBITDA | 25.755 | 52 Week Change | 79.257786% | S&P 52 Week Change | 21.733451% |
| Total Cash | 5,638,008,832 | Total Cash Per Share | 42.947 | EBITDA | 4,386,707,968 |
| Total Debt | 4,983,783,936 | Quick Ratio | 1.953 | Current Ratio | 3.056 |
| Total Revenue | 14,317,147,136 | Debt To Equity | 60.612 | Revenue Per Share | 107.407 |
| Return On Assets | 13.239999% | Return On Equity | 41.849% | Free Cashflow | 4,083,531,264 |
| Operating Cashflow | 5,254,166,016 | Earnings Growth | -33.0% | Revenue Growth | -28.8% |
| Gross Margins | 45.938% | EBITDA Margins | 30.64% | Operating Margins | 29.236% |
| Sharpe Ratio | -9.912311699879476 | Sortino Ratio | -190.90575290796207 |
| Treynor Ratio | 0.3773230000619488 | Calmar Ratio | 4.037417329732515 |
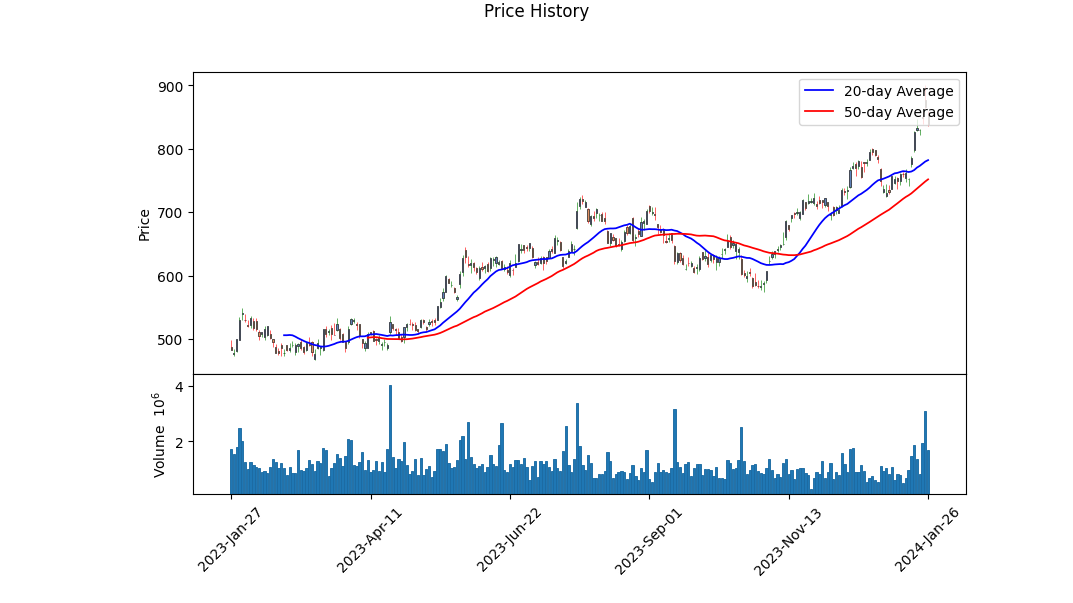
The technical analysis and financial data for LRCX (Lam Research Corporation) illuminates a nuanced picture of the stock's potential price movement in the coming months. Notably, the stock has exhibited a marked uptrend in its price as denoted by the increasing stock price from approximately $636.50 to $853 in the data provided. The positive gradient in the On-Balance Volume (OBV) indicator corroborates the price uptrend, suggesting a healthy accumulation of the stock. Moreover, a rising Moving Average Convergence Divergence (MACD) histogram towards the latest data points indicates that the momentum might be bullish.
However, it is imperative to contrast these optimistic signals with the concerning risk-adjusted return ratios. The Sharpe Ratio, at -9.91, and the Sortino Ratio, at -190.91, indicate poor risk-adjusted returns, which could signal high volatility or an extended period of below-average returns compared to the risk-free rate. Conversely, the Treynor Ratio at 0.38 is mildly positive, and an elevated Calmar Ratio at 4.04 suggests the stock may provide reasonable returns in relation to its maximum drawdown.
Fundamentally, LRCX showcases robust margins, with both gross and operating margins (45.9% and 29.2% respectively) above industry averages. These figures underscore the company's efficient operations and ability to translate revenue into profit. An impressive EBITDA of over $5.6 billion and a healthy operating income are positive indicators of the company's profitability and overall financial health.
The balance sheet mirrors this sentiment with a considerable working capital reserve, signaling the company's ability to cover short-term obligations. Additionally, a substantial cash on hand further attests to a sound liquidity position. For a tech company like LRCX, a high Altman Z-score of 10.47 and a Piotroski Score of 8 manifest a very low bankruptcy risk and sturdy financial situation.
Earnings and revenue estimates for the upcoming year exhibit optimism among analysts, with positive growth estimates featuring a next-year increase of 23.2%. Growth estimates also incur a positive projection of 7.64% annualized over the next five years.
In conclusion, despite the unflattering risk-adjusted return ratios, the robust fundamentals, strong technical indicators, and positive analyst outlook paint an overarching constructive picture for LRCX. The positive uptrend identified through technical analysis, allied with strong financials and forward-looking growth projections, suggests a favorable outlook for the stock price over the next few months. However, as with any equity, market conditions, sector performance, and broader economic factors could influence actual price movements, and this projection should be juxtaposed with real-time market analysis and economic development.
| Statistic Name | Statistic Value |
| R-squared | 0.545 |
| Adj. R-squared | 0.544 |
| F-statistic | 1,503 |
| Prob (F-statistic) | 6.48e-217 |
| Log-Likelihood | -2,659.4 |
| AIC | 5,323 |
| BIC | 5,333 |
| Const Coef | 0.0742 |
| Const P>|t| | 0.190 |
| 0 Coef | 1.6661 |
| 0 P>|t| | 0.000 |
| Skew | 0.235 |
| Kurtosis | 6.878 |
| Cond. No. | 1.32 |
| Alpha | 0.0742 |
| Beta | 1.6661 |
An analysis of the linear regression model between LRCX (Lam Research Corporation) stock prices and SPY (SPDR S&P 500 ETF Trust) representing the market benchmark shows a beta of 1.6661, indicating that LRCX is more volatile than the market. This suggests that for every percent change in the market, we would expect LRCX to change by approximately 1.6661 percent in the same direction. The alpha of the model is 0.0742, which is a measure of the stock's return independent of the market's performance. The alpha value indicates that LRCX has a slight positive performance against the market; however, the statistical significance is not strong (p-value of 0.190), suggesting that the alpha might be due to chance rather than a consistent return above the market.
The model has an R-squared value of 0.545, indicating that approximately 54.5% of the variability in LRCX's returns can be explained by the returns of SPY. An F-statistic of 1503 with a near-zero probability suggests that the model is statistically highly significant. A look at other diagnostic statistics shows a skew of 0.235 and a kurtosis of 6.878, pointing to a moderate asymmetry and heavy tails in the residual distribution, which might imply non-normality in the residuals. Notably, the beta coefficient is highly significant with a p-value of virtually 0, signifying a very strong linear relationship between LRCX and SPY for the time period analyzed.
Lam Research Corporation Earnings Call Summary December 2023 Quarterly Results
In their quarterly earnings call for December 2023, Lam Research Corporation reported strong performance with revenues, gross margin, operating margin, and EPS all exceeding the midpoint of their guided ranges. The company managed to nearly double their EPS compared to the previous cycle trough in 2019, driven by improved positioning in the foundry, logic, and specialty technology segments, a 90,000 chambers-strong installed base with customer support business group (CSBG) revenue growing by over 80% since 2019, and enhanced cost management and operational efficiency. Wafer fabrication equipment (WFE) spending for the year was estimated at the low $80 billion range, with a slight year-on-year uptick attributable to strength in domestic China spending, though overall memory WFE fell nearly 40%. Lam foresees a modest recovery in memory spending leading to a stronger end to the year. The early view for 2024 WFE is in the mid- to high $80 billion range, with growth expected in DRAM due to node conversions and technology upgrades in NAND and Foundry/Logic segments.
Lam highlighted their strategic actions and commitment to R&D, despite the recent spending challenges. The rise in semiconductor complexity and revenues expected to hit $1 trillion by the decade's end suggests WFE will need to double from current levels. The company's focus is on expansion opportunities across memory, foundry, logic, advanced packaging, and specialty technologies. Lam has made significant progress in gate-all-around, backside power delivery, advanced packaging, and dry EUV patterning, securing wins and expecting a tripling of DRAM and packaging shipments year-on-year. Developments in pulse laser deposition technology have also opened up new markets for the company.
The call also covered financial aspects. In 2023, Lam generated $14.3 billion in revenue, and diluted earnings per share reached $27.33. Systems revenue for memory was 48% in the December quarter, with DRAM at a record 31%. Foundry represented 38% of the systems revenue. China accounted for 40% of total revenue, with expectations to remain stable through 2024. The CSBG generated nearly $1.5 billion in revenue, demonstrating a steady business despite low fab utilization rates. The gross margin was at 47.6% for the quarter. As for operating expenses, research and development (R&D) costs increased to over 69% of total expenses in support of technology differentiation.
On the capital return side, Lam allocated roughly $640 million to share repurchases and paid $264 million in dividends for the quarter. Regarding the non-GAAP guidance for the March 2024 quarter, Lam expects revenue of $3.7 billion, plus or minus $300 million with a gross margin of around 48%, operating margins close to 29.5%, and earnings per share of $7.25, plus or minus $0.75, based on approximately 132 million shares.
Throughout the earnings call, it was noted that Lam has managed operations well across past semiconductor cycles. The current strategy includes cost-effective improvements and enhancements to profitability and market position in anticipation of the next growth phase in WFE. Lam is positioning itself to capitalize on long-term semiconductor growth through strategic global infrastructure and a differentiated technology portfolio.
Lam Research Corporation is a global supplier of innovative wafer fabrication equipment and services to the semiconductor industry, relying on their presence in multiple countries and a wide range of operational competencies to deliver sophisticated and high-performance devices. In their most recent quarterly report for the period ending September 24, 2023, Lam Research demonstrated both strengths and potential challenges that are reflective of the semiconductor industry's cyclical nature and sensitivity to global economic conditions.
For the quarter ending September 24, 2023, revenue rose to $3.482 billion, showing a 9% increase from the previous quarter which ended June 25, 2023. This upturn was attributed to heightened investments in the DRAM segment and increased expenditure from Chinese customers on mature node equipment. A significant portion of this revenue, 48%, came from China, with other key contributions from Korea, Japan, the United States, Taiwan, Europe, and Southeast Asia.
The company's strategy appears to be influenced by market demand and reflected through its restructuring plan announced earlier in January 2023 and the continued investment in Research and Development (R&D). The plan focused on workforce reduction and other cost alignment measures, reflecting the industry's downturn and the uncertainty surrounding future business opportunities. The restructuring resulted in approximately $9.961 million in net charges for the quarter. Despite these measures, gross margin increased both quarterly and year-over-year, standing at 47.5% of total revenue, up from 45.5% in the previous quarter and surpassing the 46.1% during the same period in the prior year. This was mainly due to favorable customer mix and reduced spending on material costs, among other factors.
Operating expenses showed an increase, totaling $631.673 million, primarily due to rises in employee-related costs and other expenditures. Yet, Lam Research managed to achieve a net income of $887.398 million with a diluted net income per share of $6.66. The results speak to the delicate balance the company maintains between operational expenses and investments in innovation against the backdrop of shifting customer demands and market conditions.
The company's liquidity and capital resources critically depend on international sales, with direct exposure to fluctuations in foreign currency exchange rates and potential regulatory changes, especially considering the substantial contributions from global sales to total revenue. Cash balances decreased to $5.126 billion at the end of September 24, 2023, from $5.337 billion as of June 25, 2023, partly due to the repurchase of shares worth $843.238 million and dividend payments amounting to $230.332 million. Nevertheless, the cash flow from operations remained robust, signaling operational efficiency and a strong market position.
Overall, Lam Research's 10-Q filing for the quarter ending September 24, 2023, presents a company proactively managing the challenges of a volatile marketplace while steering towards growth through strategic investments in its core competencies of deposition, etch, and clean technologies critical to semiconductor device manufacturing. Though facing industry-specific and macroeconomic uncertainties, the company's financial discipline, international market penetration, and commitment to innovation suggest resilience and potential for prolonged success in the rapidly evolving sector.
Lam Research Corporation is cementing its position as a leader in the semiconductor industry amid projections of an upturn in memory chip sales and technological advancements leading to a recoverable demand for wafer fabrication equipment (WFE). The company's tie with Micron Technology, as one of its prime customers, alongside its significant role in the "fab five," places it at the center of anticipated industry growth. As one of the key suppliers to memory chip manufacturers, Lam Research has seen customer representation in its revenue peak to two-thirds in early 2022 before facing a downturn.
However, as memory chip sales are experiencing resurgence, as indicated by Micron's sales growth from $4 billion to $4.73 billion in November 2023 and projected increase to $5.3 billion by February 2024, optimism surrounds Lam Research's rebound potential. This anticipation is further emphasized by Micron's expansion plans in Idaho and New York, suggesting impending equipment procurements that could benefit Lam Research. Moreover, Lam's ability to diversify, focusing on equipment for logic chips and third-party foundries, as well as customer support-related revenue, highlights the versatility and strategic foresight of its business model.
Despite experiencing stock price nuances, including a noteworthy nearly 90% rally in 2023 and occasional declines amid broader market gains or losses, Lam Research consistently showcased adaptability. Even with projections of earnings and revenue decline for the fiscal year 2024, the company's forward-thinking approach, including the focus on technological innovation, hints at sustained profitability and long-term growth.
Indeed, the semiconductor equipment market is currently undergoing competitive and technological shifts. With Lam Research's industry sector, Semiconductor Equipment - Wafer Fabrication, ranking highly within the Zacks Industry Rank metrics, it indicates a healthy and promising sector outlook.
Leadership at Lam Research, under CEO Tim Archer's direction, has been pivotal. Despite substantial financial loss disclosures, the company's strategic measures, strong positions in sectors like artificial intelligence and high-bandwidth memory, and investor trust reflected in raised price targets point towards a vibrant company trajectory.
Earnings calls and reports further solidify Lam Research's market standing. For the quarter ending December 2023, the company reported revenues of $3.76 billion, with the Customer Support Business Group demonstrating significant growth. Sequentially, there was an 8% increase from the prior quarter, and despite a year-over-year revenue decrease, operational efficiencies have led to higher-than-past trough period margins.
Looking ahead, Lam Research projects WFE spending will fall into the mid-high $80 billion range for fiscal year 2024, garnering benefits from a recovery in memory spending and technological advancements. The company's dedication to R&D, expansion into new markets, and operational enhancements, such as investments in manufacturing locations and workforce optimization, position it well for the future.
Within such a dynamic market, positive outcomes like the increase in stock value post-earnings announcements and strong performance against major indices underscore the confidence investors have in Lam Research. The company's capability to exceed analysts' expectations amid an uncertain environment preserves its appeal to the investment community.
As the semiconductor industry envisages a larger role within the global economy, reaching around $1 trillion by the decade's end, Lam Research's strategic planning, innovations, and financial health indicate its prime readiness to navigate this growth. Despite the challenges inherent to the semiconductor market, the company's continuous outperformance in earnings estimates and its execution of strategic initiatives render it a formidable force within the industry.
Over the specified period from January 28, 2019, to January 26, 2024, the volatility of Lam Research Corporation (LRCX) has been modeled using an ARCH process, which explicitly captures the size of asset return fluctuations over time. The statistical significance of the coefficients in the ARCH model, such as a high t-statistic for the omega coefficient, suggests that there are sizable and reliable effects influencing the observed volatility. Key features illustrating the volatility include the omega coefficient, reflecting the baseline level of variance and the alpha coefficient, indicating the impact of past squared returns on the future volatility.
Here is the requested HTML table for the ARCH model statistics:
| Statistic Name | Statistic Value |
|---|---|
| Log-Likelihood | -3115.89 |
| AIC | 6235.79 |
| BIC | 6246.06 |
| No. Observations | 1,258 |
| omega | 6.8309 |
| alpha[1] | 0.2292 |
To analyze the financial risk of investing $10,000 in Lam Research Corporation (LRCX) over a one-year period, a combination of volatility modeling and machine learning predictions can be applied. Volatility modeling, often used in financial econometrics to understand the variance in returns of a stock, captures the conditional variance of a time series dynamic, such as stock prices. By estimating the magnitude of future potential price movements, this model can assist investors in anticipating the range within which the price of Lam Research Corporation's stock is likely to fluctuate.
In addition to volatility modeling, machine learning predictions can be incorporated to forecast future returns. These techniques analyze historical data and discover patterns that may forecast future price movements. For instance, a machine learning model such as a decision tree-based regression approach would learn from past price data and the features associated with it, generating predictions for the future direction of the stock price.
When combined, these methodologies strengthen the analysis by providing two views: volatility modeling informs about the range of price movements (the risk), while machine learning predictions provide insights into the expected direction of price movements (the return).
An essential metric derived from these methods is the Value at Risk (VaR), which quantifies the maximum expected loss over a specific time frame given normal market conditions at a certain confidence level. In the context of this analysis, the calculated Value at Risk (VaR) at a 95% confidence interval for a $10,000 investment in LRCX is $348.00. This implies that there is a 5% chance that the investment will lose more than $348 in value over a one-year period due to normal market fluctuations. It is a helpful measure that provides an investor with an empirical basis to assess the potential risk associated with the stock for portfolio management and risk assessment purposes.
Through this integrated approach, combining the predictive power of machine learning with the risk estimation capabilities of volatility models, investors can better understand and prepare for the possible ups and downs their investment might face in the future, making for a more informed investment strategy.
Similar Companies in Semiconductor Equipment & Materials:
ASML Holding N.V. (ASML), KLA Corporation (KLAC), Axcelis Technologies, Inc. (ACLS), Teradyne, Inc. (TER), Applied Materials, Inc. (AMAT), Aehr Test Systems (AEHR), Photronics, Inc. (PLAB), Kulicke and Soffa Industries, Inc. (KLIC), Entegris, Inc. (ENTG), IPG Photonics Corporation (IPGP), Tokyo Electron Limited (TOELY), Advanced Energy Industries, Inc. (AEIS)
https://www.fool.com/investing/2023/12/25/1-top-chip-stock-that-could-soar-in-2024/
https://seekingalpha.com/article/4661141-semiconductors-winners-losers-start-of-2024
https://www.zacks.com/stock/news/2207829/why-lam-research-lrcx-dipped-more-than-broader-market-today
https://www.zacks.com/stock/news/2211111/lam-research-lrcx-rises-as-market-takes-a-dip-key-facts
https://www.youtube.com/watch?v=bis_kFM63Lo
https://finance.yahoo.com/news/lam-research-corporation-nasdaq-lrcx-154911739.html
https://finance.yahoo.com/news/why-lam-research-lrcx-stock-155420370.html
https://www.sec.gov/Archives/edgar/data/707549/000070754923000115/lrcx-20230924.htm
Copyright © 2024 Tiny Computers (email@tinycomputers.io)
Report ID: JIawE5
Cost: $0.99518
https://reports.tinycomputers.io/LRCX/LRCX-2024-01-27.html Home