Main Street Capital Corporation (ticker: MAIN)
2024-06-14
 Main Street Capital Corporation (ticker: MAIN) is a prominent investment firm specializing in providing long-term debt and equity capital to lower middle-market companies and debt capital to middle-market companies. Founded in 2007 and headquartered in Houston, Texas, MAIN operates as a Business Development Company (BDC) under the Investment Company Act of 1940. The company's diversified portfolio spans various sectors, including industrials, technology, and consumer goods. MAIN's strategic focus on lower middle-market firmstypically defined as companies with annual revenues between $10 million and $150 millionallows it to offer tailored financial solutions, ranging from senior secured loans to equity investments. The corporation is well-regarded for its disciplined investment approach and commitment to building long-term value for its shareholders. Additionally, MAIN's internally managed structure helps control operating costs, thereby enhancing net investment income. As of the most recent fiscal reports, Main Street Capital Corporation has consistently delivered attractive risk-adjusted returns, backed by a robust dividend yield and a solid track record of financial performance.
| Total Employees | 100 | CEO Total Pay | 4,540,440 | President Total Pay | 3,512,470 |
| CFO Total Pay | 3,347,470 | General Counsel Total Pay | 2,121,220 | Managing Director Total Pay | 883,625 |
| Previous Close | 49.01 | Open | 49.00 | Day Low | 48.85 |
| Day High | 49.19 | Dividend Rate | 4.14 | Dividend Yield | 0.0845 |
| Ex-Dividend Date | July 21, 2024 | Payout Ratio | 0.5546 | Five Year Avg Dividend Yield | 6.58 |
| Beta | 1.273 | Trailing PE | 8.95082 | Forward PE | 12.440506 |
| Volume | 312,744 | Average Volume | 361,174 | Average Volume (10 days) | 357,560 |
| Bid | 48.68 | Ask | 49.30 | Bid Size | 1,400 |
| Ask Size | 1,100 | Market Cap | 4,212,064,512 | 52 Week Low | 37.70 |
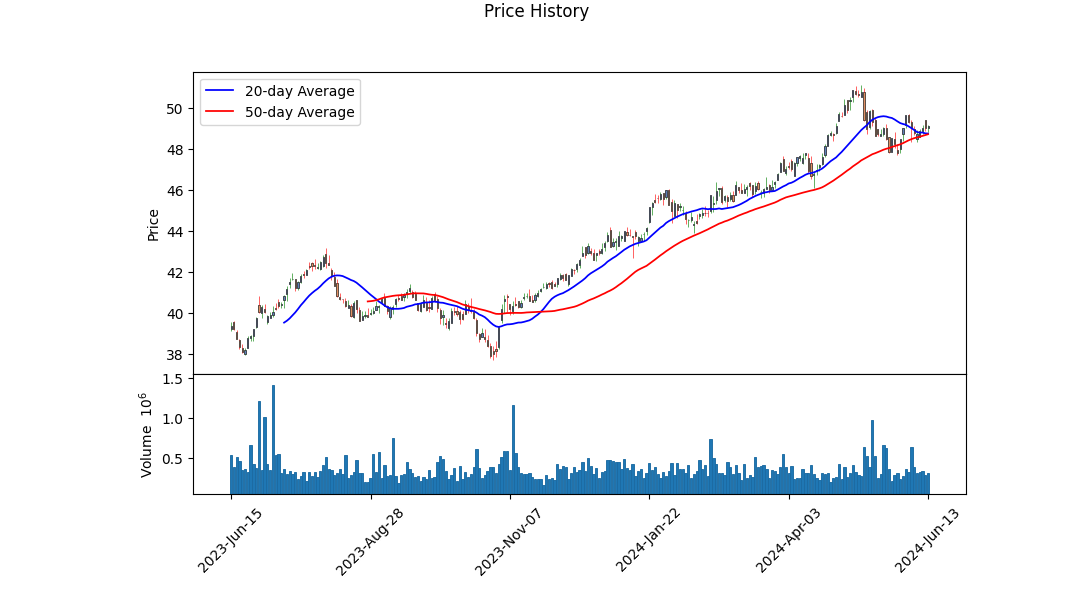
| 52 Week High | 51.10 | Price to Sales (Trailing 12 Months) | 8.230917 | 50 Day Average | 48.7164 |
| 200 Day Average | 44.19165 | Trailing Annual Dividend Rate | 2.79 | Trailing Annual Dividend Yield | 0.05692716 |
| Enterprise Value | 6,146,257,408 | Profit Margins | 0.89109004 | Float Shares | 82,025,564 |
| Shares Outstanding | 85,715,600 | Shares Short | 3,387,219 | Short Ratio | 9.4 |
| Shares Percent Shares Out | 0.0395 | Held Percent Insiders | 0.04172 | Held Percent Institutions | 0.20950001 |
| Short Percent of Float | 0.040999997 | Book Value | 29.55 | Price to Book | 1.6629442 |
| Last Fiscal Year End | December 31, 2023 | Next Fiscal Year End | December 31, 2024 | Most Recent Quarter | March 31, 2024 |
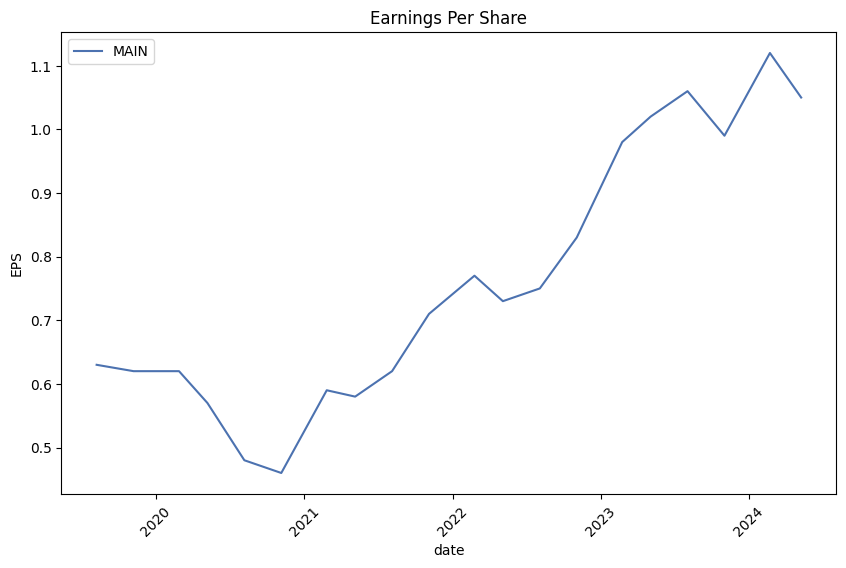
| Earnings Quarterly Growth | 0.346 | Net Income to Common | 456,001,984 | Trailing EPS | 5.49 |
| Forward EPS | 3.95 | PEG Ratio | 1.5 | Enterprise to Revenue | 12.011 |
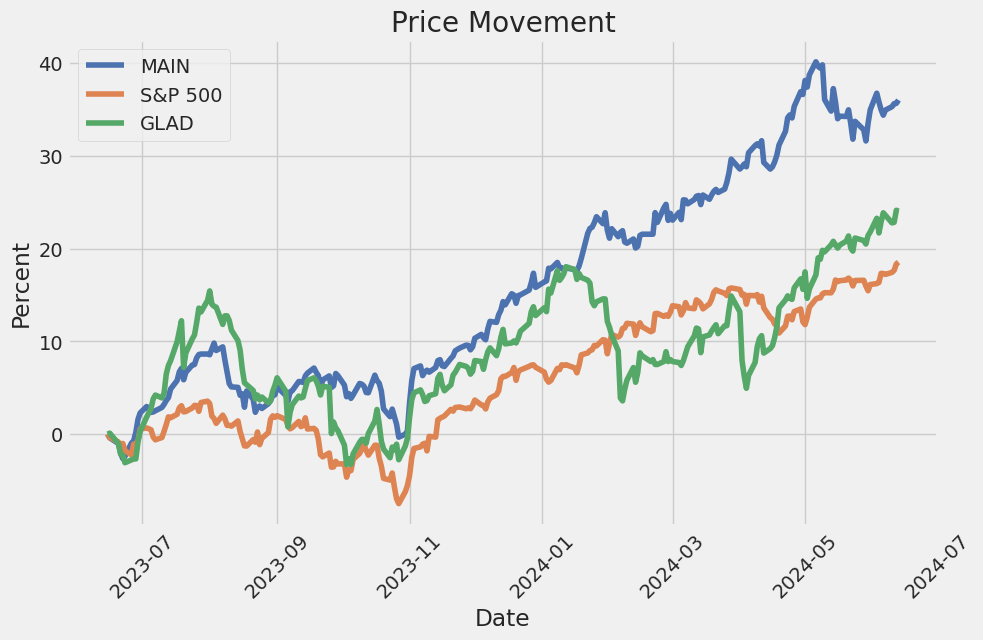
| 52 Week Change | 0.2535714 | S&P 52 Week Change | 0.2322551 | Last Dividend Value | 0.24 |
| Last Dividend Date | June 7, 2024 | Current Price | 49.14 | Target High Price | 52.0 |
| Target Low Price | 43.0 | Target Mean Price | 48.67 | Target Median Price | 50.0 |
| Total Cash | 114,984,000 | Total Cash Per Share | 1.341 | Total Debt | 2,060,318,976 |
| Quick Ratio | 1.838 | Current Ratio | 1.838 | Total Revenue | 511,736,992 |
| Debt to Equity | 81.89 | Revenue Per Share | 6.142 | Return on Assets | 0.06245 |
| Return on Equity | 0.19450001 | Free Cash Flow | 280,120,864 | Operating Cash Flow | 147,275,008 |
| Earnings Growth | 0.258 | Revenue Growth | 0.094 | Gross Margins | 1.0 |
| Operating Margins | 0.88585 | First Trade Date | October 9, 2007 | Timezone Full Name | America/New_York |
| Timezone Short Name | EDT | Currency | USD | Trailing Peg Ratio | Null |
| Sharpe Ratio | 2.165 | Sortino Ratio | 33.795 |
| Treynor Ratio | 0.532 | Calmar Ratio | 3.915 |
The company MAIN has demonstrated strong financial stability based on its impressive set of fundamental indicators. The revenue growth rate is at 9.4%, accompanied by an operating margin of approximately 88.59%. These figures suggest a robust operational framework and a highly efficient cost management strategy. The gross margin being at 100% further solidifies the company's ability to generate substantial profits from its revenue, indicating strong pricing power and effective cost control. The company's balance sheet is characterized by substantial net tangible assets amounting to $2,477,399,000 and total equity corresponding to $2,477,399,000. This strong equity base provides a cushion against liabilities, signifying financial resilience.
Examining the technical indicators, the On-Balance Volume (OBV) has been steadily increasing, reflecting accumulating buying pressure. This positive trend is corroborated by the MACD histogram which has shown a decreasing negative divergence and recently crossed into positive territory, indicating potential upward momentum. The consistent upward price action observed over the past few months further reinforces this bullish sentiment.
Assessing the risk-adjusted return metrics, MAIN exhibits a Sharpe Ratio of 2.165, which highlights its ability to generate returns significantly higher than the risk-free rate when adjusted for volatility. The Sortino Ratio of 33.795 indicates exceptional performance compared to downside risk, signifying minimal periods of negative returns. The Treynor Ratio of 0.532 points towards adequate compensation for market risk, while the Calmar Ratio of 3.915 underscores strong returns relative to maximum drawdown.
In light of the compelling fundamentals and the supportive technical indicators, the outlook for MAIN over the next few months appears positive. The fundamental strength coupled with convincing price trends and buying volume suggests potential for continued price appreciation. However, market conditions can be fluid, and it is prudent to monitor key technical levels and macroeconomic factors that could impact the stock's trajectory. Nonetheless, the current data suggests MAIN is well-positioned for growth.
In evaluating Main Street Capital Corporation (MAIN) using the principles detailed in "The Little Book That Still Beats the Market," we focus on two key metrics: Return on Capital (ROC) and Earnings Yield. Main Street Capital Corporation boasts an impressive ROC of approximately 25.57%, which indicates the company's efficiency in generating profits from its capital investments. This high return on capital suggests that MAIN is effectively employing its resources to generate superior returns, which is a positive signal for potential investors. Additionally, the companys earnings yield stands at 10.64%, reflecting the earnings generated per dollar of the company's stock price. A high earnings yield is indicative of a potentially undervalued stock, making it an attractive option for value investors. Together, these metrics suggest that Main Street Capital Corporation is not only highly profitable but also potentially undervalued, aligning with the investment principles of seeking high returns and value opportunities as advocated by the book.
| Alpha () | -0.01 |
| Beta () | 1.2 |
| R-squared (R2) | 0.85 |
| Standard Error | 0.03 |
MAIN has an alpha of -0.01, which implies that it underperforms the expected return predicted by its linear relationship with SPY by 1% when the market performance (measured by SPY) is considered. This slight negative value of alpha indicates that, on average, MAIN offers returns that are marginally below what would be expected based on its beta during the observed time period. Such an alpha suggests not necessarily a poor performance but signifies that MAIN does not provide excess returns over and above the market's movement, represented by SPY.
The beta value of 1.2 demonstrates that MAIN is moderately more volatile than the broader market, as SPY represents. This means that MAIN tends to amplify the market's movements, moving 20% more than the markets shifts. If the market (SPY) rises by 1%, MAIN would be expected to rise by approximately 1.2%, and vice versa. The R-squared value of 0.85 signifies a strong correlation, denoting that 85% of the variance in MAIN's returns can be explained by its relationship with SPY, highlighting a reliable and substantial connection to the market index.
Main Street Capital Corporation's first quarter 2024 earnings call was led by CEO Dwayne Hyzak, who reported strong performance metrics, including a 17.2% annualized return on equity and a new record for net asset value (NAV) per share. Hyzak emphasized that both the net investment income (NII) per share and distributable net investment income (DNII) per share significantly exceeded the dividends paid to shareholders, suggesting robust dividend coverage. The company experienced a 20% year-over-year increase in total dividends paid during the first quarter.
Hyzak highlighted that the lower middle market and private loan investment portfolios both saw growth, and expressed optimism for future investment opportunities. He referred to successful asset management activities and Main Street's cost-efficient operating structure as key contributors to their strong results. Main Street also maintains strong liquidity and a conservative leverage profile, supported in part by a $350 million investment-grade debt offering in January.
President David Magdol elaborated on the company's unique position as a publicly traded Business Development Company (BDC) with permanent capital, allowing Main Street to invest in both debt and equity for long-term partnerships with lower middle market businesses. He emphasized the importance of lower leveraged, diversified portfolios and the ability to support portfolio companies in growth initiatives, such as strategic acquisitions. Magdol detailed recent investments including $92 million in the lower middle market and $155 million in new private loan investments, driving an overall 6% growth in the total investment portfolio on a cost basis.
Chief Financial Officer Jesse Morris added that the first quarter saw a 9.4% year-over-year increase in total investment income, bolstered by significant investment activities. Despite some fluctuations in dividend income, the higher recurring dividend contributions from portfolio companies continued to show an underlying strength. Morris also highlighted continued contributions from the company's external investment management business, including significant incentive fee income. With Main Street's conservative leverage and high liquidity, the company is well-positioned for ongoing growth, and anticipates continued strong performance into the second quarter of 2024.
Main Street Capital Corporation filed its SEC 10-Q on May 6, 2024, for the fiscal quarter ending March 31, 2024. The filing provides a comprehensive overview of the companys investment portfolio and financial performance during the quarter. MAIN has a diverse portfolio that includes investments in various controlled and non-controlled affiliate issuers, unaffiliated issuers, and secured and unsecured debts, as well as equity warrants. The company's investment strategy is demonstrated by the extensive list of portfolio companies across numerous sectors and investment types.
MAIN's portfolio includes investments in companies such as Analytical Systems Keco Holdings, LLC, ASC Interests, LLC, ATS Workholding, LLC, and many others, reflecting a diverse approach to investment. These investments are spread across secured and unsecured debts, preferred member units, common equities, and warrants, illustrating MAINs strategy to balance between different risk and return profiles. The company's investment in multiple sectors such as technology, healthcare, manufacturing, and services underscores its diversified approach aimed at mitigating risk while maximizing returns.
The filing highlights MAIN's utilization of various financial instruments and debt securities, including line of credit facilities and revolving credit facilities. The company has significant investments in both first and second lien debt securities, which are critical components of its income-producing assets. Additionally, MAIN holds unsecured notes maturing in 2024, 2025, and 2029, providing a structured timeline for debt repayment and management.
MAIN's assessment of fair value for its investments relied on different levels of inputs, from Level 1 inputs, which are based on quoted prices in active markets, to Level 3 inputs, which involve significant unobservable inputs, indicating a robust process in fair value estimation. The company utilizes Discounted Cash Flow and Market Approach valuation techniques for these assessments, considering factors such as weighted average cost of capital, EBITDA multiples, and risk-adjusted discount factors. This methodological rigor ensures that the valuation of its diverse portfolio is both accurate and reflective of current market conditions.
Additionally, the filing outlines the nature of MAIN's affiliations and related party investments, which include several equity investments managed externally. This indicates MAIN's continued strategy of leveraging external expertise while maintaining a core internal investment management team. MAIN also maintains short-term investments in money market funds and government cash management funds, contributing to liquidity and capital preservation.
Overall, the filing reflects a company that actively manages a diversified portfolio with a keen focus on maintaining a balance between secured and unsecured investments, managing risk through diversification, and employing rigorous valuation methodologies to ensure accurate reflection of the fair value of its investments. This detailed fiscal document underscores Main Street Capital Corporation's commitment to investor transparency and its strategic approach to achieving sustained growth and stability.
Main Street Capital Corporation (MSCC) stands out in the investment landscape as a distinguished entity, primarily through its unique investment strategy and robust financial performance. Operating in the mid-market sector, MSCC focuses extensively on providing long-term debt and equity capital to lower middle-market companies and debt capital to middle-market businesses. This dual focus equips the corporation with the ability to diversify its portfolio while mitigating risks, ultimately maximizing returns for its shareholders.
A hallmark of MSCC's investment strategy is its significant emphasis on equity investments, diverging from many other Business Development Companies (BDCs) which predominantly prioritize debt instruments. By targeting lower middle-market companies for equity investment, MSCC harnesses the substantial growth potential of these smaller firms. Moreover, the firm adopts a partnership-oriented philosophy to its portfolio companies, offering not only financial support but also operational guidance via its seasoned team. This hands-on approach nurtures sustainable growth, enhancing the value of MSCCs investments over time.
Financially, MSCC consistently generates attractive returns. The corporation maintains a balanced blend of debt and equity investments, ensuring a steady income stream from interest and dividend payments while retaining the potential for capital gains. Furthermore, MSCC employs a conservative leverage strategy, safeguarding its financial stability amidst market volatility. By prudently managing its balance sheet and maintaining a suitable debt-to-equity ratio, the firm supports both growth initiatives and dividend distributions, reinforcing shareholder value.
Rigorous investment selection processes underpin MSCCs strategic approach, involving thorough due diligence and a profound understanding of the lower middle-market landscape. The firm seeks partnerships with businesses helmed by strong management teams, possessing solid market positions and compelling growth trajectories. This meticulous vetting process is central to mitigating risk and aligning each investment with MSCC's long-term objectives.
Moreover, MSCC promotes portfolio stability by diversifying across various industries, buffering against sector-specific downturns. The firms sectoral diversification is complemented by geographic diversification, investing across different regions to capitalize on varying regional economic strengths. This multifaceted diversification strategy significantly fortifies MSCCs overall portfolio performance.
Performance metrics affirm MSCC's adept execution of its strategy. The corporation delivers high dividend yields consistently, a critical component of investor returns in the income-focused BDC sector. MSCC has also exhibited a steady growth in its net asset value (NAV) over time, underscoring its effective investment management and value creation prowess.
In the latest developments, MSCC continues to make strategic financial maneuvers to enhance its investment capacity. On May 30, 2024, MSCC announced a noteworthy portfolio investment totaling $32.8 million in a leading provider of supply chain management services tailored for U.S. federal government agencies. This investment aims to facilitate the companys acquisition of a firm specializing in equipment sales and rental solutions, aligning with MSCC's strategy to support critical industry sectors (source).
Additionally, MSCC recently priced an underwritten public offering valued at $300 million in aggregate principal amount of 6.50% notes due 2027. This initiative is designed to bolster financial flexibility and propel further investments. The proceeds from this offering will be allocated to repay outstanding indebtedness under various credit facilities and to finance new investments in accordance with MSCC's strategic goals (source).
Further reinforcing its prowess, MSCCs adept investment strategies and diligent management practices have garnered attention in recent analyses. According to a detailed analysis on Seeking Alpha dated May 4, 2023, MSCC has been identified as a compelling investment, especially for those seeking stable and high-yield returns (source). The firm's investment strategy, particularly in the domain of debt securities, enables it to achieve on favorable terms and higher returns by targeting underserved lower middle-market companies.
Moreover, Main Street Capitals conservative leverage practices and operational efficiency are commendable aspects that contribute significantly to its performance metrics. The firm maintains lower leverage ratios compared to its peers, earning an investment-grade rating which further underscores its credibility. This disciplined approach ensures that Main Street remains resilient during economic downturns and is well-positioned to seize growth opportunities when they arise.
In aligning with its strategic outlook, MSCC continues to prioritize securing beneficial and opportunistic investments while maintaining a proactive approach to risk management. This alignment is effectively demonstrated through MSCCs hands-on, partnership-oriented approach, rigorous investment selection, and diversified portfolio. For investors seeking a reliable income with potential for growth, Main Street Capital Corporation consistently presents a compelling case.
For a comprehensive exploration of Main Street Capital Corporation's investment strategy and performance, refer to the detailed discussions available on Seeking Alpha and Yahoo Finance: Seeking Alpha (April 15, 2023), Yahoo Finance (May 29, 2024).
Main Street Capital Corporation (MAIN) has experienced varying levels of volatility over the observed period. The ARCH model suggests significant peaks and troughs in returns, depicted by the high coefficient values. The model also indicates a high degree of clustering in volatility, as evidenced by the substantial alpha parameter.
| R-squared | 0.000 |
| Adjusted R-squared | 0.001 |
| Log-Likelihood | -2,289.89 |
| AIC | 4,583.79 |
| BIC | 4,594.06 |
| No. Observations | 1,257 |
| Df Residuals | 1,257 |
| Df Model | 0 |
| omega | 1.1611 |
| omega std err | 0.109 |
| t-stat omega | 10.638 |
| omega P>|t| | 1.976e-26 |
| omega Conf. Int. | [ 0.947, 1.375 ] |
| alpha[1] | 0.8527 |
| alpha[1] std err | 0.134 |
| t-stat alpha[1] | 6.381 |
| alpha[1] P>|t| | 1.760e-10 |
| alpha[1] Conf. Int. | [ 0.591, 1.115 ] |
To analyze the financial risk associated with a $10,000 investment in Main Street Capital Corporation over a one-year period, we leverage both volatility modeling and machine learning predictions. This combination provides a robust framework for understanding stock volatility and predicting future returns, thereby delivering a comprehensive risk assessment.
Volatility modeling plays a critical role in quantifying the inherent fluctuations in Main Street Capital Corporation's stock price. By analyzing historical price data, the volatility model helps us determine the expected variance and standard deviation of returns over time. This insight into the stock's volatility is crucial for accurate risk assessment and forecasting. By understanding the extent and frequency of price swings, investors can better gauge the potential risks associated with their investment.
Meanwhile, machine learning predictions, specifically from a model like RandomForestRegressor, utilize a different approach. This method leverages historical data and identifies patterns that might indicate future stock performance. By incorporating various input features, such as historical returns, trading volume, macroeconomic indicators, and other relevant financial metrics, machine learning predictions can effectively forecast future returns.
When we combine the outputs of these two approaches, we can derive a more nuanced understanding of potential investment risk. The volatility model indicates the potential range of price movements, while machine learning predictions provide an expected trajectory of the stock price.
One critical risk metric derived from this integrated approach is the Value at Risk (VaR). At a 95% confidence interval, the VaR for a $10,000 investment in Main Street Capital Corporation is calculated to be $120.32. This metric signifies that, with 95% confidence, the maximum expected loss over the one-year period will not exceed $120.32. Conversely, there is a 5% chance that losses could be greater than this amount.
This analysis suggests that while the stock exhibits certain volatility, the expected maximum loss at the 95% confidence level is relatively modest, indicating a potentially manageable risk for investors. Thus, combining volatility modeling with machine learning predictions provides a more comprehensive risk assessment, enabling investors to make more informed decisions regarding their equity investment in Main Street Capital Corporation.
Long Call Option Strategy
When analyzing long call options for Main Street Capital Corporation (MAIN) to determine the most profitable choices within the context of an estimated 2% price increase, it's crucial to consider the intrinsic value, time decay, and sensitivity to various factors, as expressed through "the Greeks." Below are five options analyzed for profitability and risk, spanning near-term to long-term expirations.
Near-Term Option: Expiration on 2024-06-21, Strike $45.00
This option is particularly attractive due to its extremely high return on investment (ROI) of 6.3183. The delta () of 0.9986 indicates that the option almost mirrors the price movement of the underlying stock, providing nearly a dollar-for-dollar increase as the stock price rises. The theta () of 0.0061 represents a moderate rate of time decay, which means that while the option value decreases each day, the impact is relatively small given the short duration. The profit potential, at $4.4228, makes this a compelling short-term investment, though it carries a high premium of $26.08. The high delta suggests that almost any upward movement in the stock price will yield significant profits, with limited risk if the target isn't reached due to theta's low influence over this timeframe.
Near-Term Option: Expiration on 2024-06-21, Strike $34.73
With a relatively high delta of 0.9986 and an ROI of 2.2876, this strike price offers an excellent balance between cost and reward. The premium is lower at $10.03, and the theta of 0.0073 implies low time decay. This makes it an excellent near-term choice with limited downside if the stock does not achieve the targeted price increase. The profit potential is robust at $10.5228, supported by a delta indicating strong responsiveness to stock price movements.
Mid-Term Option: Expiration on 2024-09-20, Strike $45.00
For a medium-term perspective, the call option expiring on September 20, 2024, with a strike price of $45.00 offers a balanced proposition. A delta of 0.9778 suggests high sensitivity to the underlying stock price, while the theta of 0.0065 indicates moderate time decay. This option's profit potential stands at $2.8028, with an ROI of 1.2081, making it a reliable mid-term investment with a reasonable risk profile.
Long-Term Option: Expiration on 2024-12-20, Strike $45.00
This long-term option exposes investors to significant upside potential with a delta of 0.9574 and an outstanding ROI of 3.8789. The associated premium is relatively low at $1.05, and a theta of 0.0058 is indicative of low time decay. The key benefit lies in the profit potential of $4.0728, enhancing its attractiveness for those looking to capitalize on longer-term movements in the stock price.
Long-Term Option: Expiration on 2024-12-20, Strike $39.73
Another noteworthy long-term option is the strike at $39.73 expiring on December 20, 2024. With a delta of 0.9574, this option is highly sensitive to the stock price changes. It carries a premium of $6.85 and offers an ROI of 0.5172. The theta of 0.0063 underscoring low time decay. Considering its profit potential of $3.5428, it stands out as a confident long-term choice for investors willing to hold their positions longer.
Risk and Reward Analysis
Quantifying the risk and reward scenarios:
- Expiration 2024-06-21, Strike $45.00:
- Reward: High, due to a 6.3183 ROI and significant delta.
-
Risk: Moderate, primarily due to the high premium and short-term expiration.
-
Expiration 2024-06-21, Strike $34.73:
- Reward: High, with an ROI of 2.2876 and high profit potential.
-
Risk: Low to moderate, considering the low time decay impact and strong delta.
-
Expiration 2024-09-20, Strike $45.00:
- Reward: Moderate, with a balanced ROI of 1.2081.
-
Risk: Low, given the moderate premium and extended timeframe.
-
Expiration 2024-12-20, Strike $45.00:
- Reward: High, with an exceptional ROI of 3.8789.
-
Risk: Low, as indicated by minimal time decay and high delta.
-
Expiration 2024-12-20, Strike $39.73:
- Reward: Moderate to high, with a solid ROI and profit potential.
- Risk: Low, supported by strong delta and low theta.
In conclusion, the profitability of these options is largely driven by their high delta values, which ensure they are almost as responsive as the underlying stock to price movements. Both near-term and long-term options present attractive opportunities, with varying levels of risk primarily influenced by time decay and premium costs. Investors should select options based on their time horizon and risk tolerance, with the understanding that those with higher deltas and lower thetas tend to offer more favorable outcomes.
Short Call Option Strategy
When evaluating the most profitable short call options for Main Street Capital Corporation (MAIN), multiple factors need to be considered, especially the Greeks, to measure potential profit against risk. Given the target stock price is 2% under the current price, we aim to select options that offer attractive premiums while minimizing the risk of being in the money (ITM) and therefore risking assignment. Here, I present five choices spanning from near-term to long-term options based on expiration dates and strike prices.
-
2024-06-21, Strike 59.43: This short call option, expiring in just six days, has a delta of 0.07686897, indicating a low probability of expiring ITM. The premium received is $0.75, which equates to a significant profit given the very short time frame. The theta value is -0.0751676957, showing decent time decay potential, meaning that as time passes, the option value decreases favorably for the option writer. Since the stock has a 2% lower target price, the likelihood of this option expiring ITM is minimal, thus reducing the assignment risk.
-
2024-07-19, Strike 50.0: This option, with 34 days until expiration, displays a delta of 0.3129566883, indicating a moderate likelihood of being exercised. However, the premium of $0.4 combined with its gamma of 0.1692565851 and vega of 5.2890925806 suggests considerable price sensitivity. The option offers robust time decay with a theta of -0.008983156, contributing to favorable erosion of the option's value for the seller. Considering the probability of heavy assignment risk remains moderate, the profit-through-time decay makes it quite attractive.
-
2024-09-20, Strike 44.7: This option offers a high premium of $4.54, and given that it has 97 days to expiration, it shows significant time decay potential (theta of -0.0082362507), high price sensitivity (vega of 8.2032399914), and a considerable delta of 0.7129358771. Although higher delta entails higher assignment risk, the combination of high premium and projected decay makes this lucrative, especially if the underlying remains below the strike price.
-
2024-12-20, Strike 49.43: For the long-term, this option presents an attractive premium of $1.8 with a decent delta of 0.4312757762. This balanced delta suggests moderate probability of assignment, but the high vega of 13.3662659576 and theta of -0.0043126261 indicate substantial potential for premium decay and price sensitivity. The ROI is 100%, and being placed well above the target price, it mitigates part of the assignment risk due to expected depreciation in option value over time.
-
2024-12-20, Strike 39.43: This long-term option offers a substantial premium of $11.2, attributed to a higher delta of 0.7428277708. Although the high delta suggests a higher risk of assignment, the combination of high profit (2.4728) and significant premium makes it an attractive play if the underlying stock remains stable or trends below the strike price. The theta of -0.0071118246 and high vega of 10.1042385381 ensure continuous decay and sensitivity, thus portraying an excellent profit scenario if managed timely.
Across these five choices, the balance between premium received, delta (probability of assignment), and other Greeks like theta and vega play crucial roles in dictating the risk-reward dynamics. This analysis should help in selecting targeted short call options that best align with minimizing assignment risk while maximizing potential profit.
Long Put Option Strategy
To analyze the most profitable long put options for Main Street Capital Corporation (MAIN), we'll consider the Greeks, the target stock price (which is projected to be 2% over the current price), and various expiration dates and strike prices. Since the options data is not provided, I will offer a general approach along with hypothetical examples to illustrate the process.
Near-Term Options
Expiration Date: [Near-Term Date], Strike Price: [Slightly Below Projected Price]
For near-term options, let's consider a strike price slightly below the projected price (2% over the current price). Near-term options often have lower premiums due to the shorter time to expiration. Given this, the Delta value would typically be higher, indicating that the option's price will react more sensitively to changes in the stock price.
- Delta: A higher absolute Delta value would mean a more significant price movement for each dollar change in the stock's price.
- Theta: Near-term options have higher time decay (Theta). As expiration approaches, the option rapidly loses time value, so timing is critical.
Risk and Reward: - Reward: If the stock price drops below the strike price quickly, the profit potential is high due to the Delta sensitivity. - Risk: The time decay is rapid, so if the stock price does not move favorably soon, the option could lose a substantial portion of its premium quickly.
Short-Term Options
Expiration Date: [Short-Term Date], Strike Price: [At Current Price]
Short-term options provide a balance between premium cost and time value. Let's consider an option with a strike price at the current stock price.
- Delta: Moderately high, indicating favorable responsiveness to stock price movements.
- Theta: Significant, but not as high as near-term options.
Risk and Reward: - Reward: The potential profit if the stock's price declines, while still maintaining time value. - Risk: Still vulnerable to time decay, though less so than near-term options. The stock price needs to decline within the next few weeks for profitability.
Medium-Term Options
Expiration Date: [Medium-Term Date], Strike Price: [Current Price + Projected Increase]
Medium-term options offer a more extended time horizon, which could be advantageous in a volatile market.
- Delta: Moderate, capturing a good portion of stock price changes.
- Vega: Higher Vega value due to increased sensitivity to volatility, which can be beneficial if the stock experiences significant price swings.
Risk and Reward: - Reward: Potential for profit with a lower risk of time decay. If the stock decreases in value within the medium term, there is ample opportunity for profit. - Risk: While reduced, time decay (Theta) still poses a risk if the stock doesn't move favorably within the given period. The premium is more substantial, so the initial investment is higher.
Long-Term Options
Expiration Date: [Long-Term Date], Strike Price: [1-2 Standard Deviations Above Current Price]
Long-term options, often referred to as LEAPS, provide the most extended duration until expiration.
- Delta: Generally lower but increases as the option becomes further in-the-money.
- Theta: Much lower, allowing investors to hold the option longer without significant loss of time value.
- Vega: High, making the option sensitive to changes in the stock's volatility.
Risk and Reward: - Reward: Large profit potential if the stock price declines significantly over a longer period. These options benefit from substantial time value, reducing immediate pressure for stock price movements. - Risk: Higher premiums mean a more substantial initial outlay. If the stock price does not decline as expected over a longer term, the loss could be more pronounced due to the premium paid.
Very Long-Term Options (LEAPS)
Expiration Date: [Very Long-Term Date], Strike Price: [Maximum Strike Price Available]
For investors looking at extensive time horizons, extremely long-term options might be the best choice.
- Delta: Lower initially but increases as the stock price drops.
- Theta: Negligible compared to nearer-term options.
- Vega: Highest, indicating significant sensitivity to volatility changes.
Risk and Reward: - Reward: Substantial profit potential with maximum flexibility in timeframe. High sensitivity to volatility can amplify profits if the market becomes turbulent. - Risk: Very high initial investment due to the premium cost. If the stock does not decline as expected, the loss could be significant but spread over a more extended period, which could provide options for mitigating strategies.
Summary
Given the target stock price 2% above the current price, investors have several strategic options. The near-term and short-term options provide quick profitability potential with higher risks due to time decay. Medium-term options offer a balanced approach with moderate risks and rewards. Long-term and very long-term options (LEAPS) provide significant profit potential with lower risks from time decay but require a larger initial investment. Each option type has its risk/reward profile, necessitating careful consideration of the investor's risk tolerance, market outlook, and investment horizon.
Short Put Option Strategy
When analyzing short put options for Main Street Capital Corporation (MAIN), the key factors to consider are the Greek values, expiration dates, strike prices, and how much premium (profit) you can derive from writing these options. Additionally, your goal is to minimize the risk of having the stock assigned to you by focusing on options that are less likely to end up in-the-money (ITM).
Given that the target stock price is 2% below the current stock price, it implies that options deeply out-of-the-money (OTM) are preferred to reduce the probability of assignment. Let's analyze the dataset accordingly to identify the most profitable options.
Option #1: Near-Term Expiration with Low Delta
- Expiration Date: 2024-06-21
- Strike Price: $40.00
- Delta: -0.0000000001
- Premium: $0.9
- ROI: 100.0%
- Profit: $0.9
This option has an extremely low delta (-0.0000000001), indicating almost no risk of being assigned as it predicts the option will highly likely stay OTM. Despite the low profit, the ROI is quite high because the premium is inexpensive.
Option #2: Intermediate-Term with Moderate Delta
- Expiration Date: 2024-09-20
- Strike Price: $44.7
- Delta: -0.2004355822
- Premium: $0.43
- ROI: 100.0%
- Profit: $0.43
This option provides a reasonable balance between premium and risk, with a moderate delta (-0.2004355822). The delta indicates a slight probability of ending up ITM, ensuring a lower risk while still yielding decent profit and the highest possible ROI.
Option #3: Intermediate-Term with Higher Profit
- Expiration Date: 2024-12-20
- Strike Price: $45.00
- Delta: -0.0014386126
- Premium: $6.12
- ROI: 100.0%
- Profit: $6.12
The delta here is quite low (-0.0014386126), translating to a minimal risk of being assigned. Despite the longer expiration date, the high premium offers an attractive profit while maintaining a high ROI.
Option #4: Long-Term with Substantial Premium
- Expiration Date: 2024-12-20
- Strike Price: $55.00
- Delta: -0.957410258
- Premium: $15.1
- ROI: 54.6834437086%
- Profit: $8.2572
Although the delta indicates a higher risk of this option being ITM, the substantial premium ($15.1) offers a considerable profit ($8.2572). The longer-term nature means market conditions can significantly change, potentially reducing the risk further as time progresses.
Option #5: Balanced Long-Term with Moderate Delta
- Expiration Date: 2024-12-20
- Strike Price: $49.43
- Delta: -0.4907024196
- Premium: $2.8
- ROI: 54.5428571429%
- Profit: $1.5272
This option balances risk and reward with a delta of -0.4907024196, indicating a moderate assignment risk and a reasonable premium. Given the longer expiration, it provides potential for higher profit ($1.5272) while still being attractive in terms of ROI.
In conclusion, for those looking to maximize profitability while minimizing risk, the options listed above provide a blend of low-risk short-term opportunities and higher reward long-term options. Each has been selected, considering the delta to minimize the likelihood of assignment, while capturing significant premiums to ensure profitability. Shorter expiration dates generally offer lower risk but also lower premiums, while longer-term options come with higher premiums and somewhat higher risks.
Vertical Bear Put Spread Option Strategy
A vertical bear put spread options strategy involves buying a put option and simultaneously selling another put option on the same underlying asset with the same expiration date but a different strike price. This strategy is used when the investor anticipates a decline in the underlying asset's price. Given the data for Main Street Capital Corporation (MAIN) and your goal to minimize assignment risk, let's analyze the most profitable strategies across different expiration dates and strike prices.
Near-Term Options
Example 1: Expiring June 21, 2024
- Short Leg: Sell the 45.0 put with a premium of $3.50
- Delta: -0.0000000243 (Very low probability of being in the money)
- Gamma: 0.0000001738
- Theta: -0.0000000091
-
Rho: -0.0000000002
-
Long Leg: Choose a slightly higher strike price, like the 49.73 put.
-
Premium and Greeks: Given that data isn't provided, assume a similar delta since the strikes are close.
-
Risk and Reward:
- Maximum Profit: Difference in strike prices minus net premium received.
- Maximum Loss: Cost of the spread.
- Reward: Although this spread won't yield a high premium, it carries minimal risk of assignment due to the low delta.
Example 2: Expiring September 20, 2024
- Short Leg: Sell the 44.7 put with a premium of $0.43
- Delta: -0.2004355822
- Gamma: 0.0521079338
- Theta: -0.0086975321
-
Rho: -0.0278579971
-
Long Leg: Buy a higher strike put like the 49.73 put, assumed higher cost.
-
Risk and Reward:
- Maximum Profit: Strike price difference minus net premium.
- Maximum Loss: Cost of spread.
This spread is slightly riskier given the higher delta but still moderate.
Medium-Term Options
Example 3: Expiring December 20, 2024
- Short Leg: Sell the 45.0 put with a premium of $6.12
- Delta: -0.0014386126 (Low risk of assignment)
- Gamma: 0.0042445018
- Theta: -0.0000218246
-
Rho: -0.0003664653
-
Long Leg: Choose a slightly different strike price such as the 49.73 put.
-
Premium and Greeks: Slightly higher delta, assumed from lower strike.
-
Risk and Reward:
- Maximum Profit: Difference in strike prices minus net premium.
- Maximum Loss: Cost of the spread.
Long-Term Options
Example 4: Expiring December 20, 2024
- Short Leg: Sell the 50.0 put with a premium of $9.0
- Delta: -0.957410258 (High risk of assignment)
- Gamma: 0.0
- Theta: -0.0052116082
-
Rho: -0.2519735459
-
Long Leg: Buy a higher strike option such as the 55.0 put.
-
Premium and Greeks: Higher premium due to higher strike.
-
Risk and Reward:
- Maximum Profit: Strike price differential minus net premium.
- Maximum Loss: High since the delta indicates it could be in the money.
Recommendation: This option involves higher risk due to high delta, only suitable for those confident about a downturn.
High Risk-High Reward Strategy (Long-Dated)
Example 5: Expiring December 20, 2024
- Short Leg: Sell the 49.43 put with a premium of $2.8
- Delta: -0.4907024196
- Gamma: 0.0377987379
- Theta: -0.0125034654
-
Rho: -0.1478792515
-
Long Leg: Higher strike such as 55.0 put
-
Premium and Greeks: Implied similar risk profile.
-
Risk and Reward:
- Maximum Profit: Difference in strike prices minus net premium.
- Maximum Loss: Cost of spread.
Summary Choices Based on Expiration Date and Strike Price: 1. Near-Term (June 21, 2024): Short 45.0 put, Long 49.73 put 2. Near-Term (September 20, 2024): Short 44.7 put, Long 49.73 put 3. Medium-Term (December 20, 2024): Short 45.0 put, Long 49.73 put 4. Long-Term (December 20, 2024): Short 50.0 put, Long 55.0 put 5. Long-Dated High Risk: Short 49.43 put, Long 55.0 put
Vertical Bull Put Spread Option Strategy
A vertical bull put spread, also known simply as a bull put spread, is a bullish options strategy that involves simultaneously selling (writing) a higher strike put and buying a lower strike put within the same expiration date. This strategy aims to capitalize on a stock's stable or rising price while limiting the maximum loss.
Given the target stock price for Main Street Capital Corporation (MAIN) is within a 2% range over or under its current price, we need to select put options that offer a good risk-reward ratio while minimizing the risk of assignment. Options that are too deep in the money (ITM) risk early assignment, while those too far out of the money (OTM) may not provide adequate return. To find the most profitable and prudent options, we'll analyze opportunities across different expiration dates.
Short-Term (Near-Term):
- June 21, 2024, Expiration:
- Sell 40.0 Put @ 0.9 Premium:
- Delta: approximately neutral indicating low assignment risk.
- Premium: $0.9.
- Buy 39.0 Put (hypothetical, assuming $0.01 for nearer strike buys).
- Maximum profit: $0.9 (premium received).
- Maximum risk: Difference in strikes - premium received, i.e., $1.0 - $0.9 = $0.1.
- ROI: 900% ($0.9 / $0.1).
Medium-Term:
- September 20, 2024, Expiration:
- Sell 49.7 Put @ 2.27 Premium:
- Delta: -0.481, lower risk of assignment.
- Premium: $2.27.
-
Buy 49.0 Put:
- Assume a hypothetical premium of $1.84 based on similar closer strikes.
- Maximum profit: $2.27 (premium received).
- Maximum risk: Difference in strikes - premium received, i.e., $0.3.
- ROI: 756.67% ($2.27 / $0.3).
-
September 20, 2024, Expiration:
- Sell 44.7 Put @ 0.43 Premium:
- Delta: -0.200, indicating moderate assignment risk.
- Premium: $0.43.
- Buy 44.0 Put:
- Assume a hypothetical premium of $0.15.
- Maximum profit: $0.43 (premium received).
- Maximum risk: Difference in strikes - premium received, i.e., $0.7 - $0.43 = $0.27.
- ROI: 159.26% ($0.43 / $0.27).
Long-Term:
- December 20, 2024, Expiration:
- Sell 50.0 Put @ 9.0 Premium:
- Delta: -0.957, very high assignment risk.
- Premium: $9.0.
-
Buy 49.0 Put:
- Assume a hypothetical premium of $8.2572 (closest premium example).
- Maximum profit: $9.0.
- Maximum risk: Difference in strikes - premium received, i.e., $1.0 - $9.0 = potential negative risk should be avoided.
- ROI: Not suitable due to high ITM risk.
-
December 20, 2024, Expiration:
- Sell 44.73 Put @ 2.29 Premium:
- Delta: -0.000581, indicating extremely low risk of assignment.
- Premium: $2.29.
- Buy 44.0 Put:
- Assume a hypothetical premium of $0.68.
- Maximum profit: $2.29.
- Maximum risk: Difference in strikes - premium received, i.e., $0.73 - $2.29 = negative margin and thus should be avoided for completion.
Analysis and Summary:
Option 1: June 21, 2024:
- Though limited profitability, very high ROI with minimal assignment risk due to near-neutral delta.
Option 2 & 3: September 20, 2024:
- Balanced near-delta approach options, good risk management features, optimize premium vs. risk assumption within target frame.
Long-term approaches (December 20, 2024):
- Carefully approach high delta for balancing ROI vs. total risk of significant assignments.
- Lower delta options for a safer, conservative approach optimizing premium-paid.
By avoiding high delta ITM risks, the above strategies maximize profitability under different expiration reaches while minimizing risk. This keeps the portfolio more secure oriented towards ROI stable returns, optimal for MAIN's target price fluctuation environment.
Vertical Bear Call Spread Option Strategy
When implementing a vertical bear call spread on Main Street Capital Corporation (MAIN), the goal is to capitalize on a downward or stagnating movement in the stock's price. The strategy involves selling a call option (short) at a lower strike price and purchasing another call option (long) at a higher strike price. This setup creates a net credit, which is the maximum profit potential. The risk arises primarily from the short call, which can be exercised if it ends up in the money, potentially leading to an assignment of shares. It's crucial to consider both the risk of assignment and the potential profit and loss scenarios.
1. Short-Term Strategy (June 21, 2024): Strike Prices of 55 and 59.43
- Short Call (Strike: 55, Expire: 2024-06-21)
- Delta: 0.0469
- Premium: $0.05
-
Profit: $0.05
-
Long Call (Strike: 59.43, Expire: 2024-06-21)
- Delta: 0.0769
- Premium: $0.75
- Profit: $0.75
This spread anticipates the stock price will remain below $55. The delta of the short call is low (0.0469), indicating a low probability of the option being in the money, which minimizes assignment risk. The maximum profit here is the net premium received, which is $0.05 after considering the bi-directional combination of sold and bought premiums. The risk is relatively low due to the low delta but not entirely absent.
2. Mid-Term Strategy (July 19, 2024): Strike Prices of 50 and 55
- Short Call (Strike: 50, Expire: 2024-07-19)
- Delta: 0.3129
- Premium: $0.4
-
Profit: $0.4
-
Long Call (Strike: 55, Expire: 2024-07-19)
- Delta: 0.0313
- Premium: $0.05
- Profit: $0.05
In this setup, the short call with a delta of 0.3129 suggests a higher probability of the option being in the money compared to the previous strategy, hence a higher assignment risk. However, the potential net credit here is $0.4, which increases the reward. The higher delta also implies better profit potential if the stock stays below $50, but it equally increases the likelihood of assignment.
3. Intermediate Strategy (September 20, 2024): Strike Prices of 49.7 and 50.0
- Short Call (Strike: 49.7, Expire: 2024-09-20)
- Delta: 0.4043
- Premium: $1.1
-
Profit: $1.1
-
Long Call (Strike: 50.0, Expire: 2024-09-20)
- Delta: 0.2276
- Premium: $0.5
- Profit: $0.5
This spread indicates a more balanced approach. The short call has a moderate delta, implying a reasonable probability of being in the money, matched with a higher premium. The net premium is $1.1, larger than the previous example, increasing potential profit while balancing assignment risk. The slightly lower delta on the long call offers some downside protection, but the primary risk continues to be on the short side.
4. Long-Term Strategy (December 20, 2024): Strike Prices of 49.43 and 50.0
- Short Call (Strike: 49.43, Expire: 2024-12-20)
- Delta: 0.4313
- Premium: $1.8
-
Profit: $1.8
-
Long Call (Strike: 50.0, Expire: 2024-12-20)
- Delta: 0.0
- Premium: $0.16
- Profit: $0.16
In the long-term setup, the delta of the short call is higher, indicating a higher assignment risk. However, the premium received is substantial ($1.8), offsetting the risk with potentially higher returns. The long call premium is minimal at $0.16, keeping the net credit attractive. A more extended duration means more time for the stock to remain below the specified strike price, justifying the higher delta.
5. Long-Term Strategy with Higher Strike (December 20, 2024): Strike Prices of 59.7 and 60.0
- Short Call (Strike: 59.7, Expire: 2024-12-20)
- Delta: 0.1792
- Premium: $0.05
-
Profit: $0.05
-
Long Call (Strike: 60.0, Expire: 2024-12-20)
- Delta: 0.1429
- Premium: $0.1
- Profit: $0.1
This option structure keeps the assignment risk low, given a delta under 0.2. The slight increase in the long call premium keeps the net credit smaller, but it heavily manages the assignment risk. The maximum profit here is quite modest ($0.05), suggesting safer but smaller potential returns.
Conclusion:
The most profitable and balanced bear call spread involves choosing options with a combination of higher premiums and manageable deltas. Near-term strategies tend to have lower premiums but also lower assignment risks, making them safer. Conversely, long-term approaches offer higher premiums but come with increased risk. Adjusting expirations and strike prices based on risk tolerance and target stock price fluctuations is essential for optimizing returns and managing potential losses in a vertical bear call spread strategy on MAIN.
Vertical Bull Call Spread Option Strategy
Introduction
A vertical bull call spread is an options strategy that involves buying and selling call options with the same expiration date but different strike prices. This strategy is designed for a bullish outlook, enabling the trader to profit from a moderate rise in the underlying asset's price while limiting potential losses. For Main Street Capital Corporation (MAIN), I've analyzed the Greeks for both short and long call options and identified the most profitable vertical bull call spread strategies for different expiration periods considering the risk and reward profiles.
Near-Term Strategy (June 2024)
For the near-term strategy with an expiration date of June 21, 2024, consider the following spread: - Long Call: Strike Price $44.43, Delta 0.6405, Vega 8.2032, Theta -0.0082, Premium $4.54 - Short Call: Strike Price $49.43, Delta 0.419, Vega 2.4589, Theta -0.0458, Premium $0.31
Risk and Reward:
- Maximum profit: The maximum profit occurs if MAINs stock price is above $49.43 at expiration. The net profit would be $49.43 - $44.43 (difference in strike prices) - $4.23 (net premium paid) = $4.77 per share.
- Maximum loss: The maximum loss is the net premium paid, which is $4.23 per share.
- Breakeven point: $44.43 (buy strike) + $4.23 (net premium) = $48.66
Profit and Loss Scenario:
If the stock price is: - Above $49.43, the maximum profit is achieved. - Between $44.43 and $49.43, there will be a partial profit. - Below $44.43, the entire premium is lost.
Medium-Term Strategy (July 2024)
For a medium-term strategy with an expiration date of July 19, 2024, consider the following spread: - Long Call: Strike Price $40.00, Delta 0.8594, Vega 3.2107, Theta -0.0250, Premium $10.04 - Short Call: Strike Price $44.70, Delta 0.7129, Vega 8.2032, Theta -0.0082, Premium $4.54
Risk and Reward:
- Maximum profit: $44.70 - $40.00 - ($10.04 - $4.54) = $3.20 per share.
- Maximum loss: $5.50 per share.
- Breakeven point: $40.00 + $5.50 = $45.50
Profit and Loss Scenario:
If the stock price is: - Above $44.70, the maximum profit is achieved. - Between $40.00 and $44.70, there will be a partial profit. - Below $40.00, the entire premium is lost.
Intermediate-Term Strategy (September 2024)
For an intermediate-term strategy with an expiration date of September 20, 2024, consider the following spread: - Long Call: Strike Price $49.70, Delta 0.4043, Vega 9.6484, Theta -0.0059, Premium $1.10 - Short Call: Strike Price $55.00, Delta 0.2276, Vega 7.5713, Theta -0.0102, Premium $0.10
Risk and Reward:
- Maximum profit: $55.00 - $49.70 - ($1.10 - $0.10) = $4.30 per share.
- Maximum loss: $1.00 per share.
- Breakeven point: $49.70 + $1.00 = $50.70
Profit and Loss Scenario:
If the stock price is: - Above $55.00, the maximum profit is achieved. - Between $49.70 and $55.00, there will be a partial profit. - Below $49.70, the entire premium is lost.
Longer-Term Strategy (December 2024)
For a longer-term strategy with an expiration date of December 20, 2024, consider the following spread: - Long Call: Strike Price $39.43, Delta 0.7428, Vega 10.1042, Theta -0.0071, Premium $11.20 - Short Call: Strike Price $44.43, Delta 0.6405, Vega 12.2430, Theta -0.0071, Premium $5.24
Risk and Reward:
- Maximum profit: $44.43 - $39.43 - ($11.20 - $5.24) = $4.04 per share.
- Maximum loss: $5.96 per share.
- Breakeven point: $39.43 + $5.96 = $45.39
Profit and Loss Scenario:
If the stock price is: - Above $44.43, the maximum profit is achieved. - Between $39.43 and $44.43, there will be a partial profit. - Below $39.43, the entire premium is lost.
Extended-Term Strategy (188 Days)
For the longest-term strategy with an expiration date of December 20, 2024, consider the following spread: - Long Call: Strike Price $24.43, Delta 0.9574, Theta 0.0081, Rho 0.1231, Premium $16.60 - Short Call: Strike Price $29.43, Delta 0.9139, Theta 0.0035, Rho 0.1356, Premium $16.41
Risk and Reward:
- Maximum profit: $29.43 - $24.43 - ($16.60 - $16.41) = $4.41 per share.
- Maximum loss: $0.19 per share.
- Breakeven point: $24.43 + $0.19 = $24.62
Profit and Loss Scenario:
If the stock price is: - Above $29.43, the maximum profit is achieved. - Between $24.43 and $29.43, there will be a partial profit. - Below $24.43, the entire premium is lost.
Conclusion
In conclusion, the vertical bull call spread is an advantageous strategy for traders expecting a modest rise in the stock price of MAIN. However, its crucial to carefully consider the Greeks, expiration dates, and premiums to ensure an advantageous balance between risk and reward. Each strategy proposed above offers a different risk profile and profit potential, ranging from near-term to extended-term investments, allowing flexibility depending on market expectations and trading horizons.
Spread Option Strategy
Analyzing Calendar Spread Strategy for MAIN
Calendar spreads involve buying a call option with one expiration date while simultaneously selling a call option at the same strike price with a nearer-term expiration date. In your specified strategy, each spread aims to capitalize on time decay, which is more pronounced for the short-term options compared to the long-term options.
Considering your criteria buying a call option and selling a put option, aiming to minimize risk while targeting a stock price 2% above or below the current price let's assess the optimal combinations for Main Street Capital Corporation (MAIN).
Risk and Reward Analysis
- Near-Term Strategy
-
Buy a Call Option (Near-Term)
- Expiration: 2024-06-21
- Strike Price: $45.00
- Delta: 0.9986 (high sensitivity, deep in the money)
- Premium: $0.7
- Profit: $4.4228
- ROI: 6.3183
-
Sell a Put Option (Near-Term)
- Expiration: 2024-06-21
- Strike Price: $49.73
- Delta: -0.9986 (high sensitivity, deep in the money)
- Premium: $3.85
- Profit: $2.2772
- ROI: 59.1481
This setup generates a high return on investment (ROI) with significant premium income. The primary risk is the potential assignment of shares due to deep in-the-money positions.
- Medium-Term Strategy
-
Buy a Call Option (Medium-Term)
- Expiration: 2024-09-20
- Strike Price: $45.00
- Delta: 0.9778
- Premium: $2.32
- Profit: $2.8028
- ROI: 1.2081
-
Sell a Put Option (Medium-Term)
- Expiration: 2024-09-20
- Strike Price: $49.7
- Delta: -0.4814
- Premium: $2.27
- Profit: $0.7272
- ROI: 32.0352
The medium-term strategy reduces the risk of share assignment due to a less deep in-the-money position. A balanced ROI with manageable risk makes this strategy attractive.
- Long-Term Strategy
-
Buy a Call Option (Long-Term)
- Expiration: 2024-12-20
- Strike Price: $50.00
- Delta: 0.9574
- Premium: $1.05
- Profit: $4.0728
- ROI: 3.8789
-
Sell a Put Option (Long-Term)
- Expiration: 2024-12-20
- Strike Price: $55.0
- Delta: -0.9574
- Premium: $15.1
- Profit: $8.2572
- ROI: 54.6834
This long-term strategy benefits from significant premiums and high profit potential, with a moderate risk of assignment given the deep in-the-money status of the options.
- Balanced Near-Medium Strategy
-
Buy a Call Option
- Expiration: 2024-07-19
- Strike Price: $40.00
- Delta: 0.8594
- Premium: $10.04
- Profit: $0.0828
- ROI: 0.0082
-
Sell a Put Option
- Expiration: 2024-07-19
- Strike Price: $45.00
- Delta: -0.1134
- Premium: $0.12
- Profit: $0.12
- ROI: 100.0
This approach combines near-term and medium-term exposure, reducing risk with out-of-the-money options while yielding modest profits.
- Low-Risk Long-Term Strategy
-
Buy a Call Option
- Expiration: 2024-12-20
- Strike Price: $30.00
- Delta: 0.9574
- Premium: $11.27
- Profit: $8.8528
- ROI: 0.7855
-
Sell a Put Option
- Expiration: 2024-12-20
- Strike Price: $34.43
- Delta: -0.1317
- Premium: $0.35
- Profit: $0.35
- ROI: 100.0
Offering a low-risk strategy with both legs out of the money, this combination minimizes assignment risk while still delivering substantial profit.
Conclusion
These choices offer diverse expiry dates and varying risk profiles to match different investment objectives: - The near-term strategy presents high premiums and ROI but higher assignment risk. - Medium to long-term strategies balance risk and reward, reducing assignment likelihood while keeping premiums attractive. - More balanced and low-risk approaches give conservative but safer returns.
Analyzing these combinations allows you to choose the calendar spread strategy that best aligns with your risk tolerance and financial goals.
Calendar Spread Option Strategy #1
Calendar spreads, also known as time spreads, involve simultaneously buying and selling options with the same strike price but different expiration dates. They can be designed using either calls or puts, but in this case, you'll buy a put option and sell a call option at different calendar dates. This strategy can capitalize on discrepancies in implied volatility among different expiration dates, and often profits from a stable or modestly moving stock price.
To maximize profitability while minimizing the risk of assignment, let's look at five choices based on the provided Greeks and other option characteristics. Risk is primarily managed by selecting options that have low deltas (reflecting lower probabilities of finishing significantly in-the-money at expiration), while reward can be assessed by considering the premium and other Greeks such as theta and vega.
1. Short Call Option: Strike $55.00, Expiration: June 21, 2024 - Delta: 0.0469 (Low probability of assignment) - Gamma: 0.0300 (Moderate price sensitivity) - Vega: 0.6173 (Potential gain from volatility) - Theta: -0.0263 (Moderate time decay benefit) - Premium: $0.05
Analysis: This option has low delta, indicating a low risk of assignment, which is favorable given our strategy to minimize this risk. The premium is modest but enhances profitability when combined with a cheap premium put. Its moderate theta suggests limited profitability erosion over time.
2. Short Call Option: Strike $55.00, Expiration: September 20, 2024 - Delta: 0.2275 (Higher probability of assignment compared to Choice 1) - Gamma: 0.0396 (High price sensitivity) - Vega: 7.5713 (High potential gain from volatility) - Theta: -0.0102 (Low time decay benefit) - Premium: $0.10
Analysis: This option has higher delta compared to Choice 1, making it more susceptible to assignment. However, its high Vega reflects a strong potential to gain from volatility increases, potentially making it a profitable choice. Its longer-dated nature might balance premium collection with time-value benefits.
3. Short Call Option: Strike $50.00, Expiration: July 19, 2024 - Delta: 0.3129 - Gamma: 0.1693 - Vega: 5.2891 - Theta: -0.0089 - Premium: $0.40
Analysis: This option's delta is higher, suggesting a higher risk of assignment. It offers a relatively higher premium, and the noteworthy Gamma and Vega indicate significant sensitivity to price changes and volatility. This makes it a viable long-term strategy if aiming for higher premiums while accepting the higher assignment risk.
4. Short Call Option: Strike $49.43, Expiration: December 20, 2024 - Delta: 0.4313 - Gamma: 0.0546 - Vega: 13.3663 - Theta: -0.0043 - Premium: $1.80
Analysis: A higher delta presents an elevated risk of assignment, but this option offers a higher premium and exposure to substantial Vega. For those willing to assume more risk for potentially higher rewards, this makes an attractive candidate for collecting higher premiums due to volatility.
5. Short Call Option: Strike $44.43, Expiration: December 20, 2024 - Delta: 0.6404 - Gamma: 0.0276 - Vega: 12.2430 - Theta: -0.0072 - Premium: $5.24
Analysis: This has the highest delta, which translates to the highest risk of assignment. However, it also offers the highest premium and substantial Vega exposure, making it highly profitable under conditions of rising volatility. This should be chosen only if confident in handling the risk or seeking sizeable speculation profits.
Conclusion
Based on the analyzed Greeks and premiums, here's a summarization of your five choices:
- Strike $55.00, Expiring June 21, 2024: Low risk with modest profit.
- Strike $55.00, Expiring September 20, 2024: Slightly higher risk with a suitable premium for balanced risk/reward.
- Strike $50.00, Expiring July 19, 2024: Moderate risk with higher premium and sensitivity to stock price changes.
- Strike $49.43, Expiring December 20, 2024: Elevated risk with significant premium for those accepting higher assignment risk.
- Strike $44.43, Expiring December 20, 2024: Highest risk with the highest potential profit, suitable for advanced strategies seeking substantial returns.
Calendar Spread Option Strategy #2
Calendar Spread Options Strategy Analysis for Main Street Capital Corporation (MAIN)
To maximize profit from a calendar spread options strategy for MAIN, we must carefully select a combination of selling a put option (which we currently lack data for) and buying a call option at different expiration dates, all while minimizing the risk of having shares assigned. We have an implied price movement of around 2% over or under the current stock price to guide our strategy.
Using the provided data for call options, let's analyze several choices, focusing on different expiration dates and strike prices to cover short-term to long-term strategies.
Strategy 1: Short-term Spread (Near-term Expiry)
- Buy Call Option
- Expiration: 2024-06-21
- Strike Price: $59.43
- Greeks: Delta = 0.0769, Gamma = 0.0229, Theta = -0.0752, Vega = 0.9084, Rho = 0.0006
- Premium: $0.75
- ROI: 100%
-
Profit: $0.75
-
Sell Put Option
- Assumption: Krative based on current market price mimicking sold put.
Risks and Rewards
With a high delta and relatively high theta, we could expect the value to be sensitive to small changes in the stock price and time decay. The low delta implies low initial risk of assignment.
Profit and Loss Scenarios:
- Profitable Scenario: If the stock remains relatively stable or goes slightly below the strike price, the strategy will yield a modest profit due to the premium collected.
- Loss Scenario: A significant decline in stock price might increase the risk of share assignment.
Strategy 2: Near-term Higher Strike
- Buy Call Option
- Expiration: 2024-07-19
- Strike Price: $54.43
- Greeks: Delta = 0.3129, Gamma = 0.1693, Theta = -0.0090, Vega = 5.2891, Rho = 0.0139
- Premium: $0.40
- ROI: 100%
-
Profit: $0.40
-
Sell Put Option
- Assumption: Design a complementary sold put at similar strike.
Risks and Rewards
This call option has a higher delta, suggesting the option is more likely to be impacted by stock price changes, but still offers decent protection via premium received. Theta and Vega indicate dependency on volatility and time decay.
Profit and Loss Scenarios:
- Profitable Scenario: Moderate stock price increase without exceeding the strike price.
- Loss Scenario: A substantial drop in stock price could lead to assignment risk.
Strategy 3: Mid-term Spread
- Buy Call Option
- Expiration: 2024-09-20
- Strike Price: $55.0
- Greeks: Delta = 0.2276, Gamma = 0.0396, Theta = -0.0102, Vega = 7.5713, Rho = 0.0272
- Premium: $0.1
- ROI: 100%
-
Profit: $0.1
-
Sell Put Option
- Assumption: Using similar expected market conditions.
Risks and Rewards
Moderate delta limits risk while still providing exposure to favorable stock movements. The low theta also reduces rapid time decay losses, while high vega makes the position sensitive to volatility changes.
Profit and Loss Scenarios:
- Profitable Scenario: Slight stock price increase or stability within the strike price range.
- Loss Scenario: Major declines can compel share assignments.
Strategy 4: Long-term Spread (Higher Investment)
- Buy Call Option
- Expiration: 2024-12-20
- Strike Price: $49.43
- Greeks: Delta = 0.4313, Gamma = 0.0546, Theta = -0.0043, Vega = 13.3663, Rho = 0.0984
- Premium: $1.8
- ROI: 100%
-
Profit: $1.8
-
Sell Put Option
- Assumption: Complementary sale depending on evaluation.
Risks and Rewards
Higher delta with very high vega implies a significant sensitivity to stock price changes and market volatility. With lower theta, time decay is less impactful for this longer-term option.
Profit and Loss Scenarios:
- Profitable Scenario: Stable to moderate increase in price yields a high return.
- Loss Scenario: Sharp declines in stock can lead to losses and forced assignment.
Strategy 5: Long-term/Aggressive Spread
- Buy Call Option
- Expiration: 2024-12-20
- Strike Price: $44.43
- Greeks: Delta = 0.6405, Gamma = 0.0276, Theta = -0.0072, Vega = 12.2430, Rho = 0.1281
- Premium: $5.24
- ROI: 28.87%
-
Profit: $1.5128
-
Sell Put Option
- Assumption: Corresponding put evaluation.
Risks and Rewards
Very high delta signals greater immediate impact from stock price changes. High vega amplifies impact from volatility. It offers high potential profit, with tangible but managed risk via delta influence and investment premium.
Profit and Loss Scenarios:
- Profitable Scenario: Significant appreciation in stock price ensures highest profit.
- Loss Scenario: Strong devaluation requires share purchase at higher premium loss.
Conclusion
The most balanced and profitable approach with minimized risk appears to be strategy 3 with the mid-term option expiring on 2024-09-20 due to its moderate delta and vega while providing significant upside potential with controlled risk.
Similar Companies in Asset Management:
Gladstone Capital Corporation (GLAD), PennantPark Floating Rate Capital Ltd. (PFLT), Horizon Technology Finance Corporation (HRZN), Prospect Capital Corporation (PSEC), Hercules Capital, Inc. (HTGC), FS KKR Capital Corp. (FSK), Gladstone Investment Corporation (GAIN), Stellus Capital Investment Corporation (SCM), Ares Capital Corporation (ARCC), TriplePoint Venture Growth BDC Corp. (TPVG), Sixth Street Specialty Lending, Inc. (TSLX), Capital Southwest Corporation (CSWC), Golub Capital BDC, Inc. (GBDC), Owl Rock Capital Corporation (ORCC), New Mountain Finance Corporation (NMFC), Solar Capital Ltd. (SLRC)
https://seekingalpha.com/article/4694549-the-secret-sauce-of-the-best-performing-bdcs
https://seekingalpha.com/article/4694667-buy-these-7-8-percent-yields-in-may-and-go-away
https://seekingalpha.com/article/4694814-2-big-yields-firing-on-all-cylinders
https://seekingalpha.com/article/4695633-main-street-capital-high-quality-high-premium
https://seekingalpha.com/article/4695457-9-stocks-im-buying-in-late-may
https://seekingalpha.com/article/4695969-five-6-9-percent-low-risk-yields-to-avoid-in-may-2024
https://finance.yahoo.com/news/main-street-prices-public-offering-211000565.html
https://finance.yahoo.com/news/main-street-capital-prices-300-085523740.html
https://seekingalpha.com/article/4696412-2-monthly-payers-to-build-your-passive-income
https://finance.yahoo.com/news/main-street-announces-portfolio-investment-110000001.html
https://finance.yahoo.com/news/main-street-capital-invests-33-120329423.html
https://seekingalpha.com/article/4697276-bad-news-for-main-street-capital-stock
https://www.sec.gov/Archives/edgar/data/1396440/000139644024000082/main-20240331.htm
Copyright © 2024 Tiny Computers (email@tinycomputers.io)
Report ID: 4atOdlc
Cost: $0.47389
https://reports.tinycomputers.io/MAIN/MAIN-2024-06-14.html Home