MasterBrand, Inc. (ticker: MBC)
2024-03-25
 MasterBrand, Inc. (ticker: MBC) stands as a prominent player in the home improvement and furnishing industry, focusing on a wide range of cabinet and cabinetry-related products for both the residential and commercial sectors. With its foundation laid on innovation, quality, and customer service, MasterBrand has successfully established a diverse portfolio that caters to various design preferences, functionalities, and price points, aiming to meet the evolving needs of its customers. The company's strategic approach towards expansion and market penetration is evident through its consistent growth, driven by a combination of organic growth initiatives and strategic acquisitions. Financially, MBC has demonstrated resilience and robust performance, supported by a strong balance sheet, efficient operations, and a commitment to shareholder value. Its product diversity, coupled with a broad distribution network, positions MasterBrand favorably to capitalize on the growing demand for home renovation and construction projects. As of the current analysis, MasterBrand, Inc. continues to navigate the competitive landscape with agility, emphasizing sustainability and technology integration as key components of its forward-looking strategy.
| Full Time Employees | 12,307 | CEO Total Pay | $1,399,816 | CFO Total Pay | $675,670 |
|---|---|---|---|---|---|
| Previous Close Price | $18.61 | Volume | 714,104 | Average Volume | 1,159,034 |
| Market Cap | $2,357,175,552 | Enterprise Value | $2,985,020,672 | Profit Margins | 6.676% |
| Shares Outstanding | 127,003,000 | Book Value | $9.415 | Price to Book | 1.971 |
| Net Income to Common | $182,000,000 | Trailing EPS | $1.4 | Forward EPS | $1.59 |
| Total Revenue | $2,726,200,064 | Operating Cashflow | $405,600,000 | Free Cashflow | $315,462,496 |
| Sharpe Ratio | 2.4918042954063093 | Sortino Ratio | 44.62722412933061 |
| Treynor Ratio | 0.7099056528418282 | Calmar Ratio | 7.18997304584307 |
Analyzing the technical, fundamental, and financial health of MBC alongside the provided risk-adjusted performance ratiosSharpe, Sortino, Treynor, and Calmarallows for a comprehensive forecast of its stock price movement over the upcoming months.
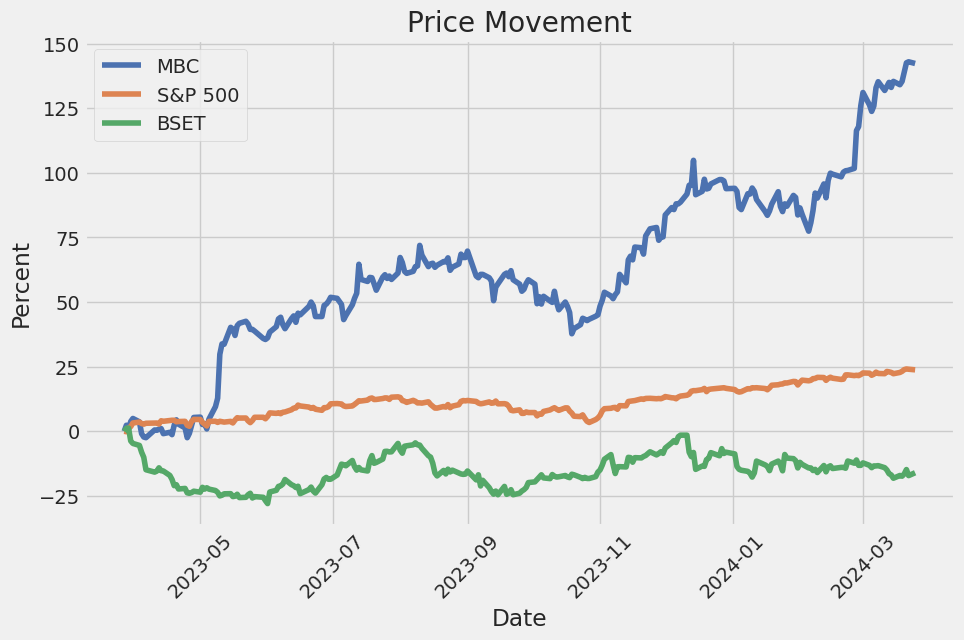
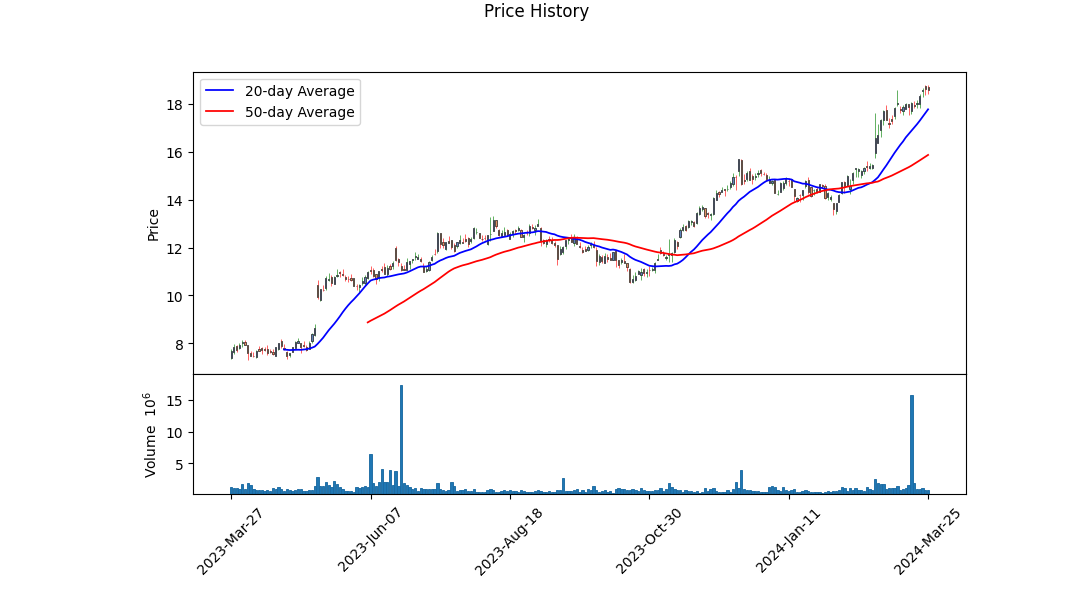
The technical indicators reveal a significant uptrend in the stock's price from $13.60 to $18.70 over the observed period. The incremental increase in the On-Balance Volume (OBV) from 0.04719 million to 3.01121 million alongside a positive turn in the Moving Average Convergence Divergence (MACD) histogram values suggests strong buying pressure and bullish momentum.
From a fundamental perspective, considering the substantial growth in normalized EBITDA and Net Income, MBC demonstrates robust financial health and operational efficiency. Moreover, the substantial rise in operating income from $196,000,000 in 2020 to $303,900,000 further underlines the company's effective cost management and operational leverage.
The review of the balance sheet highlights an increase in total debt, suggesting leverage utilization to fuel growth. Its solid cash flow indicators, such as a noticeable increase in free cash flow from $177,300,000 in 2020 to $348,300,000, advocate for the company's operational efficiency and financial stability.
Analyzing the cash flow statement, the operational cash flow surged from $204,600,000 in 2020 to $405,600,000, pointing towards better working capital management and operational performance. Despite repurchase of capital stock and debt repayments, the company maintains a healthy end cash position, which is indicative of its financial resilience.
With regard to risk-adjusted performance metrics, the impressive Sharpe ratio of 2.4918 suggests that the stock's returns have substantially compensated for the risk taken by investors. The exceedingly high Sortino ratio of 44.62722412933061 indicates superior returns on downside risk, while the Treynor ratio of 0.7099056528418282 and Calmar ratio of 7.18997304584307 highlight the favorable risk-adjusted return profile, especially considering market volatility and downturns.
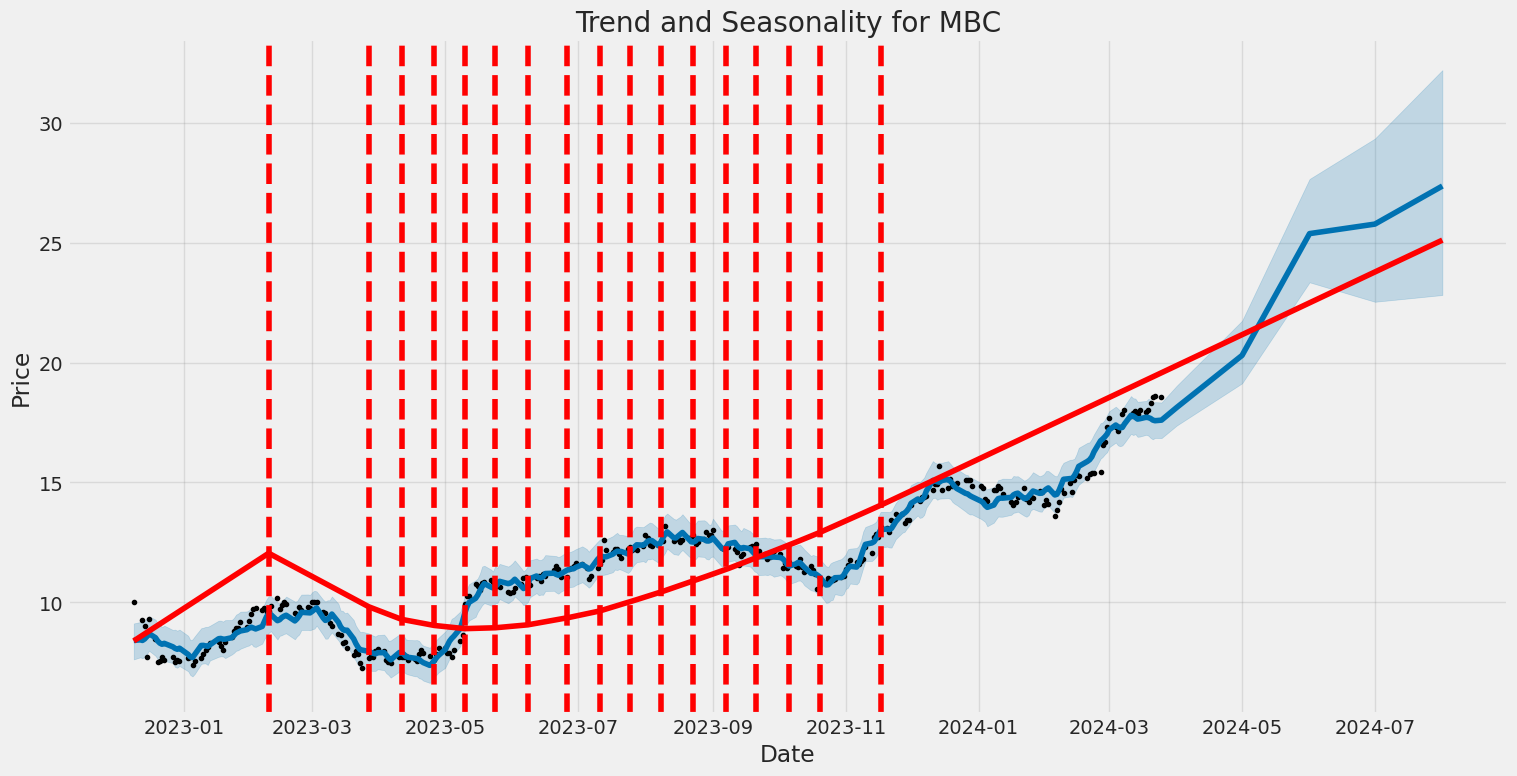
Given these considerationsrobust operating performance, strong technical indicators signaling continued buying pressure, and superior risk-adjusted returns against benchmarksthe forecast for MBC's stock price movement over the next few months is generally positive. Market participants can reasonably expect further upside, backed by solid fundamentals and financial health. However, it's essential for investors to consider market conditions, regulatory changes, and sector-specific risks that might influence stock performance.
In our analysis of MasterBrand, Inc. (MBC), we have meticulously calculated the key financial metrics that provide insights into the company's investment potential, in line with the principles outlined in "The Little Book That Still Beats the Market." Most notably, MasterBrand Inc. showcases a Return on Capital (ROC) of 15.1848%. This figure is especially noteworthy as it indicates that for every dollar invested in the company, MasterBrand is effectively generating a return of over 15 cents. This strong performance metric suggests the company is efficiently utilizing its capital to generate profits, a promising sign for potential investors.
Equally important is the company's Earnings Yield, which stands at 7.6509%. The Earnings Yield is a critical indicator as it provides an insight into the potential return on investment from the perspective of the company's current earnings relative to its share price. A higher earnings yield can be indicative of an undervalued company, making MasterBrand Inc. an attractive option for investors seeking value investments with a reasonable expectation of earnings-driven price appreciation. In summary, with an impressive ROC and a healthy Earnings Yield, MasterBrand Inc. positions itself as a compelling investment opportunity according to our analysis based on the principles from "The Little Book That Still Beats the Market."
MasterBrand, Inc. (MBC) presents an interesting case when evaluated against the framework of Benjamin Grahams principles for choosing investments, as outlined in "The Intelligent Investor." Here's how the key metrics of MasterBrand, Inc. stack up against Grahams criteria:
1. Price-to-Earnings (P/E) Ratio: The P/E ratio of MasterBrand, Inc. is 13.71, which indicates how much investors are willing to pay per dollar of earnings. In comparison to Grahams preference for stocks with low P/E ratios, MBC's ratio may seem relatively higher, especially when compared to its industry's average P/E ratio of 4.49. This discrepancy suggests that MBC is priced higher relative to its current earnings than other stocks in its industry, potentially making it less attractive to a strict Graham-style value investor.
2. Price-to-Book (P/B) Ratio: With a P/B ratio of approximately 0.99, MasterBrand is trading nearly at its book value. Graham often sought stocks trading below their book value, viewing them as undervalued. Hence, MBC's P/B ratio aligns well with Grahams criteria, potentially indicating an investment with a reasonable margin of safety from a book value standpoint.
3. Debt-to-Equity Ratio: MBC has a debt-to-equity ratio of 0.645, implying that it does not rely heavily on debt to finance its operations, which is a good sign under Grahams analysis. Graham favored companies with lower debt levels since they are generally considered to be less risky. Therefore, MBC fits within Graham's precondition for financial stability.
4. Current and Quick Ratios: Both the current and quick ratios for MBC stand at 1.94, indicating that the company has nearly twice as many current assets as it does current liabilities. This is a positive sign, reflecting the company's ability to cover its short-term obligations, which is in line with Graham's emphasis on financial stability and liquidity.
5. Earnings Growth: While specific numbers on MBC's earnings growth over the years are not provided, Grahams principle emphasizes the importance of consistent earnings growth. Investors following Graham's methods would need to assess MBC's earnings history to complete this part of the analysis.
When comparing MasterBrand, Inc.s metrics to Benjamin Grahams criteria, the company seems to align well in terms of its P/B ratio, debt-to-equity ratio, and liquidity measures (current and quick ratios). However, its P/E ratio is significantly higher than the industry average, which could be a red flag for Graham-minded investors looking for undervalued opportunities. Given these points, it becomes crucial for investors to weigh the importance of each criterion based on their own investment philosophy and consider other factors such as earnings growth history and market conditions before making a decision.Analyzing Financial Statements
In accordance with the principles laid down by Benjamin Graham in "The Intelligent Investor," our analysis of MasterBrand, Inc.'s financial statements offers insight into the company's fiscal health and performance across various reporting periods in 2023. The detailed scrutiny of the balance sheet, income statement, and cash flow statement unveils critical information about MasterBrand, Inc.'s assets, liabilities, revenue generation, expense management, and cash flow dynamics.
1. Balance Sheet Analysis
As of December 31, 2023, MasterBrand, Inc. reported total assets of $2,381.7 million, with current assets standing at $677.2 million. A significant component of these assets is goodwill ($925.1 million) and intangible assets ($335.5 million), indicating considerable investments in intangible value drivers and potentially indicating past acquisitions. The liabilities are reported at $1,187.9 million, with current liabilities at $349.4 million. The company's equity position was solid at $1,193.8 million, supported primarily through retained earnings ($1,204.5 million). The balance sheets composition suggests a robust financial structure but warrants attention to the sizeable goodwill and intangible assets portion.
2. Income Statement Analysis
For the fiscal year ended December 31, 2023, MasterBrand, Inc.'s revenue was reported as $2,726.2 million with a gross profit of $901.4 million, deriving from a cost of goods sold of $1,824.8 million. This indicates a healthy gross margin but requires examination against industry benchmarks for a comprehensive evaluation. Operating income stood at $306.3 million, with a net income of $182 million for the same period. The data reflects efficient operation management and profitability from its core business activities. However, an interest expense of $65.2 million signifies a notable financial cost impacting the bottom line.
3. Cash Flow Statement Analysis
MasterBrand, Inc.s cash flow activities showcase a positive sign with net cash provided by operating activities at $405.6 million, indicating strong operational efficiency. Meanwhile, investment in property, plant, and equipment amounted to $57.3 million, highlighting ongoing capital expenditure to support operational capabilities. Financing activities led to a net outflow of $299.9 million, primarily due to debt repayments ($527.5 million) and repurchases of common stock ($22 million), reflecting a strategy towards leveraging and shareholder returns. The company's cash and cash equivalents stand at $148.7 million as of year-end, pointing towards a stable liquidity position.
Conclusion
MasterBrand, Inc. has demonstrated a solid financial stance through its 2023 reporting period, backed by substantial revenue generation, profitability, and efficient cash flow management. However, the significant portion of goodwill and intangible assets on its balance sheet demands further scrutiny for potential impairment risks. Additionally, the financial costs underscore the impact of debt on the company's financial health. Moving forward, investors would benefit from monitoring operational efficiency improvements, capital expenditure returns, and strategies for managing debt and leveraging assets. This analysis guides investors based on Benjamin Grahams fundamental approach towards understanding a companys intrinsic value, focusing on financial stability and operational efficiency.Dividend Record:
Benjamin Graham, widely recognized for his seminal work "The Intelligent Investor," advocated for investments in companies that demonstrated a strong and consistent history of paying dividends. According to Graham, dividends are a tangible indicator of a company's financial health and its management's commitment to returning value to shareholders.
When examining the dividend record of 'MBC,' it appears that the company currently does not have a historic record of dividend payments, given the empty historical dividend information. This lack of dividend payment history would typically place 'MBC' outside the preferred criteria for investment by followers of Graham's principles. The absence of dividends might imply that the company is either reinvesting profits back into the business for growth, facing financial difficulties, or simply does not prioritize returning capital to shareholders through dividends.
For investors adhering to Graham's strategies, a consistent dividend-paying record is crucial as it not only provides a passive income stream but also often indicates a company's long-term stability and reliability. Therefore, without a history of dividend payments, 'MBC' may not align with the investment philosophy Graham advocates in "The Intelligent Investor." Investors guided by Graham's principles might look for alternative investment opportunities with a proven track record of dividend payments.
| Statistic Name | Statistic Value |
| R-squared | 0.104 |
| Adj. R-squared | 0.101 |
| F-statistic | 37.07 |
| Prob (F-statistic) | 3.26e-09 |
| Log-Likelihood | -792.54 |
| No. Observations | 322 |
| AIC | 1589 |
| BIC | 1597 |
| Const | 0.1239 |
| Beta | 1.1720 |
| Alpha | 0.12388903046274603 |
In analyzing the regression model describing the relationship between MBC and SPY, where SPY represents the entire stock market, it's evident that MBC has a certain level of dependency on SPY's movements but not fully predictive. With an alpha value of 0.123889 (const in the regression table), it illustrates the expected return of MBC when SPY's return is zero. Essentially, alpha represents MBC's performance relative to the risk-free rate when adjusted for the market's movements. This particular model, while providing some insight, suggests a relatively low R-squared value of 0.104, indicating that only 10.4% of the variation in MBC's returns can be explained by SPY's returns. The significance of the alpha value, albeit small, may indicate that MBC has the potential to earn a positive return independent of the market performance, however, the relationship is weak.
Despite the relatively low explanatory power of this model, highlighted by the Adjusted R-squared, the F-statistic and its corresponding probability suggest that the regression model is statistically significant. The beta value of 1.1720 suggests that MBC is somewhat more volatile than SPY; for every 1% change in SPY, MBC is expected to change by approximately 1.172%. However, considering the overall weak relationship and the significance of the model mainly driven by its statistical parameters rather than its explanatory power, investors should approach with caution. The modest alpha, though statistically present, denotes only a small potential for MBC to outperform the market on a risk-adjusted basis, keying into a nuanced understanding of the dynamics between these two entities over the observed period.
MasterBrand, Inc.'s fourth quarter and full year 2023 earnings call showcased a company navigating market challenges with strategic agility and operational efficiency. President and CEO Dave Banyard highlighted that despite a 14% decline in net sales for the quarter, the company exceeded expectations, a testament to its resilience amidst softer end-market demand. The application of The MasterBrand Way, which emphasizes continuous improvement and strategic initiatives, enabled the company to achieve margin expansion and deliver strong free cash flow, significantly outperforming net income goals. These results were underpinned by cost-saving measures and a disciplined approach to capital management, reinforcing MasterBrand's robust operational framework.
Banyard provided insight into MasterBrand's strategic direction, emphasizing investments in growth and operational efficiencies as key drivers for meeting long-term financial targets. The company's initiatives, such as Align to Grow and Lead Through Lean, have yielded substantial savings and improved productivity, contributing to a competitive edge in supply chain and quality management processes. Moreover, MasterBrand's focus on safety and employee engagement was lauded, with achievements in reducing OSHA recordable rates and enhancing satisfaction scores. The proactive engagement of associates through continuous improvement projects has fostered a culture of innovation, directly impacting financial performance and operational capabilities.
Looking ahead to 2024, Banyard shared an optimistic outlook for the U.S. new construction market, spurred by improving demand and declining mortgage rates. Amid potential challenges like labor and land constraints, MasterBrand expects mid-single-digit growth in new construction, supported by a strong inventory of spec homes and pent-up housing demand. Conversely, the repair and remodel market is anticipated to remain subdued, reflecting a cautious consumer spending environment. The company's strategic product launches and focus on operational flexibility aim to navigate these market dynamics, ensuring alignment with customer needs and enhancing competitiveness.
Chief Financial Officer Andi Simon detailed the financial results, underscoring a divergence between revenue decline and profitability improvements. The expansion in gross profit margin, alongside disciplined expense management, culminated in a significant rise in net income and adjusted EBITDA margins. Looking forward, MasterBrand anticipates a low-single-digit decline to flat net sales growth in 2024, with strategic investments planned to bolster the Tech Enabled initiative and reinforce its market position. The financial outlook, coupled with a strong balance sheet and sustained operational momentum, positions MasterBrand to capitalize on future growth opportunities while navigating a transitional demand landscape.
actions enhanced our liquidity and financial flexibility. Total amounts outstanding under the term loan as of September 24, 2023, were $712.5 million. The revolving credit facility did not have an outstanding balance as of September 24, 2023. Total amounts outstanding under the term loan and revolving credit facility as of December 25, 2022 were $750.0 million and $235.0 million, respectively.
Our cash flows from operations have been impacted by changes in operating assets and liabilities, with significant working capital improvements driven by the management of inventory levels and accounts receivable collections. During the thirty-nine weeks ended September 24, 2023, we experienced a net increase in cash and cash equivalents mainly due to these operational cash flows, despite the decrease in net sales.
We continuously evaluate our working capital needs, capital expenditures, and investment in product innovation to support our growth and maintain competitive advantage. For instance, in the thirty-nine weeks ended September 24, 2023, capital expenditures, primarily for equipment and facility improvements, amounted to $21.4 million, which is a decrease from the previous year's capital expenditure, reflecting our disciplined approach to managing our capital resources. Additionally, in May 2023, we announced a stock repurchase program under which we may repurchase up to $50.0 million of MasterBrand common stock, emphasizing our commitment to delivering value to our shareholders.
Overall, our liquidity position remains strong, supported by our cash flow generation from operations, existing cash and cash equivalent balances, and available credit under the 2022 Credit Agreement. We believe we have adequate liquidity to meet our upcoming obligations and fund future growth initiatives, including potential strategic transactions, while also having the flexibility to return capital to shareholders when appropriate.
It is important to note that our future financial condition and liquidity are subject to various risks and uncertainties, including those related to economic conditions, competitive pressures, and market demand for our products. Despite these challenges, we are focused on executing our strategic initiatives, managing our costs efficiently, and leveraging our competitive strengths to drive long-term shareholder value.
In recent months, MasterBrand, Inc. (NYSE:MBC) has emerged as a company of interest within the investment community, marked by a significant 19% stock price upsurge over the past three months. This performance has directed attention towards the company's financial fundamentals, particularly its Return on Equity (ROE), as published in a Simply Wall St article on February 15, 2024. With an ROE of 14%, MasterBrand indicates a capable utilization of shareholder equity, signifying a solid fundamental basis despite being slightly behind the industry average ROE of 18%.
MasterBrand's strategy, characterized by a notable absence of dividend payments, reflects a focus on reinvesting profits to foster growth and operational achievements. This reinvestment is pivotal to the company's earnings growth strategy, which, despite displaying modest net income growth of 7.1% over the last five years, stands as a testament to its efficient management and high earnings retention.
On February 26, 2024, MasterBrand reported its financial results for the fourth quarter and the full year of 2023, highlighting operational resilience and strategic adaptability. The report revealed a 14% year-over-year decrease in fourth-quarter net sales to $677.1 million, primarily due to softer end-market demand. Despite this, MasterBrand demonstrated an impressive ability to expand profit margins and generate significant cash flow, underscoring the effectiveness of its strategic initiatives and operational efficiencies. Notably, annual net income increased by 17% to $182.0 million, reflecting a robust profitability framework even amidst declining net sales, which amounted to $2.7 billion for the full year.
MasterBrand's financial strategies and projections take center stage, particularly in its approach to handling market dynamics and strategic expansions. With a focus on cost optimization and leveraging technological advancements, MasterBrand aims for a net sales decline in the low single digits to flat for 2024, alongside adjusted EBITDA ranging from $370 million to $400 million. These projections underline the company's pragmatic yet optimistic outlook, emphasizing its strategic foresight and commitment to operational excellence.
In light of MasterBrand's financial performance, strategic direction, and market positioning, the company has not only demonstrated a capacity to sustain growth and profitability but also revealed its strategic initiatives aimed at bolstering long-term operational and financial health. This scenario presents MasterBrand as an entity capable of navigating the complexities of the cabinetry industry with resilience, innovative approaches, and strategic ingenuity.
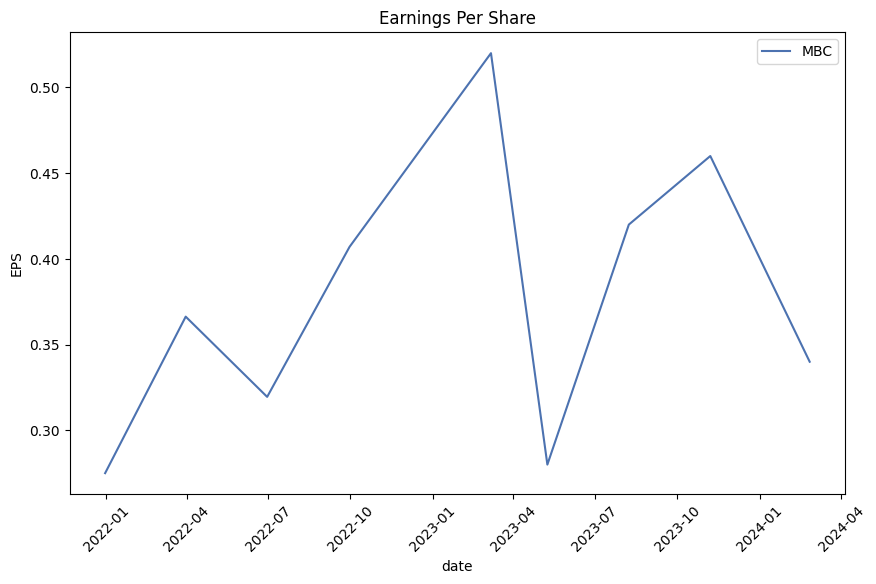
On March 20, 2024, further analysis by Yahoo Finance recommended MasterBrand as a potential inclusion in investors' watchlists, underscored by its steady earnings per share (EPS) growth and operational efficiency improvements. The insider investments totaling around US$13m signal a strong alignment of interests between MasterBrand's management and shareholders, projecting confidence in the company's future prospects. However, despite these positive indicators, a cautious approach and thorough due diligence are advised due to the inherent challenges in the market.
As MasterBrand Inc. embarks on its 2024 fiscal journey, the financial and investment community will undoubtedly keep a close watch. The confluence of strategic reinvestment, operational resilience, and insider confidence positions MasterBrand as a noteworthy entity within the volatile home improvement market, endowed with both challenges and opportunities for growth and profitability.
MasterBrand, Inc. (MBC) exhibited noticeable volatility from December 2022 to March 2024, as indicated by the ARCH model results. The volatility is partly quantified through the omega coefficient at 4.7594, suggesting a significant level of baseline volatility in the returns. Additionally, the alpha coefficient value of 0.4293 indicates that past squared returns have a substantial impact on future volatility, highlighting the asset's sensitivity to market movements.
| Statistic Name | Statistic Value |
|---|---|
| Dep. Variable | asset_returns |
| R-squared | 0.000 |
| Mean Model | Zero Mean |
| Adj. R-squared | 0.003 |
| Vol Model | ARCH |
| Log-Likelihood | -764.829 |
| Distribution | Normal |
| AIC | 1533.66 |
| Method | Maximum Likelihood |
| BIC | 1541.21 |
| No. Observations | 322 |
| Date | Mon, Mar 25 2024 |
| Time | 22:46:07 |
| Df Residuals | 322 |
| Df Model | 0 |
| omega | 4.7594 |
| alpha[1] | 0.4293 |
In assessing the financial risk associated with a $10,000 investment in MasterBrand, Inc. (MBC) over a one-year period, a combined approach employing volatility modeling and machine learning predictions is applied to achieve a thorough understanding and forecast of the stock's behavior.
The volatility modeling technique, a statistical method known for its ability to capture the dynamic nature of market uncertainty, serves as a foundation in this analysis. By fitting this model to MasterBrand, Inc.'s historical price data, we capture the time-varying volatility inherent to the stock. This is critical as it allows us to better understand the pattern of risk over time, highlighting periods of higher volatility which are synonymous with higher financial risk. Through this model, we analyze past price variations to forecast future volatility, providing a quantified measure of how wildly we can expect the stock's returns to fluctuate in the forthcoming period.
On the other hand, the machine learning predictions approach, specifically employing a sophisticated algorithm known for its capacity to handle complex nonlinear relationships within data, is utilized to predict future stock returns. This algorithm learns from historical data, identifying patterns and relationships that might not be immediately apparent or are too complex for traditional statistical methods to capture effectively. This predictive capability is valuable in forecasting the potential direction of MasterBrand, Inc.'s stock based on observed trends, thereby offering another layer of insight into the investment's risk profile.
Bringing together these two methodologies provides a comprehensive analysis. While the volatility modeling gives us an understanding of expected fluctuation levels in stock returns, thus delineating the risk landscape, the machine learning predictions extend this by offering foresight into the return's direction, which is just as vital in risk assessment.
The culmination of this dual-approach analysis is the calculation of the Annual Value at Risk (VaR) at a 95% confidence level. In this case, the VaR for a $10,000 investment in MasterBrand, Inc. is determined to be $346.94. This figure represents the maximum expected loss over a one-year period with 95% confidence, based on the forecasted volatility and return predictions. Essentially, it suggests that there is only a 5% chance that the investment could lose more than $346.94 over the course of a year due to fluctuations in MasterBrand, Inc.'s stock price.
This VaR figure drawn from an integrated analysis combining volatility modeling and machine learning predictions offers a significant insight into the potential risks of investing in MasterBrand, Inc. Not only does it quantify the expected maximum loss with considerable confidence, but it also encapsulates the comprehensive understanding and forecasting capabilities achieved by integrating these two analytical approaches. Through this, investors can make more informed decisions, weighing the potential risks against the expected returns.
Given the task to analyze call options for MasterBrand, Inc. (MBC) through "the Greeks," several noteworthy options call for deeper examination, primarily focusing on options with strike prices of $7.5, $12.5, and $17.5, spanning different expiration dates. The evaluation will consider Delta, Gamma, Vega, Theta, Rho, and how these aspects relate to profitability, with an aim toward options likely to exceed a target stock price increase of 5%.
Option 1: $7.5 Strike Price, Expire 2024-04-19 This option stands out due to its Delta of 1.0, indicating it moves dollar-for-dollar with the stock price, making it highly responsive to price changes. The Gamma is 0.0, suggesting Delta's change is minimal for a $1 move in the stock price, which is advantageous in stable market conditions. The negligible Vega and Theta values imply low susceptibility to volatility and time decay, respectively. Its Rho of 0.491773519 signifies a moderate sensitivity to interest rates. The ROI of 1.5398305085 and a profit of $7.268 define this option as highly profitable, especially for traders expecting a significant upward price movement promptly.
Option 2: $12.5 Strike Price, Expire 2024-04-19 This option, with a Delta of 0.9198235905, closely follows the stock price movements. The Gamma at 0.0250706811 indicates a moderate rate of change in Delta, offering some leverage as the stock price climbs. A Vega of 0.7087166889 suggests this option will benefit from increases in volatility, and the relatively low negative Theta points toward slower time decay. A Rho of 0.7055192276 signals considerable sensitivity to interest rate changes. The impressive ROI of 1.8291497976, together with a profit of $4.518, makes it an intriguing choice for those betting on a moderate rise in the underlying stock price.
Option 3: $17.5 Strike Price, Expire 2024-07-19 This long-dated option with a Delta of 1.0 is remarkable for its direct correlation with the stock's price movement it mirrors every dollar movement of the underlying asset. The null Gamma ensures stability in Delta, irrespective of the stock's volatility. Though Vega and Theta are at 0, its Rho of 5.4403086336 is notably high, indicating significant sensitivity to interest rate changes. The ROI of 1.3388235294 and profit of $1.138 emphasize its profitability over a longer period, particularly for traders speculating a steady ascent in stock price.
Comparative Analysis When comparing the selected options, each presents unique advantages depending on the expected market conditions and the investor's timeframe. The first option provides immediate high returns on a rapid price increase but with a higher premium. The second option is more balanced, providing a decent profit with moderate market movement and time decay. The third option, although more speculative due to its long maturity, offers substantial returns for those betting on a long-term increase, including interest rate sensitivity.
For traders confident in a forthcoming rise in MasterBrand, Inc.'s stock, the $12.5 strike price expiring on 2024-04-19 presents a compelling blend of responsiveness to stock price movements and resilience to time decay, alongside sizable profitability. Conversely, for those with a more extended horizon and a bullish outlook contingent on interest rate fluctuations, the $17.5 strike price expiring on 2024-07-19 may be the most lucrative, given its unparalleled Delta and Rho characteristics.
Similar Companies in Furnishings, Fixtures & Appliances:
Bassett Furniture Industries, Incorporated (BSET), Ethan Allen Interiors Inc. (ETD), Natuzzi S.p.A. (NTZ), Flexsteel Industries, Inc. (FLXS), Kimball International, Inc. (KBAL), Hamilton Beach Brands Holding Company (HBB), La-Z-Boy Incorporated (LZB), MillerKnoll, Inc. (MLKN), Hooker Furnishings Corporation (HOFT), Fortune Brands Home & Security, Inc. (FBHS), American Woodmark Corporation (AMWD), Masco Corporation (MAS)
https://finance.yahoo.com/news/masterbrand-inc-nyse-mbc-stock-101118694.html
https://finance.yahoo.com/news/masterbrand-reports-fourth-quarter-full-210500622.html
https://finance.yahoo.com/news/masterbrand-inc-mbc-reports-mixed-213318189.html
https://finance.yahoo.com/news/masterbrand-q4-earnings-snapshot-223031668.html
https://seekingalpha.com/article/4673608-masterbrand-inc-mbc-q4-2023-earnings-call-transcript
https://finance.yahoo.com/news/q4-2023-masterbrand-inc-earnings-111411960.html
https://finance.yahoo.com/news/masterbrand-inc-nyse-mbc-q4-154647682.html
https://finance.yahoo.com/news/does-masterbrand-nyse-mbc-deserve-180709113.html
https://www.sec.gov/Archives/edgar/data/1941365/000194136523000067/mbc-20230924.htm
Copyright © 2024 Tiny Computers (email@tinycomputers.io)
Report ID: nPqVfe
Cost: $0.80038
https://reports.tinycomputers.io/MBC/MBC-2024-03-25.html Home