Nextra Energy, Inc. (ticker: NEE)
2023-12-17
 NextEra Energy, Inc. (ticker: NEE) is a leading energy company headquartered in Juno Beach, Florida, recognized for its extensive involvement in the renewable energy sector, notably in wind and solar power generation. As one of the largest electric power and energy infrastructure companies in North America, NEE operates through its subsidiaries, including Florida Power & Light Company (FPL), which serves millions of customers in Florida, and NextEra Energy Resources, which is amongst the world's most significant producers of renewable energy from the wind and sun. With its focus on investment in sustainable energy solutions and innovative technologies, NextEra Energy has garnered attention for its growth prospects in the utility industry. Moreover, NEE has a robust financial performance and a steady dividend track record, making it an attractive stock for investors interested in both growth and income. The company's commitment to clean energy aligns with global trends towards reducing carbon emissions, positioning it as a pivotal player in the transition to a more sustainable energy future.
| As of Date: 12/17/2023Current | 9/30/2023 | 6/30/2023 | 3/31/2023 | 12/31/2022 | 9/30/2022 | |
|---|---|---|---|---|---|---|
| Market Cap (intraday) | 126.18B | 115.94B | 150.16B | 155.97B | 166.13B | 155.81B |
| Enterprise Value | 197.93B | 186.53B | 218.53B | 219.33B | 228.44B | 216.54B |
| Trailing P/E | 16.23 | 14.15 | 22.02 | 36.70 | 43.09 | 60.32 |
| Forward P/E | 18.08 | 16.86 | 23.92 | 24.69 | 27.25 | 25.51 |
| PEG Ratio (5 yr expected) | 2.48 | 1.37 | 1.97 | 2.57 | 2.14 | 2.01 |
| Price/Sales (ttm) | 4.52 | 4.25 | 5.95 | 7.28 | 8.32 | 8.85 |
| Price/Book (mrq) | 2.68 | 2.59 | 3.50 | 3.98 | 4.30 | 4.28 |
| Enterprise Value/Revenue | 7.22 | 26.01 | 29.74 | 32.66 | 37.06 | 32.23 |
| Enterprise Value/EBITDA | 12.49 | 61.66 | 46.03 | 51.64 | 64.75 | 61.92 |
 Based on the provided technical indicators and fundamental analysis for NextEra Energy Inc. (NEE), the following observations can be made regarding the stock's performance and potential future price movements:
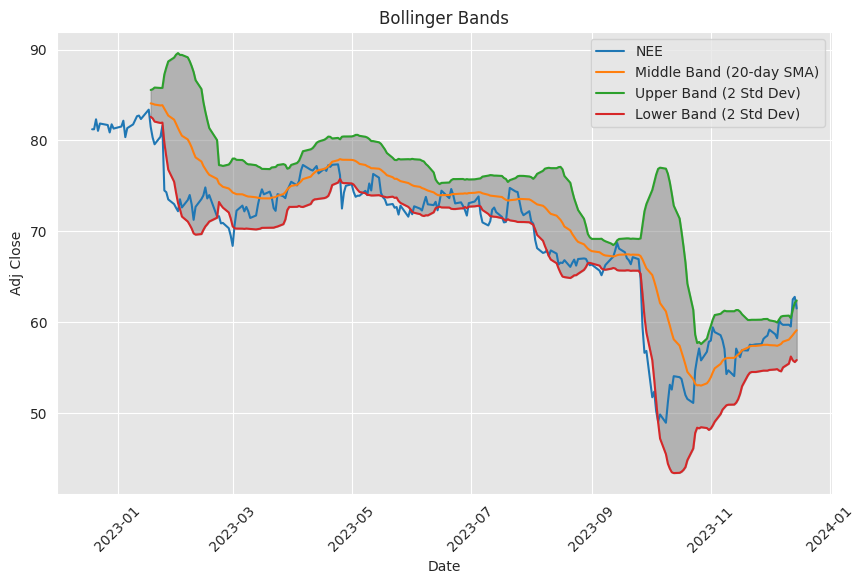
Technical Indicators: - The Adjusted Closing Price stands at $61.50. - MACD (Moving Average Convergence Divergence) is positive, with a value of 1.15079 and a MACD histogram value of 0.34432, indicating a bullish momentum in the short term. - RSI (Relative Strength Index) is at 61.87, which is neither in the oversold nor overbought territory but is tilting towards the higher side, suggesting some buying pressure. - Bollinger Bands show the price is currently between the middle band (BBM_5_2.0 at $61.203999) and the upper band (BBU_5_2.0 at $63.938214), which can indicate a continuation of the current trend if the price remains above the middle band. - The price is above both the 20-day Simple Moving Average (SMA_20 at $59.108000) and the 50-day Exponential Moving Average (EMA_50 at $59.423456), which is a sign of a positive trend. - The On Balance Volume (OBV) indicator is negative at -9.784830 million, which typically would suggest a lack of volume support for the current price trend. - STOCH indicators (STOCHk_14_3_3 at 77.609419 and STOCHd_14_3_3 at 80.820658) are in the upper range but not in the overbought territory, suggesting that the price might still have some room to move upwards. - ADX (Average Directional Index) stands at 24.783775, showing a moderate trend strength. - Williams %R (WILLR_14) is at -42.155487, indicating the stock is neither overbought nor oversold. - The Chaikin Money Flow (CMF_20) at 0.178567 is positive, suggesting buying pressure and potential accumulation of the stock. - Parabolic SAR (PSAR) indicates a bullish trend as the PSARl_0.02_0.2 value is below the current price, while there is no PSARs value to suggest the start of a potential downtrend.
Fundamentals: - Market Cap has decreased to $126.18B from $166.13B at the end of the previous year, indicating a reduction in the market's valuation of the company. - A lower Trailing P/E of 16.23, compared to 43.09 at the end of the last year, suggests the stock has become more attractively priced relative to its earnings. - The Forward P/E ratio has increased slightly, suggesting higher anticipated future earnings. - Despite a decreasing enterprise value, the EV/Revenue and EV/EBITDA ratios remain relatively high and have shown reductions from previous periods, which may imply that the market is expecting operational efficiency improvements. - Financial statements reveal stable income figures and significant gross profit, although with sizable operating expenses.
Considering the positive trend indicated by the technical indicators, namely MACD, RSI, Bollinger Bands, SMA, EMA, and PSAR, along with the moderate ADX trend strength, the stock price movement for NEE appears to be cautiously positive in the short term. The STOCH indicators and positive CMF further support this upward momentum.
However, the reduction in Market Cap and issues pointed out by the OBV may serve as potential red flags for medium to long-term sustainability of the current uptrend. Fundamentally, the reduction in Trailing P/E is attractive, but it must be weighted against the reduction in market cap and potentially optimistic Forward P/E.
The fundamental financials portray a company with robust earnings and operating revenue which has the potential to back up the current price levels. However, the financial health needs to be continually monitored as any shifts in financial stability or market sentiment could disrupt the current trajectory.
Taking a conservative view, in the next few months, the stock is likely to adhere to the current momentum, with possible fluctuations around the observed support and resistance levels defined by the technical indicators. The underlying fundamentals will serve as critical checkpoints to ensure the maintenance of investor sentiment. Investors should watch for any changes in fundamentals and market conditions that could affect the stock's trajectory in subsequent periods.
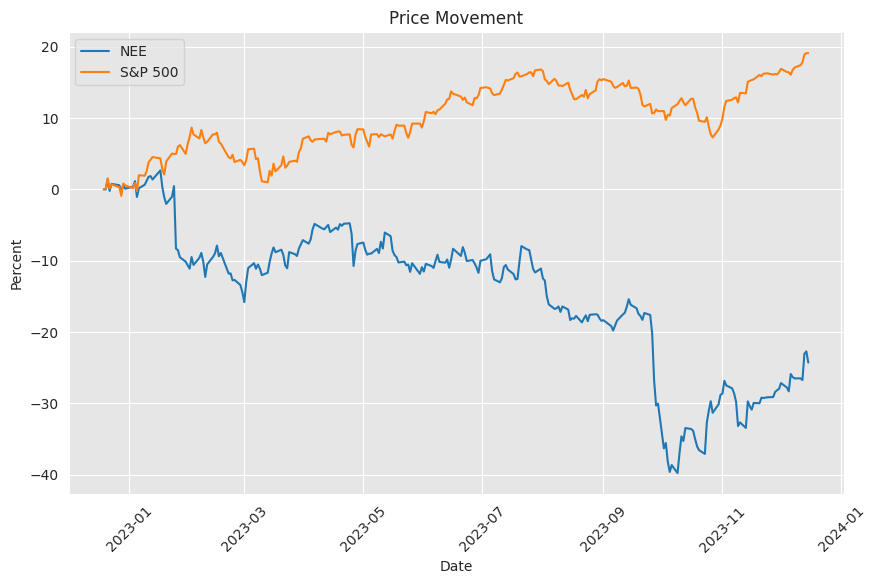
NextEra Energy, Inc. (NEE) represents a significant investment opportunity, especially when one considers broader market trends and specific industry developments. As we progressed through 2023, NEE's performance ought to be examined not only in isolation but also in relation to these wider trends and juxtaposed with other industry stalwarts like Verizon Communications Inc. (VZ). While tech stocks, particularly the so-called Magnificent 7, dazzled the markets with remarkable returns, traditional high-dividend-yielding stocks such as Verizon faced challenges. The increasing bond yields posed competitive options for income-seeking investors traditionally inclined towards equities like Verizon, which reported a 7% dividend yield at the end of Q3 2023.
Verizon notably showcased resilience through a strong performance in key growth areas like mobility and broadband. Its third-quarter results boasted revenues of $33.3 billion, with wireless service revenue growing 2.9% year over year. Similarities can be drawn between Verizon and NextEra Energy in that both companies have historically offered robust dividend growth and operational excellence in their respective industries.
NextEra Energy, during the same period, has demonstrated notable financial prudence and a keen ability to grow its renewables portfolio while maintaining its record of consistent dividend payouts. Despite the whims of the investment environment, which fluctuated throughout the year, NextEra Energy showed promise due to its operational strength and potential market undervaluation.
NextEra Energy's strategy to trim its debt obligations has been well-received by the market. This strategy is crucial, given the transition challenges in the energy sector and the capital requirements needed for the shift to sustainable energy sources. As the investment climate evolves, the possibility of a Federal Reserve's rate cut could bring high-yield stocks like NEE back into the spotlight, particularly since they could benefit from a potential reduction in interest rates.
NextEra Energy, as a renowned energy enterprise, has consistently raised its dividends annually for nearly three decades. This achievement is reflective of a calculated approach that combines regulated utility operations that benefit from Florida's population growth with ambitious renewable energy initiatives. The company's formidable green energy production position is set to expand, with capacity potentially increasing significantly in the coming years.
Moreover, management's confidence in the utility's growth prospects is reflected in their forecast of a continual 10% dividend increase supported by robust earnings growth between 6% and 8%. Despite this, the broader energy sector witnessed underperformance, with NextEra Energy's financial results showing resilience and an indication of leadership within the industry heading into 2024.
Interest rates have indeed been central to the performance of renewable energy stocks, with NextEra Energy, Inc. witnessing an uptick alongside other companies in this sector as rates dipped. These reductions in yields signal more favorable financing conditions for capital-intensive renewable energy projects, potentially boosting investor confidence and project economics.
NextEra Energy Partners, a subsidiary of NextEra Energy with a focus on clean energy projects, faced challenges with rising debt costs. A refinancing effort significantly increased the cost of servicing a portion of its debt. This scenario showcases the broader implications of fluctuating interest rates and raises concerns about the financial health and strategic direction of energy firms heavily reliant on debt financing.
Within the wider utility sector, NextEra Energy garners attention due to its size and renewable energy investments. Despite underperformance across the sector, partly driven by higher Treasury yields, NextEra's emphasis on clean energy may well position it for success should economic factors like potential Federal rate cuts play out favorably. The company's strong compound adjusted earnings-per-share growth against the backdrop of lower electricity generation costs propels its stature within the industry.
NextEra Energy Partners decision to revise its distribution growth rate downwards highlighted the challenges presented by the economic environment. The adjustment in projections caused a reevaluation of NEP's stock valuation, though subsequent price targets still indicate optimism for the partnership's outlook. Should the environment of interest rates improve as anticipated, we could see a positive turn for companies like NEP.
In reviewing other entities within the yieldco space, like Brookfield Renewable Partners, the dichotomy between high-yield investment options becomes evident. While NextEra Energy Partners may offer higher returns, this potential comes along with greater risk due to the uncertain sustainability of its high dividend yield amidst financial constraints. Conversely, Brookfield's diversification and financial health suggest a less risky path for investors.
In conclusion, examining NextEra Energy and NextEra Energy Partners requires careful consideration of their respective risks and opportunities. NextEra Energy's robust renewable energy project pipeline and strong market position, combined with its lower current share price, paint it as a potentially profitable long-term investment. Its renewable energy commitments and ambitious growth strategy present it as a strong player in the utility sector, worth watching as market conditions evolve. On the other hand, NextEra Energy Partners, despite higher risks, may still represent a valuable addition for those investors focused on income generation and who remain attentive to the broader economic indicators that could influence the partnership's financial trajectory.
Similar Companies in Electric Utilities:
Duke Energy Corporation (DUK), Southern Company (SO), Dominion Energy Inc (D), Exelon Corporation (EXC), American Electric Power Company, Inc. (AEP)
News Links:
https://www.fool.com/investing/2023/12/16/start-2024-off-right-with-these-3-energy-stocks/
https://www.fool.com/investing/2023/12/14/renewable-energy-stocks-jump-on-thursday/
https://www.fool.com/investing/2023/12/14/nextera-energy-partners-just-saw-debt-costs-go-up/
https://www.fool.com/investing/2023/12/14/2-utility-stocks-buy-hand-over-fist-2024-1-avoid/
https://www.fool.com/investing/2023/12/13/1-wall-street-analyst-says-buy-nextera-energy/
https://seekingalpha.com/article/4657171-brookfield-renewable-nextera-energy-partners-one-strong-buy
https://www.fool.com/investing/2023/12/09/2-magnificent-stocks-to-buy-that-are-near-52-week/
https://www.fool.com/investing/2023/12/07/3-top-utility-stocks-to-buy-in-december/
https://www.fool.com/investing/2023/12/06/why-nextera-energy-and-nextera-energy-partners-are/
Copyright © 2023 Tiny Computers (email@tinycomputers.io)
Report ID: VyX8mR
https://reports.tinycomputers.io/NEE/NEE-2023-12-17.html Home