NextEra Energy Partners, LP (ticker: NEP)
2024-01-29
 NextEra Energy Partners, LP (ticker: NEP) is a growth-oriented limited partnership formed by NextEra Energy, Inc. The partnership focuses on acquiring, managing, and owning contracted clean energy projects with stable, long-term cash flows. Its portfolio predominantly includes wind and solar generation facilities, which align with the global transition towards renewable energy sources. NextEra Energy Partners leverages the expertise and resources of its parent company to optimize project operations and secure additional assets while offering its investors a mix of income potential and long-term growth prospects. NEP aims to increase its distributions to limited partners over time, supported by its strategy of investing in projects with well-established off-takers and creditworthy counterparties. Additionally, NEP's market position is fortified by the wider trend of decarbonization and policy support for green energy initiatives, which provide tailwinds for the company's growth trajectory.
| Industry | Utilities - Renewable | Sector | Utilities | Previous Close | 29.20 |
| Market Cap | 2,691,790,080 | Volume | 2,028,019 | Average Volume | 1,789,985 |
| Dividend Rate | 3.38 | Dividend Yield | 0.1172 | Payout Ratio | 9.930901 |
| Beta | 0.966 | Trailing PE | 84.73529 | Forward PE | 39.46575 |
| Enterprise Value | 19,194,791,936 | Profit Margins | 0.095019996 | Book Value | 37.813 |
| Shares Outstanding | 93,432,496 | Net Income To Common | 122,000,000 | Trailing EPS | 0.34 |
| Enterprise To Revenue | 14.949 | Enterprise To EBITDA | 25.765 | Current Price | 28.81 |
| Total Cash | 274,000,000 | Total Debt | 6,288,999,936 | Total Revenue | 1,284,000,000 |
| Return On Assets | 0.00369 | Return On Equity | 0.0065200003 | Free Cashflow | -856,124,992 |
| Sharpe Ratio | -8.26346678811154 | Sortino Ratio | -129.11272404388959 |
| Treynor Ratio | -0.5429632228499047 | Calmar Ratio | -0.8065668555435923 |
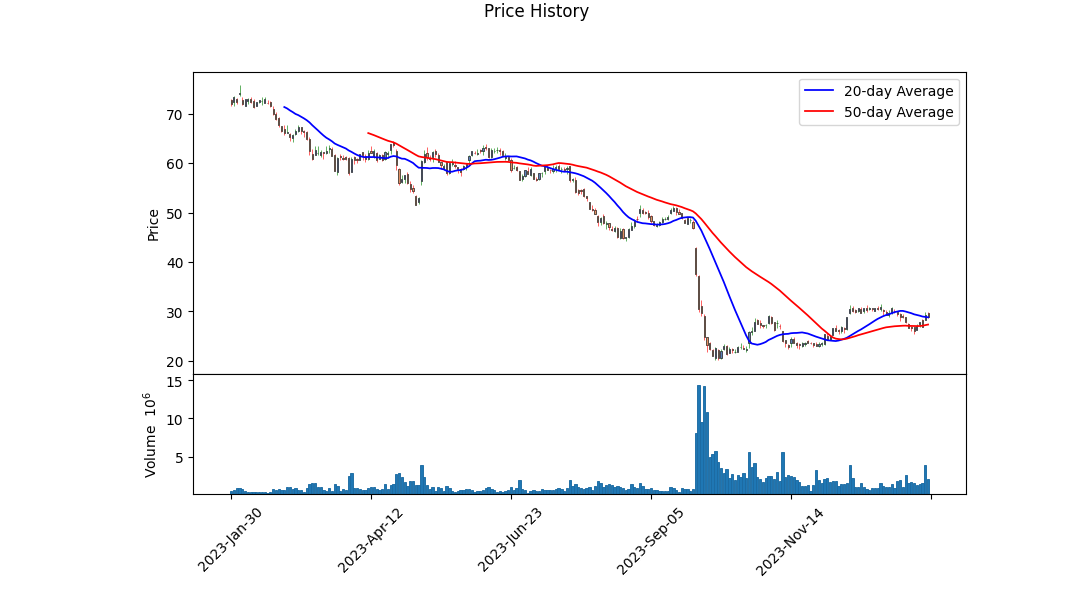
Technical analysis of NEP's recent stock price action shows a downward trend with consistent decreases in the opening and closing prices. The negative MACD histogram values toward the end of our dataset also signal ongoing bearish momentum. The progressively declining OBV (On-Balance Volume) indicates that volume has favored sellers and suggests a lack of buying pressure.
Fundamentally, NEP has shown a mix of strengths and weaknesses. The company's gross margins and EBITDA margins are high, which are positive signals of the firm's profitability on operations. However, there is a concern with the operating margins being negative, raising questions about the company's efficiency in managing its operating expenses relative to its revenue.
On the balance sheet, the substantial level of net debt is a concern that may weigh on future profitability and cash flows. Furthermore, the tangible book value is negative, indicating potential issues with valuation and asset leverage.
The cash flow statement indicates robust operating cash flows and free cash flow, which are promising for the company's liquidity and ability to manage short-term obligations. However, the significant repayment of debt indicates a substantial leverage that the company needs to manage carefully.
Market sentiment indicators like the Sharpe, Sortino, Treynor, and Calmar ratios are deeply in the negative territory, signifying a poor risk-adjusted performance over the last year. This could erode investor confidence and contribute to potential downward pressure on the stock price.
The analyst expectations point to quite a bit of variability in earnings estimates and actuals in recent quarters, with notable negative surprises in the past but turnarounds following that. The earnings revision trend is slightly positive for next year, signaling that analysts have increasing expectations for the company's future earnings.
The growth estimates for NEP suggest that the immediate future holds some challenges, with projections of a decline in current years earnings, a potentially tough next quarter, and an annual growth rate that is expected to be negative.
Considering all factors, the outlook for NEP's stock price in the next few months suggests continued volatility and potential downward pressure as the market weighs operational efficiencies against debt levels, analyzes ongoing profitability, and integrates the wider economic context.
Finally, the financial score summary for NEP presents a low Altman Z-Score, which indicates potential distress and bankruptcy risk within the next two years. Conversely, a Piotroski Score of 6 is somewhat encouraging, reflecting a moderate level of financial health and suggesting that while there are risks, the company is not in immediate danger. Working capital is sufficient, highlighting some capacity to service short-term liabilities, although the high level of total liabilities remains a matter of concern. With lower-than-industry-average growth estimates and a market cap that remains sizeable but may not fully reflect these underlying challenges, the stock may face headwinds in the near to medium term.
In our analysis of NextEra Energy Partners, LP (NEP), we have computed two important financial metrics to evaluate the company's performance: the Return on Capital (ROC) and the Earnings Yield. The ROC, which measures the efficiency with which a company turns capital into profits, has been calculated at -1.0079%. This negative value suggests that the firm is currently not generating positive returns on the capital it has invested, which could be a red flag for potential investors. It's important to consider this figure in the context of the company's specific operations, industry standards, and long-term strategy, as temporary factors could influence the result.
On the other hand, the Earnings Yield, which inversely relates the earnings to the market price, stands at a robust 7.5668%. This percentage indicates the earnings generated for each dollar of the company's market price. In comparison to current fixed income returns, a higher earnings yield indicates that the equity may be undervalued and thus potentially more attractive to value investors if we assume the company will maintain or improve its current earnings level. However, market conditions and company-specific risks need to be considered before making any investment decision based on this metric.
Based on the dividend history provided for NextEra Energy Partners, LP (NEP), we can analyze the pattern of dividend payments to determine if there has been consistent dividend payments and growth over time. The information provided is quite comprehensive and covers dividend payments from November 3, 2014, to February 5, 2024.
By examining the adjDividend values for each recorded date, we can calculate the change in dividends over each period and assess the consistency and growth. Starting from the earliest provided dividend of $0.1875 on November 3, 2014, dividends have increased consistently over time, reaching $0.88 by February 5, 2024.
The growth in dividends can be quantified by subtracting the dividend at the start of a period from the dividend at the end of a period:
$0.88 (February 5, 2024) - $0.1875 (November 3, 2014) = $0.6925
This calculation shows that the dividend has increased by $0.6925 over the span of roughly ten years, indicating a clear upward trend.
An investor reading this would notice that, although the change in dividend from one payment to the next is sometimes slight, there has been consistent growth over multiple years. This aspect of NEPs financial performance is in line with Benjamin Grahams investment principles, which favor companies with a history of consistent and growing dividends.
Given this data, NEP would appear to meet one of Grahams criteria for a sound investment as far as dividend payments are concerned. However, to fully evaluate NEP as a potential investment, other factors such as the company's overall financial health, its P/E and P/B ratios, and debt-to-equity ratios should be taken into account alongside its dividend payment record. It should be noted that the negative debt-to-equity ratio presented (-755.4285714285714) is a point of concern and would require further analysis to understand the context and potential risks associated with the company's financial structure.
As the data you provided shows NEP's dividends have not only been consistent but also growing, suggesting a potentially positive evaluation for dividend-focused investors, taking into consideration Graham's investment principles.
| Statistic Name | Statistic Value |
| R-squared | 0.210 |
| Adj. R-squared | 0.209 |
| F-statistic | 333.2 |
| Prob (F-statistic) | 3.38e-66 |
| Log-Likelihood | -2,863.9 |
| AIC | 5,732 |
| BIC | 5,742 |
| Const Coef | -0.0306 |
| Constant Std Err | 0.067 |
| Const t-value | -0.457 |
| Const P>|t| | 0.648 |
| Const [0.025 | -0.162 |
| Const [0.975] | 0.101 |
| Beta Coef | 0.9266 |
| Omnibus | 509.260 |
| Prob(Omnibus) | 0.000 |
| Jarque-Bera (JB) | 34,932.268 |
| Skew | -1.008 |
| Kurtosis | 28.757 |
| Cond. No. | 1.32 |
| Alpha | -0.0306 |
| Beta | 0.9266 |
In the linear regression model between NEP (a representation of a specific part of the market) and SPY (a representation of the entire market), the coefficient for SPY (beta) is 0.9266, indicating that for every unit increase in SPY, NEP is expected to increase by approximately 0.9266 units, holding all else constant. The R-squared value of 0.210 suggests that approximately 21% of the variability in NEP is accounted for by the variability in SPY. However, the statistical significance of alpha (the intercept) at -0.0306 is questionable given its relatively large p-value of 0.648, suggesting that the intercept is not significantly different from zero at common significance levels. This implies that when SPY is zero, the expected value of NEP may not be significantly different from -0.0306.
The alpha of the regression, at -0.0306, is the estimated value of NEP when SPY is zero. It represents the average expected return on NEP when the market return (SPY) is neutral, but in practice, it is typically interpreted as an indicator of NEP's performance against the market baseline provided by SPY. Although alpha is often used as a measure of outperformance, the negative value of alpha here suggests that NEP would, on average, underperform the market by -0.0306 units when the market's return is zero. However, the insignificance of this value, due to the large p-value, indicates this estimate of alpha may not be reliable, and thus caution should be taken when interpreting this alpha as a measure of excess return.
NextEra Energy Partners (NEP) held their Third Quarter 2023 Earnings Conference Call, starting with an overview by Kirk Crews of the company's strong results. He reported a significant growth in adjusted earnings per share for NextEra Energy and highlighted the exceptional performance of its subsidiary, Florida Power & Light Company (FPL). FPL continued to deliver excellent service at low costs, with bills well under the national average. It saw a 13.6% increase in regulatory capital employed and is investing heavily in capital expenditure, with expectations of continued growth over the next few years.
Energy Resources, another subsidiary, had an excellent quarter, with strong earnings growth and a record quarter for renewables and storage origination. The backlog for renewables and storage now exceeds 21 gigawatts. NEP has also undertaken strategic interest rate swaps to safeguard against volatility, with a focus on maintaining strong balance sheets and using various financial instruments for business funding, including tax credit transfers. Despite significant achievements, NEP has faced hurdles, including increasing costs due to interest rate hikes, and has adjusted their growth rate to address changing market conditions.
NextEra Energy has clear visibility for growth through FPL's capital plan, and they anticipate consistent investments in infrastructure and customer service improvements. FPL's focus remains on maintaining low bills and high reliability. With an expanding economy in Florida and increasing retail sales driven by warm weather, the company observed a strong demand in energy and is well-placed to cater to the state's growth.
Energy Resources detailed their earnings, noting the adjusted growth and contributions from new investments. This includes a record amount of new renewables and storage origination despite challenges such as permitting issues and decisions impacting projects in New York. The company remains focused on renewable development, with the updated backlog supporting ambitions of roughly 33 gigawatts to 42 gigawatts of energy generation through 2026.
For the detailed financial results, the discussion turned to NextEra Energy Partners' earnings, highlighting contributions from new projects and a marginal increase in earnings from existing projects. There's a focus on organic growth and strategic asset acquisitions, with expectations to fund upcoming repowering projects through tax equity or project-specific debt. Investments in interest rate swaps aim to hedge refinancing costs effectively.
John Ketchum concluded by addressing concerns about NEP's challenges over the year and emphasized their commitment to executing transition plans, which include selling Texas pipeline portfolio assets, growing distributions, and maximizing value for shareholders. Despite these, both FPL and Energy Resources have shown solid performance and continue to drive NextEra Energy's growth with their innovative and efficient approach in a dynamic energy market.
NextEra Energy Partners, LP (NEP) is a growth-oriented limited partnership that acquires, manages, and owns contracted clean energy projects with stable long-term cash flows. NEP's portfolio consists of renewable energy assets, including wind, solar, and battery storage projects, as well as natural gas pipeline assets. NEP, through its interests in NextEra Energy Operating Partners, LP (NEP OpCo), consolidates the financial results of NEP OpCo and its subsidiaries. As of September 30, 2023, NEP held approximately a 48.6% limited partner interest in NEP OpCo, while a noncontrolling interest of approximately 51.4% was held by NextEra Energy Equity Partners, LP (NEE Equity).
For the three months ended September 30, 2023, NEP reported an increase in operating revenues by $65 million, with renewable energy sales up $72 million, primarily due to revenues from renewable energy projects acquired in 2022 and 2023. This was partially offset by a $7 million decrease in Texas pipeline service revenues. Operating expenses witnessed a decrease of $25 million, mainly driven by lower corporate operating expenses, including a reduction in Interest Rate Distribution (IDR) fees and lower operating expenses at the Texas pipelines, although this was partly offset by higher operating expenses related to recently acquired renewable energy projects.
Depreciation and amortization expenses increased by $38 million, owing to depreciation costs associated with the newly acquired renewable energy projects. NEP recognized no gains on the disposal of businesses/assets in the third quarter of 2023, compared to $8 million during the same period in 2022. Interest expenses showed a decrease of $138 million, reflecting less favorable mark-to-market activity on interest rate swaps, increased average variable debt due to higher interest rates, and costs associated with recent renewable energy projects. Equity in earnings of equity method investees increased by $6 million, while equity in earnings of non-economic ownership interests decreased by $7 million due to unfavorable mark-to-market activity on interest rate swaps.
Income tax expense for the third quarter of 2023 was $31 million on pre-tax income of $163 million, resulting in an effective tax rate of 19%, which was below the U.S. statutory rate primarily due to tax benefit attributable to noncontrolling interests and production tax credits (PTCs).
Regarding noncontrolling interests, the net loss attributable to noncontrolling interests shifted substantially, reflecting a lower net income allocation to the noncontrolling interest of NEE Equity in 2023 compared to 2022, and a higher net loss allocation to differential membership interest investors in renewable energy projects acquired in 2022 and 2023.
Capex investments in 2023 featured notable acquisitions from NEER, including ownership interests in a portfolio of wind and solar generation facilities. These acquisitions have been financed through cash consideration and the assumption of existing project-level debt. NEPs liquidity strategy predominantly involves utilizing cash on hand, operating cash flows, debt financing, and potential equity issuances to meet capital requirements, fund acquisitions, service debt, and pay distributions to unitholders.
Regarding equity movements, during the nine months ended September 30, 2023, NEP issued approximately 1.7 million common units upon NEE Equity's exchange of NEP OpCo common units, contributing to the capital raised under the ATM program (At-The-Market equity issuance program).
In 2023, significant developments included the completion of renewable energy project acquisitions and the decision to sell its natural gas pipeline assets. The expected sale is anticipated to take place in the first half of 2024, with proceeds targeted to repay related borrowing and fund future acquisitions.
The filing date for the 10-Q report is not specifically included within the summarized information provided, but the report does reference data up to September 30, 2023. The management discussion and analysis is included without a full-year forecast, as interim results may not be indicative of the year's outcome.
NextEra Energy Partners (NEP) has undergone a significant transformation driven by a complex interplay between market dynamics, strategic decisions, and macroeconomic factors. While the partnership experienced a turbulent stretch characterized by rising interest rates and reduced investor enthusiasm for clean energy assets, recent developments suggest that a pathway to recovery and growth may be emerging.
The stock's volatility became particularly evident when NextEra Energy Partners encountered financial stress due to an escalating interest rate environment that increased the cost of capital. This adverse situation necessitated a strategic shift, which led the partnership to sell off its natural gas pipeline ventures to Kinder Morgan for a sizable $1.8 billion. The proceeds from this divestiture were earmarked for the redemption of convertible equity portfolio financings (CEPFs) and to reinvest in new renewable energy assets.
The company's revised strategy, with a focus on repowering existing wind facilities and prioritizing organic growth over acquisitions, has instigated a revised outlook for its dividend growth. Management has recalibrated its dividend growth forecast from a previous range of 12%-15% annually down to 5%-8%, targeting a 6% growth through 2026. Despite the 2023 dip in share price and the subsequent cut in distribution growth, NextEra Energy Partners has affirmed an optimistic outlook for the next several years without the need for additional equity issuance until at least 2027.
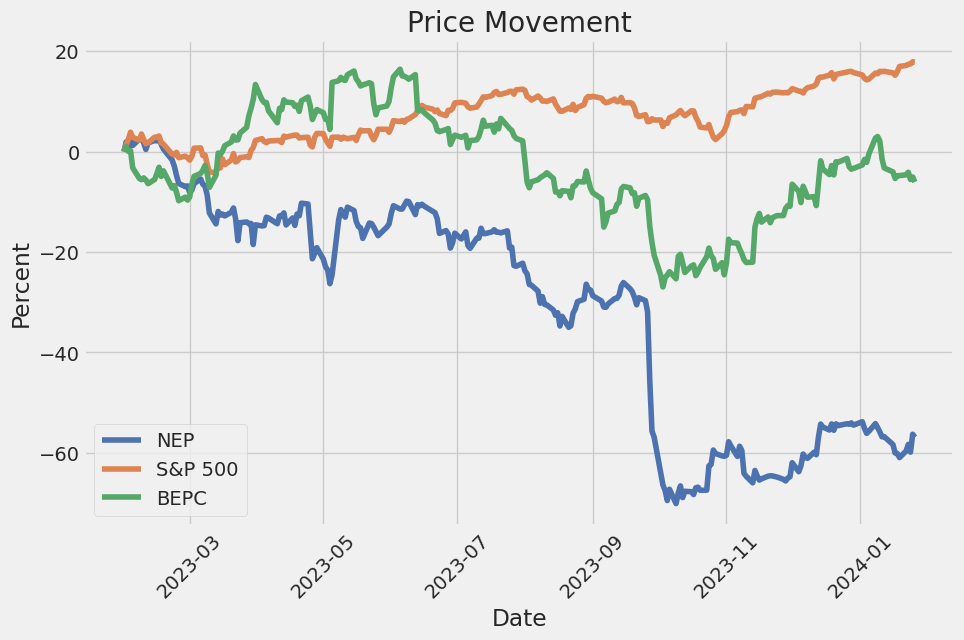
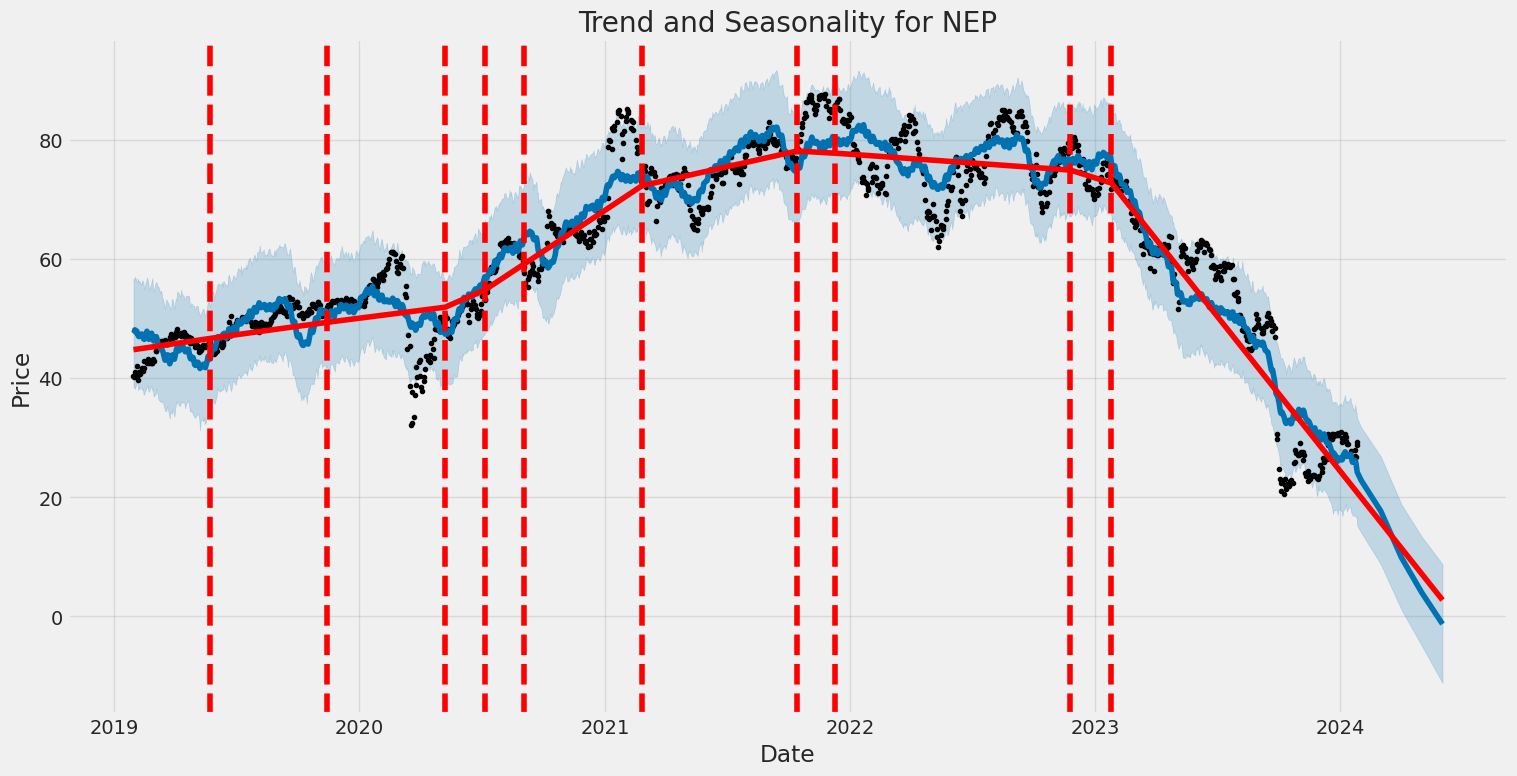
NEP's tumultuous year was punctuated by its stocks plummeting from a high of $77 to a low of $48 following the announced cut in distribution growth. However, the completion of asset sales and adjustments in financing strategy has laid a foundation for recovery. Contributing to this buoyancy is the Federal Reserve's indication of a potential pivot on interest rate policy. The updated "dot plot" from the Fed forecasts three rate cuts in 2024 and four in 2025, a development that has fueled investor optimism for companies like NextEra Energy Partners that are sensitive to interest rate shifts.
This optimism was palpable as NEP stock rallied remarkably, with an 11.6% surge on January 25, 2024, despite missing analysts' expectations for its fourth-quarter revenue and earnings per share. The partnership reassured investors of its capability to organically grow its dividend by 5% to 8% annually, through at least 2026. Despite projections indicating lower annual net income compared to the previous year, management has signaled a strong commitment to its dividend growth and financing strategies.
Moreover, NextEra Energy Partners stands out for its relationship with its parent company, NextEra Energy, leveraging this connection to facilitate capital investments. The company regularly acquires assets from the parent, a practice that has contributed to significant growth in the past. Yet, the current market conditions and strategic realignment, including a slower pace of asset acquisitions from NextEra Energy, intimate that future performance may diverge from historical trends.
In alignment with its strategic adjustments, NextEra Energy Partners has repositioned itself towards a more conservative trajectory in terms of distribution growth and capital raising. However, the potential easing of interest rates indicated by the Fed may alleviate some of the financial stress that has beleaguered the company, aiding in its continued commitment to growth.
Investors are now keeping a close eye on the company's financial performance, with recent announcements of fourth-quarter and full-year 2023 results expected to be released in January 2024. The announcement, which coincides with the release of NextEra Energy's results, is to be discussed during a live webcast presentation where management will share insights on performance and strategic initiatives.
The long-term prospects for NextEra Energy Partners appear contingent upon successful execution of its revised strategic plan, the broader interest rate environment, and continued investor confidence in its growth and dividend strategy. With NEP offering an attractive dividend yield and evident investor interest, the partnership's recalibration efforts may ultimately pave the way for sustainable growth and a stronger position within the renewable energy space.
The volatility of NextEra Energy Partners, LP (NEP) between January 30, 2019, and January 26, 2024, is characterized by a statistical model which suggests that the average returns over time are effectively zero, indicating that the returns do not demonstrate a consistent uptrend or downtrend. The ARCH model, which is used to estimate volatility, reveals that there is a significant and persistent level of volatility, as indicated by the sizeable "omega" coefficient. Fluctuations in the returns are captured by the "alpha" coefficient, where its value denotes that past volatility has a strong influence on future volatility.
| Statistic Name | Statistic Value |
|---|---|
| R-squared | 0.000 |
| Adj. R-squared | 0.001 |
| Log-Likelihood | -2785.27 |
| AIC | 5574.54 |
| BIC | 5584.81 |
| No. Observations | 1,256 |
| Df Residuals | 1256 |
| omega | 3.1555 |
| alpha[1] | 0.6469 |
To analyze the financial risk of a $10,000 investment in NextEra Energy Partners, LP (NEP) over a one-year period, we integrate volatility modeling techniques with machine learning predictions to provide a comprehensive view of future uncertainties associated with the stock.
The volatility modeling technique employed is fundamental in capturing and quantifying the variance in return series over time, leading to a deeper understanding of NextEra Energy Partners, LP's stock volatility. While historical returns can give us an insight into the stock's performance, volatility models are designed to account for dynamic changes in variance, thus offering a more robust depiction of potential risk levels. Through this model, the conditional variance of NEP's returns is estimated, which aids in forecasting future volatilitycrucial for risk assessment.
In collaboration with volatility modeling, machine learning predictions are utilized to leverage historical data in generating forward-looking forecasts. Specifically, the role of the established tree-based regression technique provides a non-linear approach to capturing complex patterns in the data. By training on historical return and volatility data, this machine learning algorithm can predict the expected future returns of NEP's stock.
Fusing these two analytics methods, the calculated annual VaR at a 95% confidence level for a $10,000 investment in NEP is $639.37. This figure indicates that there is a 95% probability that the investment will not incur a loss exceeding $639.37 over the next year under normal market conditions. In essence, it signifies that there is a 5% chance that the investor could face a loss greater than this amount due to adverse movements in the stock price.
In assessing the results, the efficacy of employing a dual-approach to risk analysis becomes evident. Volatility modeling offers insights into the variability of returns, an essential factor for quantifying risk and uncertainty. Meanwhile, machine learning predictions contribute to a forward-looking perspective on potential returns. These combined forecasts, especially the machine learning-enhanced predictions, provide a more enriched analysis of the potential financial perils that come with equity investments.
By integrating volatility modeling with machine learning predictions, investors are afforded a multi-faceted examination of NextEra Energy Partners, LP's stock behavior. The calculated VaR is an informative statistic for investors, encapsulating the quantified risk in a single number, which can support decision-making regarding portfolio risk management.
Similar Companies in UtilitiesRenewable:
Brookfield Renewable Corporation (BEPC), Algonquin Power & Utilities Corp. (AQN), Clearway Energy, Inc. (CWEN), Atlantica Sustainable Infrastructure plc (AY), Clearway Energy, Inc. (CWEN-A), Brookfield Renewable Partners L.P. (BEP), Algonquin Power & Utilities Corp. (AQNU), rsted A/S (DNNGY), TerraForm Power, Inc. (TERP), Pattern Energy Group Inc. (PEGI)
https://www.fool.com/investing/2023/12/16/why-nextera-energy-partners-rallied-this-week/
https://www.fool.com/investing/2023/12/22/3-things-you-need-to-know-if-you-buy-nextera-energ/
https://seekingalpha.com/article/4659234-brookfield-renewable-vs-nextera-energy-which-is-better
https://www.fool.com/investing/2023/12/30/my-2-highest-upside-stock-picks-for-2024/
https://www.fool.com/investing/2024/01/03/why-renewable-energy-stocks-plunged-on-wednesday/
https://www.fool.com/investing/2024/01/08/after-a-down-year-in-2023-these-3-top-dividend-sto/
https://www.fool.com/investing/2024/01/09/why-nextera-energy-partners-stock-surged-29-in-dec/
https://www.fool.com/investing/2024/01/14/3-stocks-to-buy-before-the-fed-cuts-interest-rates/
https://seekingalpha.com/article/4662916-nextera-energy-partners-yields-12-percent-but-buyers-beware
https://seekingalpha.com/article/4662723-nextera-energy-partners-cry-yell-or-fold
https://seekingalpha.com/article/4664165-live-on-income-forever-with-magnificent-dividends
https://www.fool.com/investing/2024/01/25/why-nextera-energy-partners-stock-is-ripping-highe/
https://www.sec.gov/Archives/edgar/data/1603145/000160314523000046/nep-20230930.htm
Copyright © 2024 Tiny Computers (email@tinycomputers.io)
Report ID: MZngy1
Cost: $0.91149
https://reports.tinycomputers.io/NEP/NEP-2024-01-29.html Home