New York Community Bancorp, Inc. (ticker: NYCB)
2024-01-25
 New York Community Bancorp, Inc. (ticker: NYCB) stands as one of the largest bank holding companies headquartered in the State of New York centered primarily in offering service to customers through its bank subsidiary, New York Community Bank. With a legacy stemming from 1859, NYCB operates through an extensive network of branches throughout Metro New York, New Jersey, Ohio, Florida, and Arizona. Principally engaged in the performance of traditional banking activities, the company's business strategy is oriented towards generating income through its investments and mortgage banking operations. The bank has well-established relationships with its customers, offering a variety of products and services tailored especially for individuals and small to mid-size businesses. Known for its conservative lending practices, NYCB maintains a stable loan portfolio, mostly in multi-family loans, which has historically resulted in above-average asset quality metrics relative to the banking industry. As a publicly traded company, NYCB is listed on the New York Stock Exchange and is a component of broad market indices. The bank's financial performance, new initiatives, and community engagement activities are closely monitored by investors and analysts for indications of its growth trajectory and overall health within the banking sector.
| Address | 102 Duffy Avenue, Hicksville, NY, 11801, United States | Phone | 516 683 4100 | Website | https://www.flagstar.com |
| Industry | Banks - Regional | Sector | Financial Services | Full Time Employees | 7,497 |
| President CEO & Director Pay | $3,284,108 | CFO Pay | $1,586,167 | Commercial Real Estate Finance President Pay | $1,104,115 |
| Consumer and Corporate Banking President Pay | $493,848 | Mortgage President Pay | $809,784 | General Counsel & Corporate Secretary Pay | $1,136,490 |
| Previous Close | $10.25 | Open | $10.33 | Day Low/High | $10.23 / $10.45 |
| Dividend Rate | $0.68 | Dividend Yield | 6.63% | Ex-Dividend Date | 17-Nov-2023 |
| Payout Ratio | 17.39% | Five Year Avg Dividend Yield | 6.41% | Beta | 1.103 |
| Trailing PE | 2.64 | Forward PE | 7.87 | Volume | 4,445,266 |
| Average Volume (10 days) | 6,627,090 | Market Cap | $7,448,851,456 | 52-Week Low/High | $5.81 / $14.22 |
| Price to Sales | 2.69 | Enterprise Value | $15,949,503,488 | Profit Margins | 101.08% |
| Shares Outstanding | 722,488,000 | Shares Short | 29,051,593 | Shares Percent | 4.02% |
| Held by Insiders | 1.24% | Held by Institutions | 70.36% | Short Ratio | 2.79 |
| Price to Book | 0.71 | Last Fiscal Year End | 31-Dec-2022 | Next Fiscal Year End | 31-Dec-2023 |
| Earnings Quarterly Growth | 36.20% | Net Income to Common | $2,736,000,000 | Trailing EPS | $3.91 |
| Forward EPS | $1.31 | Total Cash | $7,112,999,936 | Total Debt | $15,153,999,872 |
| Total Revenue | $2,768,000,000 | Revenue Per Share | $4.146 | Return on Assets | 3.21% |
| Return on Equity | 31.55% | Revenue Growth | 187.40% | Operating Margins | 40.31% |
| Sharpe Ratio | -7.37243575685995 | Sortino Ratio | -159.45461451796004 |
| Treynor Ratio | 0.13305381096329602 | Calmar Ratio | 0.3205746963496112 |
Technical Analysis and Future Outlook:
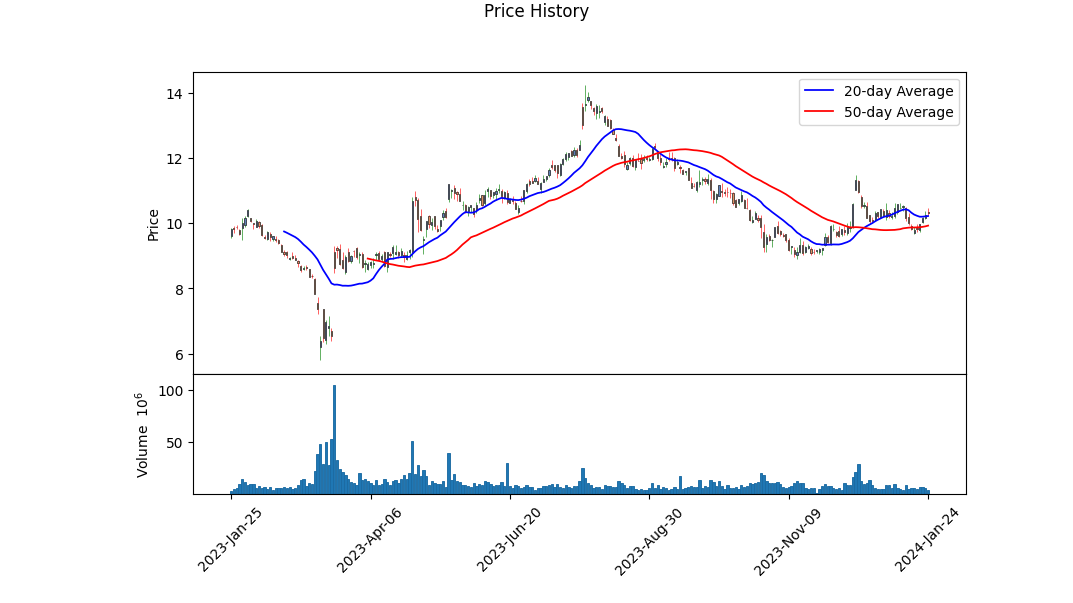
The recent technical analysis data for NYCB indicates a period of mild volatility with slight improvements in the price as indicated by the ascending On-Balance Volume (OBV) direction from -8.313080 in million to -5.717493 in million and a recovering MACD histogram, hinting at a shifting momentum towards the upside.
However, despite recent price resilience, the OBV trend over the last few months has generally been negative, implying that there might be higher distribution than accumulation. Thus, it reveals a cautious sentiment among investors.
The oscillating nature of the MACD histogram, while edging closer to the zero line from its previous negative values, suggests bullish momentum but it is yet to be confirmed with a crossover of the signal line. If the MACD line crosses above its signal line, it could confirm a bullish signal for upcoming trading sessions.
Looking at the fundamentals, we notice a disparity in overall outlook. The revenue increased to $3.29B, indicating a growth, yet EBIT margins seemed stable or possibly under pressure given the earnings growth. Net income has remained relatively sturdy over the last few fiscal years, which is a positive signal for the company's profitability. However, the equity score reveals quite low Altman Z and Piotroski scores, indicating potential financial distress and weak financial health.
Moreover, the cash flow statement presents strong free cash flows but also points to significant debt repayments, suggesting that the company is focused on reducing its leverage. This could improve financial stability over the long term but may weigh on short-term performance.
The negative Sharpe, Sortino, and Calmar ratios reflect weak risk-adjusted returns and potential concerns for the investor expecting consistent performance.
Analyst expectations portray a mixed picture, where we anticipate a slight earnings growth in the current year followed by a dip next year. This is coupled with a moderate expectation in sales growth for the next year as indicated by the analysts' estimate.
Based on review of current data and the interplay between technical indicators and underlying financials, the picture emerging over the next few months is one of cautious optimism. While there's evidence of a budding recovery, evidenced by positive analyst growth estimates for the current quarter and next, several ratios indicate that the stock may face continued volatility.
Investors might want to keep an eye on improving technical signals, such as a confirmed bullish MACD crossover and continued volume supporting the price advances, before firmly trusting an upward trend. However, the starkly negative Sharpe and Sortino Ratios could imply that any positive movements could be accompanied by considerable volatility, which could make NYCB's stock suitable primarily for investors with a higher risk tolerance.
Moreover, balance sheet analysis indicates a substantial level of debt financing, although efforts to de-leverage are apparent. This high debt profile, amid a recovering yet sensitive economic climate, may add layers of risk to the investment. The fundamental aspect, though, with steady net income, points to a resilient business model which could fare well in the long term.
In conclusion, while some green shoots of recovery are visible, they are contrasted by apparent risks and a need for close watch on the companys ability to navigate its debt and leverage to turn fledging technical recovery indicators into a sustained positive trend. Future stock price movement for NYCB over the upcoming months appears to be delicately balanced between emerging positive signals and underlying risks, flirting with the potential for both upside and retrenchment.
| Dependent Variable | y |
| R-squared | 0.243 |
| Adj. R-squared | 0.242 |
| F-statistic | 401.9 |
| Prob (F-statistic) | 9.12e-78 |
| No. Observations | 1,256 |
| Df Residuals | 1,254 |
| Df Model | 1 |
| Alpha (Intercept) | -0.0081 |
| Beta (coefficient for SPY) | 0.9347 |
| P-value | 0.895 |
| Std. Error of Intercept | 0.061 |
| Std. Error of Beta | 0.047 |
| 95% Conf. Interval Lower Bound | 0.843 |
| 95% Conf. Interval Upper Bound | 1.026 |
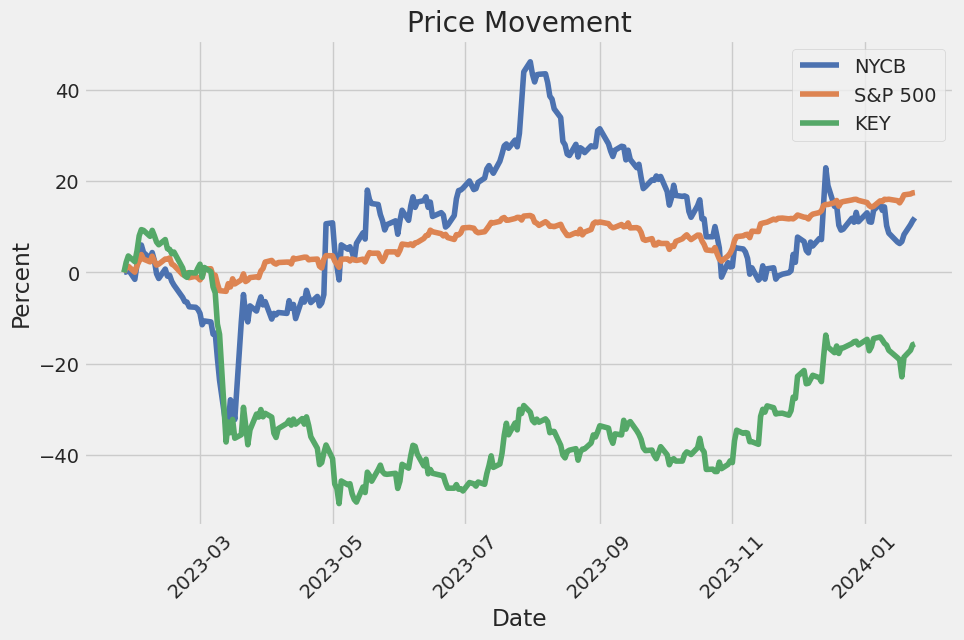
In the regression analysis of NYCB as the dependent variable against SPY as the independent variable representing the market, the slope of the line, or beta, is 0.9347. This indicates that for every one unit change in SPY, NYCB is expected to change by approximately 0.935 units in the same direction. The beta value reflects the sensitivity of NYCB to movements in the overall market, with a beta close to 1 suggesting that NYCB moves very similarly to the market. However, the R-squared value of 0.243 implies that only around 24.3% of the variability in NYCB can be explained by the market movements represented by SPY. This leaves a significant portion of NYCB's movement potentially affected by factors not accounted for by SPY.
A key metric in the analysis is the alpha value, which stands at -0.0081. Alpha represents the measure of performance on a risk-adjusted basis. A negative alpha suggests that NYCB has underperformed the market after adjusting for the inherent risk as represented by its beta. In other words, NYCB would have provided a slightly lower return than expected given the market's performance. This underperformance is emphasized by a statistically insignificant p-value of 0.895 for alpha, suggesting that the alpha is not significantly different from zero, hence not providing evidence that NYCB offers excess return over the market's performance.
Summary of New York Community Bancorp's Third Quarter 2023 Earnings Call
Opening Remarks: - Operator Regina introduced the call. - Sal DiMartino provided opening statements and risk disclaimers. - Thomas Cangemi announced solid Q3 results, highlighting loan growth, stable deposit trends, and an increased net interest margin (NIM). Net income available to common stockholders was $256 million, or $0.36 per share, outperforming consensus estimates. - John Pinto and other executive leaders joined the discussion.
Financial Performance: - The NIM was 3.27%, a rise from previous guidance, with higher asset yields and a good balance of non-interest-bearing deposits. - Total loans were up marginally to $84 billion. - Total deposits decreased mainly due to a drop in custodial deposits related to the signature transaction, and brokered deposits also declined. - Funding mix improved, with a decrease in wholesale borrowings. - Two office-related loans led to a notable increase in nonperforming loans (NPLs), but overall asset quality metrics remained strong. - Cost-cutting was a consistent theme across the operations.
Guidance for Q4: - NIM expected to be between 3.00% and 3.10%. - Specific forecasts for mortgage gain on sale, MSR assets net return, loan admin income, operating expenses, and the tax rate were provided. - The company unveiled a new brand and logo, signaling commitment to one bank, one brand, one culture.
Q&A Session: - Analysts asked questions about: - Impact of custodial deposits on future margins and their average balance. - Expectations on asset quality, particularly regarding office portfolio and rent-regulated multifamily landlords in New York. - Operating expenses and savings from past acquisitions. - Possibility of participating in more troubled bank transactions. - Future of earning assets and targeted cash levels. - Asset quality and portfolio mixes in light of new market dynamics and loan originations. - Private banking team hires from First Republic and bringing back non-interest-bearing deposits. - Purchase accounting accretion, proportional to respective transactions.
Closing Remarks: - Cangemi expressed gratitude to the team for their dedication and achieving solid results during tough times.
Overall, NYCB showcased a strong quarter performance with growth despite challenges. Management emphasized the commitment to a relationship-based deposit strategy to achieve business goals and improve the bank's financial posture, as they continue integrating newly acquired institutions under the Flagstar umbrella.
New York Community Bancorp, Inc. (NYCB) reported a total asset value of $111.2 billion as of September 30, 2023, reflecting an increase of $21.1 billion from December 31, 2022. This growth was largely due to the assumption of substantial deposits and certain identified liabilities, as well as the acquisition of certain assets and lines of business of Signature Bridge Bank from the FDIC as receiver. Total deposits reached $82.7 billion, indicating a substantial $24.0 billion rise since December 31, 2022.
For the quarter ending September 30, 2023, net income stood at $207 million, contrasting with $413 million reported for the previous quarter ending June 30, 2023. The third quarter's net income available to common shareholders was $199 million, down from $405 million in the second quarter. Diluted earnings per share (EPS) also reduced to $0.27 for the third quarter from $0.55 in the second quarter. Both quarters' results were impacted by merger-related expenses.
NYCB's loan portfolio has experienced notable shifts, with commercial and industrial (C&I) loans increasing to $24.4 billion, largely due to the Signature Transaction and growth in specialty finance sectors. Multi-family loan holdings exhibited a slight decrease to $37.7 billion, from $38.1 billion previously. The percentage of multi-family loans in the bank's total loan portfolio has decreased, showcasing a reduced concentration in this asset class.
Moreover, commercial loans experienced a substantial rise of $2.9 billion, now totaling $13.4 billion, attributed primarily to the Signature Transaction and growth in home builder finance. One-to-four family residential loans showed a moderate increase, while the "Other loans" segment expanded to $2.6 billion, mostly consisting of home equity line of credit (HELOC) and other consumer loans.
The bank's deposit base includes $31.3 billion of uninsured deposits, marking an increase of $14.8 billion since the end of the year 2022, due to the Signature Transaction. Additionally, NYCB maintains $31.2 billion of total ready liquidity to match the balance of uninsured deposits.
Net interest income for the third quarter of 2023 was $882 million, a decrease of $18 million or 2%, compared to the second quarter, primarily due to lower average earning assets. Nonetheless, the net interest margin saw a slight improvement, attributed to the higher interest rate environment and recently acquired loans which positively affected asset yields.
Asset quality exhibited an elevation in non-performing assets (NPA) to total assets, reaching 0.40%, from 0.21% as reported on June 30, 2023. Non-performing loans (NPLs) to total loans also increased to 0.52%, mostly related to two notable commercial real estate loans in the office sector. Repossessed assets remained relatively stable.
Finally, NYCB's Board of Directors declared a quarterly cash dividend of $0.17 per share on the company's common stock, payable on November 16, 2023, to common stockholders of record as of November 6, 2023.
New York Community Bancorp, Inc. (NYSE: NYCB) is positioned as a noteworthy player in the American financial sector, having undertaken several strategic steps to fortify its market presence, particularly within the multifamily loan segment. Following the unfolding of events that led to the acquisition of certain assets and liabilities of Signature Bank by NYCB's subsidiary, Flagstar Bank, the financial landscape has shifted significantly, marking a pivotal point for NYCB.
With approximately $38 billion in assets, including a $13 billion loan portfolio, assimilated from Signature Bank, NYCB has demonstrated its capacity for substantial growth. Although the acquisition deliberately excluded assets related to digital assets, crypto-related sectors, multifamily, commercial real estate loans, and the fund banking business, NYCB's calculated expansion has enabled it to nurture core bank deposit relationships and step into an array of financial services that complement its existing portfolio.
Considering NYCB's broader strategy, the recent rise in its stock value further illustrates investor confidence in the bank's direction. Coupled with a positive trajectory and a significant dividend yield of 6.7%, NYCB presents a promising picture for income-focused investors. The bank's commitment to shareholder returns is evidenced through its stable dividends and the active $300-million share repurchase program, of which $9 million was still unutilized as of September 30, 2023.
Financial analysts anticipate New York Community Bancorp's forthcoming quarterly earnings report to highlight a year-over-year growth attributed to the results of these and prior strategic initiatives, although there have been revisions to the EPS estimates indicating a more tempered expectation from the financial community. Despite the anticipation of increased revenues, NYCB's negative Earnings ESP of -0.06%, paired with a Zacks Rank #5 (Strong Sell), paints a cautious picture heading into the earnings release.
On a comparative note, the company contends with other financial entities like Truist Financial and Huntington Bancshares, which offer solid dividends of their own. However, NYCB's conspicuous merger activities, particularly with Flagstar, have laid the foundation for robust compound annual growth rates both for its deposits and net loans.
Nevertheless, it is not bereft of challenges. The dop in asset quality, with rising non-performing assets and credit loss provisions, alongside growing operational costs, has raised some concerns about NYCB's financial strength. The banking institution's substantial loan portfolio concentration in the Metro New York area adds a layer of regional risk that has translated into a notable stock decline over a three-month period, standing out against the industry's wider gains.
As NYCB navigates this complex environment, the bank continues to leverage opportunities for balance sheet invigoration. The interim acquisition ventures and the ongoing support provided to the Banking as a Service (BaaS) space are expected to uphold its momentum. Such dynamic movements underscore NYCB's resilience amidst pressing industry challenges.
Investors and analysts await with interest the release of NYCB's financial results scheduled for January 31, 2024. This announcement is projected to offer definitive insights into the bank's performance throughout both the fourth quarter and the end of the fiscal year, allowing for a comprehensive evaluation of its fiscal health and strategic direction. The bank's conference call later that day, hosted by President and CEO Thomas R. Cangemi, will provide a platform for internal leaders to discuss these results and future projections with the investment community.
The parent company of Flagstar Bank, N.A., which operates a robust network of 436 branches, is involved in a spectrum of financial operations, including multi-family lending and mortgage origination and servicing. Given its status as a top lender in the New York City market and a significant contributor to the national mortgage landscape, NYCB's operational results promise essential data that will shape stakeholder expectations and investment strategies in the short to medium term.
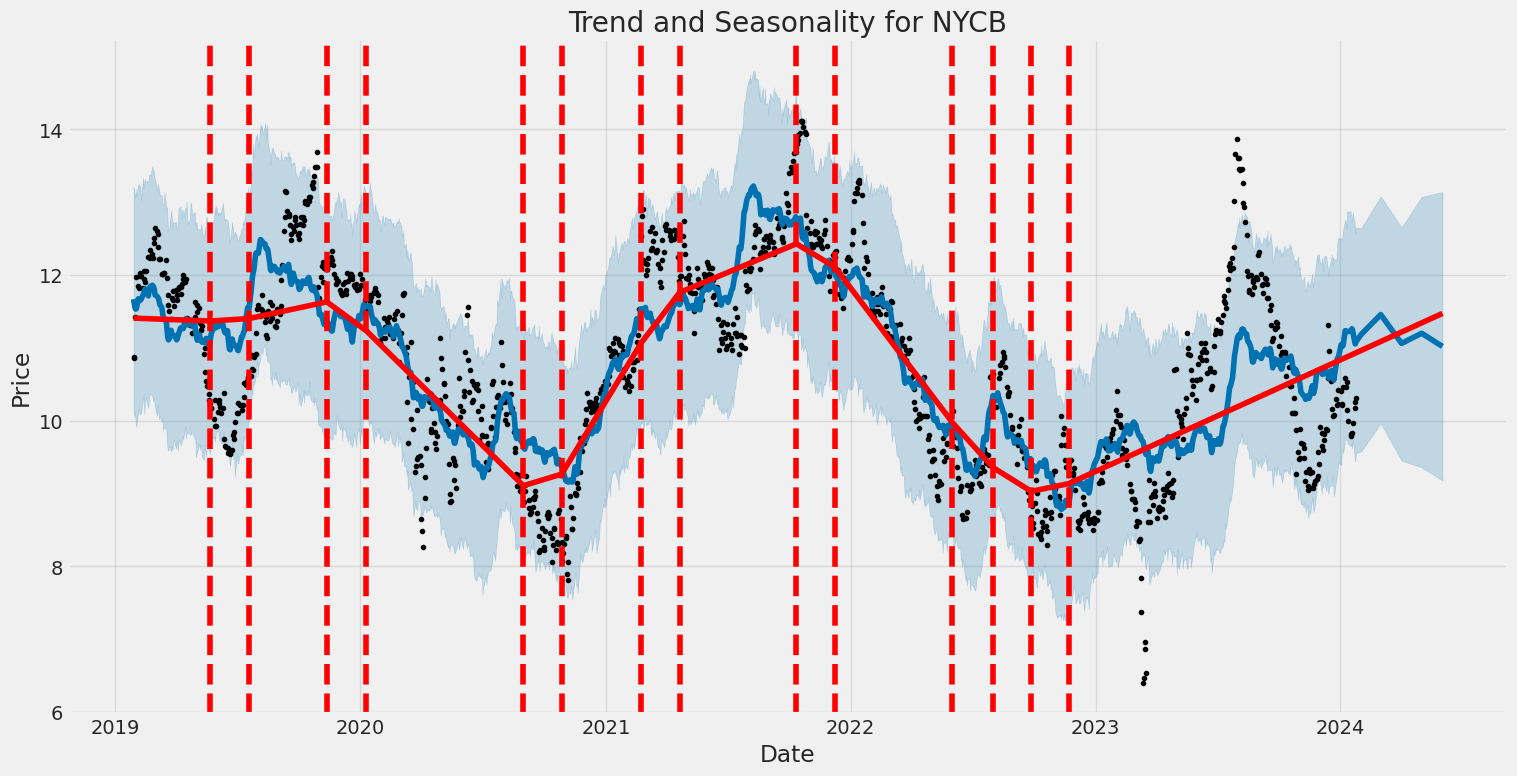
The volatility of New York Community Bancorp, Inc. (NYCB) from January 2019 to January 2024 can be summarized as follows:
- The statistical model used indicates that the returns on the asset have a significant level of volatility, with the parameter omega () having a value of 3.7771, which suggests that there is a base level of variance in the stock's returns.
- The alpha () value of 0.5275, which measures the impact of past shocks on current volatility, is substantial and implies that past price movements have a sizable effect on the current price volatility.
- The statistical significance of these parameters is high, with p-values well below the conventional threshold of 0.05, signifying that the coefficients are very likely different from zero and therefore influential on the model of volatility.
Below is the HTML table of statistics excluding the date and time of the calculations:
| Statistic Name | Statistic Value |
|---|---|
| R-squared | 0.000 |
| Adj. R-squared | 0.001 |
| Log-Likelihood | -2,847.04 |
| AIC | 5,698.08 |
| BIC | 5,708.35 |
| No. Observations | 1,256 |
| Df Residuals | 1,256 |
| Df Model | 0 |
| omega | 3.7771 |
| alpha[1] | 0.5275 |
When assessing the financial risk of investing $10,000 in New York Community Bancorp, Inc. (NYCB) over a one-year period, we integrate volatility modeling and machine learning predictions to provide a robust analysis.
Volatility modeling is a powerful statistical method leveraging historical price data to estimate future risk and variability in a stock's returns. For NYCB, this technique helps capture the dynamic nature of market conditions and their impact on the stock's price movements. Through this approach, we quantify the level of uncertainty and portray how stock prices might fluctuate over time. By adjusting for periods of high and low volatility, the model also provides improved estimates that can guide decision-making under uncertainty.
Machine learning predictions complement volatility modeling by employing complex algorithms to forecast future stock returns based on historical and relevant market data. The use of a machine learning approach such as a tree-based regression method enables the processing of vast datasets and the identification of non-linear patterns that might affect NYCB's returns. This predictive capability assists in contributing to a more nuanced understanding of potential future performance, considering a multitude of factors.
Crucially, the integration of volatility modeling and machine learning predictions produces a comprehensive view of the risks associated with an investment in NYCB. The Value at Risk (VaR) has been calculated at a 95% confidence interval, which provides an investor with a sense of the maximum expected loss over a specified time frame, under normal market conditions. For the $10,000 investment in NYCB, the annual VaR estimate is $549.31 at the 95% confidence level. This suggests that there is a 5% chance that the investment could lose more than this amount over the next year.
This VaR figure provides a quantifiable and actionable insight into the risk magnitude, while also reflecting the potential variability in returns that may be caused by both typical market fluctuations and the more idiosyncratic movements associated with NYCB's stock. The investor can use this information to determine whether the level of risk is acceptable in light of their personal risk tolerance, investment goals, and the overall balance of their investment portfolio.
By utilizing volatility modeling to understand the intricacies of NYCB's stock volatility and deploying machine learning predictions to estimate future returns, we are equipped to deliver a multilayered view of risk that blends historical analysis with forward-looking projections. The calculated VaR at a 95% confidence interval is a critical metric that serves as a gauge for potential losses, informing investor strategy in terms of hedging, portfolio diversification, and risk management practices.
Similar Companies in BanksRegional:
KeyCorp (KEY), Fifth Third Bancorp (FITB), Regions Financial Corporation (RF), Zions Bancorporation, National Association (ZION), Huntington Bancshares Incorporated (HBAN), Comerica Incorporated (CMA), Western Alliance Bancorporation (WAL), U.S. Bancorp (USB), M&T Bank Corporation (MTB), PacWest Bancorp (PACW), First Horizon Corporation (FHN), Truist Financial Corporation (TFC), The PNC Financial Services Group, Inc. (PNC), Signature Bank (SBNY), People's United Financial, Inc. (PBCT), Valley National Bancorp (VLY), First Republic Bank (FRC), Provident Financial Services, Inc. (PFS), Flushing Financial Corporation (FFIC), TrustCo Bank Corp NY (TRST), ConnectOne Bancorp, Inc. (CNOB)
https://www.youtube.com/watch?v=Qvom43e6LwA
https://finance.yahoo.com/news/blackstone-bx-cppib-win-stake-160600056.html
https://finance.yahoo.com/news/12-most-profitable-cheap-stocks-191850947.html
https://finance.yahoo.com/news/banco-santander-san-buys-stake-114800330.html
https://finance.yahoo.com/news/york-community-nycb-worth-look-153000958.html
https://seekingalpha.com/article/4660235-71-ben-graham-january-value-stocks-56-jazzed-buys
https://finance.yahoo.com/news/investors-york-community-bancorp-nyse-141143518.html
https://finance.yahoo.com/news/york-community-nycb-hurt-weak-163000983.html
https://finance.yahoo.com/news/york-community-bancorp-inc-report-180000280.html
https://seekingalpha.com/article/4663690-the-more-it-drops-the-more-i-buy
https://www.sec.gov/Archives/edgar/data/910073/000091007323000082/fbc-20230930.htm
Copyright © 2024 Tiny Computers (email@tinycomputers.io)
Report ID: ZwMNUAN
Cost: $0.85578
https://reports.tinycomputers.io/NYCB/NYCB-2024-01-25.html Home