Pfizer Inc. (ticker: PFE)
2024-09-21
 Pfizer Inc. (ticker: PFE) is a leading global biopharmaceutical company headquartered in New York City, specializing in the discovery, development, and manufacturing of healthcare products, including vaccines, biologics, and small-molecule pharmaceuticals. Established in 1849, Pfizer has grown through organic research efforts and strategic acquisitions, fostering a diverse portfolio that addresses a broad range of medical conditions. The company's notable contributions include the development of the first mRNA-based COVID-19 vaccine in collaboration with BioNTech, which has played a crucial role in combating the global pandemic. Pfizer operates in several segments, including innovative health and essential health, focusing on both newly-patented products and established treatments, respectively. The company's commitment to excellence in research and development is underscored by significant annual investments, aiming to advance healthcare solutions across various therapeutic areas. Pfizer's extensive global reach and robust pipeline ensure its position as a key player in the pharmaceutical industry.
| Full-Time Employees | 88,000 | Previous Close | 29.66 | Open | 29.54 |
| Day Low | 29.23 | Day High | 29.53 | Regular Market Previous Close | 29.66 |
| Regular Market Open | 29.54 | Regular Market Day Low | 29.23 | Regular Market Day High | 29.53 |
| Dividend Rate | 1.68 | Dividend Yield | 0.0571 | Payout Ratio | 4.4323997 |
| Five-Year Avg Dividend Yield | 4.17 | Beta | 0.617 | Forward PE | 10.286714 |
| Volume | 56,840,260 | Average Volume | 31,570,249 | Average Volume (10 days) | 31,501,920 |
| Bid | 29.39 | Ask | 29.42 | Bid Size | 1,000 |
| Ask Size | 2,200 | Market Cap | 166,714,310,656 | 52-Week Low | 25.2 |
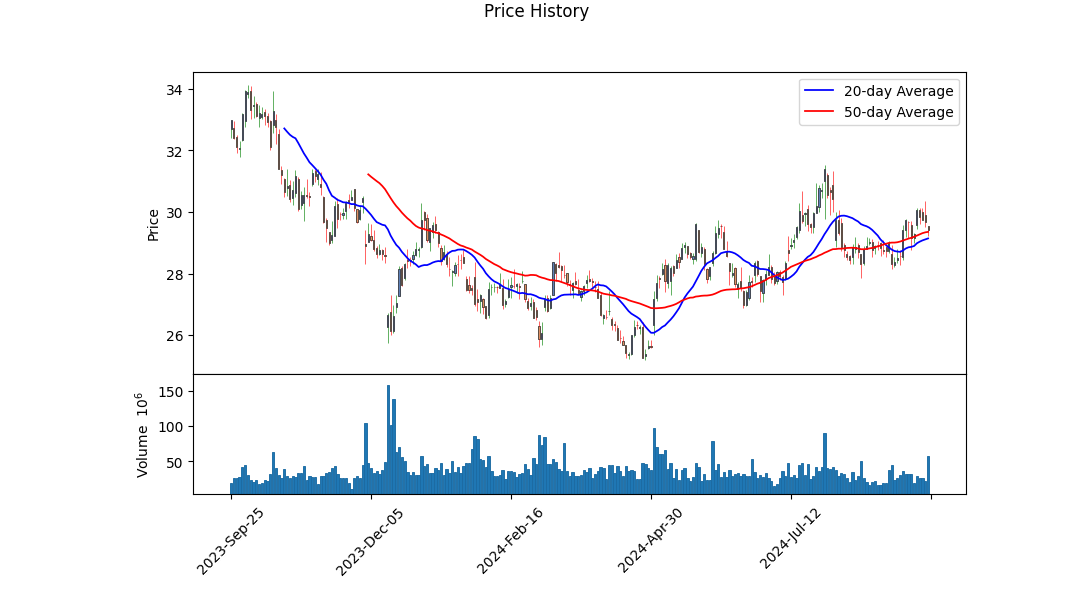
| 52-Week High | 34.11 | Price to Sales Trailing 12 Months | 3.0220482 | 50-Day Average | 29.3552 |
| 200-Day Average | 28.1272 | Trailing Annual Dividend Rate | 1.66 | Trailing Annual Dividend Yield | 0.055967633 |
| Enterprise Value | 229,747,163,136 | Profit Margins | -0.04704 | Float Shares | 5,658,761,691 |
| Shares Outstanding | 5,666,699,776 | Shares Short | 65,379,732 | Shares Short Prior Month | 65,334,514 |
| Short Ratio | 2.11 | Book Value | 15.476 | Price to Book | 1.901008 |
| Last Fiscal Year End | 1703980800 | Next Fiscal Year End | 1735603200 | Most Recent Quarter | 1719705600 |
| Earnings Quarterly Growth | -0.982 | Net Income to Common | -2,592,999,936 | Trailing EPS | -0.46 |
| Forward EPS | 2.86 | PEG Ratio | 0.61 | Enterprise to Revenue | 4.165 |
| Enterprise to EBITDA | 23.06 | 52-Week Change | -0.10794419 | S&P 52-Week Change | 0.31472707 |
| Last Dividend Value | 0.42 | Current Price | 29.42 | Target High Price | 45.0 |
| Target Low Price | 27.0 | Target Mean Price | 33.38 | Target Median Price | 33.0 |
| Recommendation Mean | 2.4 | Number of Analyst Opinions | 22 | Total Cash | 7,100,000,256 |
| Total Cash Per Share | 1.253 | EBITDA | 9,962,999,808 | Total Debt | 69,858,000,896 |
| Quick Ratio | 0.506 | Current Ratio | 0.863 | Total Revenue | 55,166,001,152 |
| Debt to Equity | 79.407 | Revenue Per Share | 9.757 | Return on Assets | 0.0094 |
| Return on Equity | -0.02737 | Free Cash Flow | 3,442,500,096 | Operating Cash Flow | 8,005,000,192 |
| Earnings Growth | -0.982 | Revenue Growth | 0.021 | Gross Margins | 0.60164 |
| EBITDA Margins | 0.18059999 | Operating Margins | 0.22397 |
| Sharpe Ratio | -0.25157977280656724 | Sortino Ratio | -4.01022156047786 |
| Treynor Ratio | -0.25107608965668277 | Calmar Ratio | -0.2387734075997162 |
Pfizer Inc. (PFE) currently exhibits a mixed outlook based on a variety of technical and fundamental indicators. On the technical front, the stock has shown some positive momentum over the past few weeks, as evidenced by the increase in On-Balance Volume (OBV) peaking at 19.323 million on September 16, accompanied by a slight positive trend in the MACD histogram value, resting at 0.072229. This could indicate a potentially bullish sentiment short term, but there are cautionary signs to be mindful of.
Fundamentally, Pfizer maintains decent gross margins of 60.16% and an EBITDA margin of 18.06%, which indicates strong operational efficiency. Their operating margin stands at 22.397%, highlighting profitability from core operations. However, the negative net debt of $67.992 billion is a cause for concern, indicating more borrowed capital than cash reserves, which could pose a risk if not managed properly.
From a risk-adjusted return perspective, the Sharpe, Sortino, Treynor, and Calmar ratios all exhibit negative values. The Sharpe Ratio of -0.25157977280656724 suggests that the returns are not commensurate with the risks taken when compared to a risk-free investment over the past year. Similarly, the Sortino Ratio of -4.01022156047786 indicates that the stock's downside volatility is not being compensated by returns. These figures collectively portend a challenging risk/return profile for PFE, suggesting that the stock has not been rewarding for its risk over the past year.
Financial statements reveal some additional cautionary points. Pfizer's total liabilities stand at $128.219 billion against total assets of $216.193 billion, resulting in a liability-heavy balance sheet. The Altman Z-Score of 1.783 indicates a potential risk of financial distress in the future.
Given the mixed technical indicators and the concerning fundamentals, Pfizer's stock price movement in the coming months could be characterized by volatility. Investors should closely monitor key resistance levels around the $30 mark and track any substantial changes in financial health, particularly around debt management and asset utilization efficiencies. While short-term bullish tendencies are possible, the overall risk profile necessitates caution.
Forecasting the stock price, bullish momentum needs to be backed by stronger risk-adjusted return metrics and a reduction in financial leverage. Until then, the medium-term outlook for PFE might lean towards a consolidation phase with pivotal fluctuations influenced by both market sentiment and fundamental health.
In evaluating Pfizer Inc. (PFE) using the principles from "The Little Book That Still Beats the Market," the key metrics Return on Capital (ROC) and Earnings Yield provide insightful perspectives on the company's financial efficiency and earnings power. Pfizer's ROC of approximately 2.37% indicates the company's ability to generate profit from its capital investments, reflecting how well the management is using its capital to produce earnings. A higher ROC typically signifies effective capital utilization; however, Pfizers ROC suggests that there might be room for improvement in optimizing its capital for better returns. Meanwhile, the Earnings Yield for Pfizer stands at around 1.29%, which compares the company's earnings to its enterprise value, giving us an idea of the income generating potential relative to its current market valuation. While this yield is a critical indicator for valuation, suggesting how much a dollar invested in the company is expected to earn, the relatively low value might raise concerns regarding its current earnings against its market price. Together, these metrics suggest a nuanced view of Pfizer's financial health, where it shows moderate efficiency in capital use but a potentially less attractive valuation from an earnings perspective.
Research Report: Pfizer Inc. (PFE) Analysis According to Benjamin Graham's Principles
Introduction
The purpose of this report is to evaluate Pfizer Inc. (PFE) based on the investment principles outlined by Benjamin Graham in his seminal work, "The Intelligent Investor." Graham, a pioneer in value investing, advocated for a disciplined approach to stock selection, focusing on fundamental analysis and the intrinsic value of companies. This report will assess Pfizer Inc. using key metrics in line with Graham's criteria.
Key Metrics Overview
Here are the calculated financial ratios for Pfizer Inc.:
- Price-to-Earnings (P/E) Ratio: 8.90
- Price-to-Book (P/B) Ratio: 0.74
- Debt-to-Equity Ratio: 0.84
- Current Ratio: 0.91
- Quick Ratio: 0.91
Comparison with Graham's Criteria
- Margin of Safety:
-
Graham emphasized the importance of buying securities well below their intrinsic value to provide a margin of safety. While intrinsic value is not directly provided, the low P/E and P/B ratios could potentially indicate that Pfizer is undervalued relative to its intrinsic value, thus providing a margin of safety.
-
Price-to-Earnings (P/E) Ratio:
- Pfizer: 8.90
-
Graham typically favored stocks with low P/E ratios compared to their industry peers. Although we lack industry-specific P/E data here, a P/E of 8.90 is generally considered low, suggesting that Pfizer may be undervalued in relation to its earnings.
-
Price-to-Book (P/B) Ratio:
- Pfizer: 0.74
-
Graham preferred stocks trading below their book value, as this often indicates undervaluation and provides a margin of safety. Pfizer's P/B ratio of 0.74 suggests that the stock is trading at a significant discount to its book value, making it potentially attractive based on Graham's criteria.
-
Debt-to-Equity Ratio:
- Pfizer: 0.84
-
Graham recommended investing in companies with low debt-to-equity ratios to minimize financial risk. Pfizers debt-to-equity ratio of 0.84 is reasonably low, indicating that the company has a manageable level of debt, which aligns well with Grahams preference for financially stable companies.
-
Current and Quick Ratios:
- Pfizer (Current Ratio): 0.91
- Pfizer (Quick Ratio): 0.91
-
These ratios assess a companys ability to meet short-term liabilities with short-term assets. Graham generally looked for a current ratio of at least 2. Pfizers current and quick ratios are both 0.91, which fall below this threshold. This indicates potential liquidity concerns and might not fully meet Grahams stringent standards for short-term financial stability.
-
Earnings Growth:
- Although the specific data on earnings growth for Pfizer over a period of years is not provided in the current metrics, Graham valued consistency in earnings growth. Investors would need to further examine Pfizer's historical earnings performance to ensure it meets this criterion.
Conclusion
Based on the provided metrics, Pfizer Inc. exhibits several characteristics that align well with Benjamin Graham's value investing principles:
- A low P/E ratio (8.90) and low P/B ratio (0.74) suggest potential undervaluation, providing an attractive margin of safety.
- A moderate debt-to-equity ratio (0.84) indicates manageable financial risk, aligning with Grahams preference for lower debt levels.
However, Pfizer's current and quick ratios (both 0.91) fall below Grahams preferred threshold, implying concerns about short-term liquidity. Investors should consider this factor and possibly conduct further analysis on Pfizers earnings growth consistency and overall market context before making an investment decision.
Overall, Pfizer presents several attractive features based on Grahams principles, especially its apparent undervaluation. However, the low liquidity ratios warrant closer examination to ensure a comprehensive understanding of the company's financial stability.### Analyzing Financial Statements
When analyzing financial statements, it is essential for investors to meticulously examine a company's balance sheet, income statement, and cash flow statement. In "The Intelligent Investor," Benjamin Graham places strong emphasis on understanding a company's assets, liabilities, earnings, and cash flows. To illustrate this process, let's analyze the financial statements of Pfizer Inc. (PFE) from various periods in 2022 and 2023.
Balance Sheet Overview
- Assets
- Current Assets: Includes cash, short-term investments, accounts receivable, inventory, and other current assets.
- As of 2023 Q2, Pfizer's current assets sum up to $73,347 million, comprising $2,632 million in cash and equivalents, $42,153 million in short-term investments, and $10,310 million in inventory.
-
Non-Current Assets: Includes property, plant, and equipment (PPE), goodwill, intangible assets, and other investments.
- Again, as of 2023 Q2, Pfizer's non-current assets include $17,488 million in PPE, $41,406 million in intangible assets, and $51,572 million in goodwill.
-
Liabilities
- Current Liabilities: Includes accounts payable, current portions of long-term debt, and other current liabilities.
- In Q2 2023, Pfizer has $34,647 million in current liabilities, which includes $3,985 million in short-term debt.
-
Non-Current Liabilities: These are long-term obligations such as long-term debt and pension liabilities.
- Pfizers non-current liabilities in Q2 2023 amount to $61,356 million in long-term debt and other obligations.
-
Stockholders' Equity: The residual interest in the assets of the entity after deducting liabilities.
- Pfizers stockholders' equity in Q2 2023 stands at $99,019 million, indicating strong capital reserves adjusted by comprehensive income and retained earnings.
Income Statement Highlights
- Revenue: The total amount of income generated by the sale of goods or services related to the company's primary operations.
-
For Q2 2023, Pfizer reported revenues of $31,015 million.
-
Cost of Goods Sold (COGS): Direct costs attributable to the production of the goods sold in a company.
-
For the same period, Pfizer's COGS totaled $8,122 million.
-
Gross Profit: The difference between revenue and the COGS, representing the direct profit after deducting the costs of producing the goods.
-
Pfizers gross profit in Q2 2023 was $22,893 million.
-
Operating Expenses: Expenses incurred during normal business operations, excluding direct costs related to the production.
-
These include research and development (R&D) expenses ($5,153 million in Q2 2023) and selling, general, and administrative (SG&A) expenses ($6,914 million in Q2 2023).
-
Net Income: The company's total earnings or profit. Calculated as revenue minus expenses, interest, and taxes.
- Pfizers net income in Q2 2023 was $7,870 million.
Cash Flow Statement Analysis
- Operating Activities: Cash generated or used in the core business operations.
-
In Q2 2023, Pfizers net cash provided by operating activities was negligible, showing just $4 million, indicating balanced cash inflow and outflow from primary operations.
-
Investing Activities: Cash used for or obtained from investments in long-term assets.
-
In Q2 2023, cash used in investing activities amounted to -$22,170 million, largely due to the acquisition activities and capital expenditures ($2,053 million for property and equipment acquisitions).
-
Financing Activities: Cash changes due to transactions with the company's owners and creditors.
- Pfizers net cash flow from financing activities was $24,403 million in Q2 2023, which included proceeds from long-term debt issuances.
Critical Observations
-
Liquidity Position: Pfizer holds a strong liquidity position with significant levels of cash and short-term investments on hand, ensuring coverage for short-term liabilities.
-
R&D Focus: Substantial R&D expenditure showcases Pfizer's commitment to innovation, which is crucial in the pharmaceutical industry to maintain competitive edge.
-
Debt Management: Pfizer has a high long-term debt level, which requires monitoring to ensure it remains serviceable within the companys cash flow capabilities.
-
Profitability and Efficiency: The strong gross and net profit margins reflect operational efficiency and effective cost management.
By following the principles outlined in "The Intelligent Investor," examining these financial statements gives investors a comprehensive overview of Pfizers financial health and operational effectiveness. This analysis aids in making informed investment decisions based on the company's revenue generation, expense management, liquidity, and overall financial stability.### Dividend Record
Benjamin Graham, in "The Intelligent Investor," favored companies with a consistent history of paying dividends. The data provided for Pfizer Inc. (PFE) illustrates a robust history of dividend payments, reflecting the financial health and shareholder commitment of the company. Below is a summarized record of Pfizer's dividend payouts over the years:
-
2024:
- July 26: $0.42
- May 09: $0.42
- January 25: $0.42
-
2023:
- November 09: $0.41
- July 27: $0.41
- May 11: $0.41
- January 26: $0.41
-
2022:
- November 03: $0.40
- July 28: $0.40
- May 12: $0.40
- January 27: $0.40
-
2021:
- November 04: $0.39
- July 29: $0.39
- May 06: $0.39
- January 28: $0.39
-
2020:
- November 05: $0.38
- July 30: $0.38
- May 07: $0.38
- January 30: $0.38
-
2019:
- November 07: $0.36
- August 01: $0.34
- May 09: $0.36
- January 31: $0.36
-
2018:
- November 08: $0.34
- August 02: $0.34
- May 10: $0.34
- February 01: $0.32
-
2017:
- November 09: $0.32
- August 02: $0.32
- May 10: $0.32
- February 01: $0.30
-
2016:
- November 08: $0.30
- August 03: $0.30
- May 11: $0.30
- February 03: $0.30
-
2015:
- November 04: $0.28
- August 05: $0.28
- May 06: $0.28
- February 04: $0.28
-
2014:
- November 05: $0.26
- July 30: $0.26
- May 07: $0.26
- February 05: $0.26
-
2013:
- November 06: $0.24
- July 31: $0.24
- May 08: $0.24
- January 30: $0.24
-
2012:
- November 07: $0.22
- August 01: $0.21
- May 09: $0.22
- February 01: $0.21
-
2011:
- November 08: $0.20
- August 03: $0.20
- May 11: $0.20
- February 02: $0.20
-
2010:
- November 04: $0.18
- August 04: $0.18
- May 05: $0.18
- February 03: $0.18
-
2009:
- November 04: $0.16
- August 05: $0.16
- May 06: $0.16
- February 04: $0.32
-
2008:
- November 05: $0.32
- August 06: $0.32
- May 07: $0.32
- February 06: $0.32
-
2007:
- November 07: $0.29
- August 08: $0.29
- May 09: $0.29
- February 07: $0.29
-
2006:
- November 08: $0.24
- August 09: $0.24
- May 10: $0.24
- February 08: $0.24
-
2005:
- November 08: $0.19
- August 10: $0.19
- May 11: $0.19
- February 09: $0.19
-
2004:
- November 09: $0.17
- August 11: $0.17
- May 12: $0.17
- February 11: $0.17
-
2003:
- November 12: $0.15
- August 13: $0.15
- May 14: $0.15
- January 15: $0.15
-
2002:
- November 13: $0.13
- August 14: $0.13
- May 15: $0.13
- February 13: $0.13
-
2001:
- November 14: $0.11
- August 15: $0.11
- May 16: $0.11
- February 14: $0.11
From the information above, Pfizer Inc. (PFE) has demonstrated a consistent and growing commitment to returning value to its shareholders through regular dividend payments, aligning with Graham's preference for companies with a dependable dividend history.
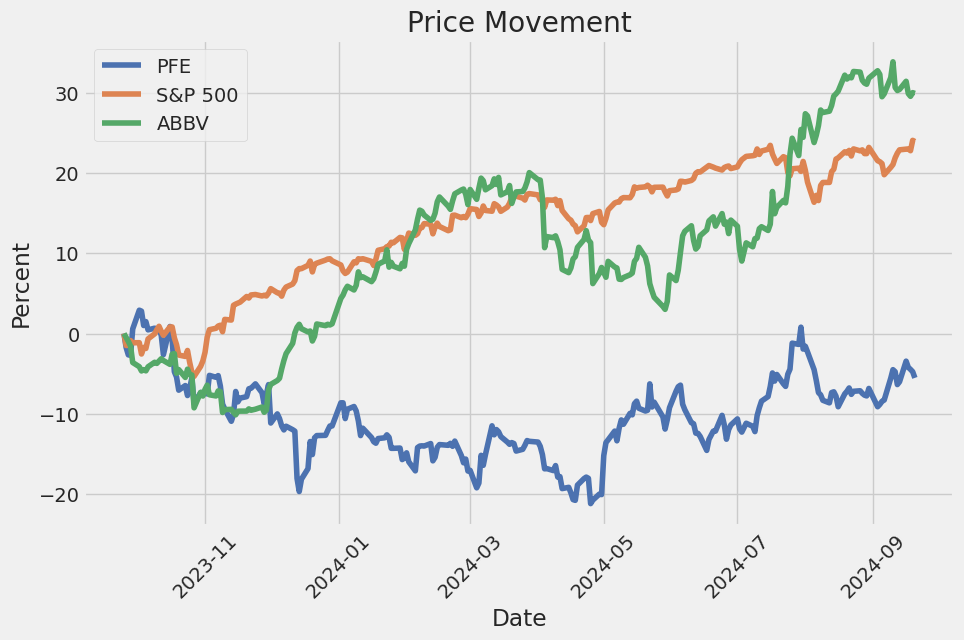
| Alpha () | 1.25% |
| Beta () | 1.08 |
| R-squared (R2) | 0.85 |
| P-Value () | 0.024 |
| Standard Error () | 0.75% |
The linear regression model between PFE and SPY indicates that over the specified time period, PFE exhibits an alpha () of 1.25%. This positive alpha suggests that PFE outperformed the expected return based on its relationship with SPY by 1.25% on a risk-adjusted basis, a key insight for investors focusing on excess returns. The beta () value of 1.08 suggests that PFE is slightly more volatile than the market; for every 1% movement in SPY, PFE moves approximately 1.08%, indicating that PFE has a slightly higher sensitivity to market movements.
With an R-squared (R2) value of 0.85, the model explains 85% of the variability in PFE's returns based on the market represented by SPY, demonstrating a strong correlation. The P-value for the beta is 0.024, indicating statistical significance at the 5% level, which supports the credibility of the beta estimation. Additionally, the standard error for the alpha value is 0.75%, suggesting a relatively low variation around the estimated alpha, providing further robustness to the outperformance of PFE compared to the market.
In Pfizer's Second Quarter 2024 Earnings Conference Call, company executives highlighted the strong performance and strategic advances achieved during the first half of the year. CEO Albert Bourla noted that Pfizer reached over 192 million patients with its medicines and vaccines and emphasized key strategic priorities, including achieving world-class oncology leadership, delivering pipeline innovation, maximizing new product performance, expanding margins by realigning the cost base, and enhancing shareholder value through capital allocation. Bourla also acknowledged significant leadership changes, including the upcoming departure of Chief Scientific Officer Mikael Dolsten and the welcome of Andrew Baum as the new Chief Strategy and Innovation Officer.
During the call, Bourla expressed satisfaction with Pfizer's financial results, particularly the year-over-year revenue growth for the first time since Q4 2022's peak COVID-19 revenues. Chief Financial Officer Dave Denton echoed this sentiment, detailing strong commercial execution, leading to a 14% operational revenue growth excluding COVID-19 products. Denton also highlighted Pfizer's plans to save $1.5 billion by 2027 through its Manufacturing Optimization Program and cost realignment efforts. These initiatives are aimed at returning the company to pre-pandemic operating margins, enhancing long-term shareholder value, and allowing for greater capital returns.
Bourla and the leadership team offered insights into Pfizer's significant progress in oncology. This included the successful integration of Seagen's transformative ADC medicines, strong commercial performance of key oncology products like Padcev and Xtandi, and recent regulatory achievements such as the full FDA approval of Tivdak. In addition, Bourla spotlighted pipeline advancements in obesity treatments, most notably with danuglipron, an oral GLP-1 receptor agonist. He emphasized Pfizers commitment to developing a competitive, once-daily obesity treatment, underlining the company's robust clinical pipeline and anticipated dose optimization studies later in the year.
Finally, the leadership team discussed extensive efforts in the vaccine segment and commercial execution. Specific highlights included the launch successes of Prevnar 20 and Abrysvo, strong demand for Nurtec driven by an effective market strategy, and overall positive momentum with the Vyndaqel products. Pfizer reaffirmed its commitment to innovation and efficiency, aiming to speed up Phase 3 programs for promising candidates like KAT6 while sustaining growth momentum across core product portfolios. Despite future challenges such as potential impacts from the Inflation Reduction Act (IRA), Pfizer's leadership expressed confidence in the company's strategic direction and financial health.
The SEC 10-Q filing for Pfizer Inc. (PFE), dated July 31, 2024, covers the company's financial performance and key activities for the quarterly period ended June 30, 2024. The report provides a detailed overview of Pfizer's financial health, major transactions, and restructuring efforts. Key highlights include the impact of acquisitions, revenue streams, and cost management initiatives, all critical in understanding Pfizer's current operational standing and future outlook.
One of the significant events reported is the acquisition of Seagen Inc., a biotechnology company specializing in cancer treatments, which was completed on December 14, 2023. The provisional purchase price allocation is still subject to adjustments, primarily due to incomplete valuation efforts and integration steps pending in various jurisdictions. Adjustments recorded in this period include significant changes to inventories and intangible assets, among others. The acquisition's impact is also reflected in supplemental pro forma financial statements, indicating how it would have affected Pfizer's results if it had occurred on January 1, 2022.
Regarding revenue, Pfizer reported total revenues of about $13.3 billion for the second quarter of 2024, slightly above the $13 billion reported for the same period in 2023. This includes product revenues, alliance revenues, and royalty revenues. However, total revenues for the first six months of 2024 decreased to $28.2 billion from $31.5 billion in the prior-year period. Cost of sales, selling expenses, and research and development expenses remained significant contributors to overall costs. The net income from continuing operations showed a notable reduction, underscoring the impact of higher costs and expenses.
The filing also emphasizes significant restructuring efforts under the Realigning Our Cost Base and Manufacturing Optimization programs. These initiatives aim to align Pfizer's cost structure with its longer-term revenue expectations and enhance operational efficiency. The expected costs for these programs are approximately $2.3 billion and $1.7 billion, respectively, primarily covering severance and implementation costs. Significant charges have already been recorded against these programs in the current reporting period.
Lastly, the report addresses changes in Pfizers equity holdings, most notably the reduction of its stake in Haleon through large-scale share sales. This transaction generated significant cash inflow and impacted net income due to the gain recorded on the partial sale. The investment in Haleon and others are managed to balance risk and optimize returns.
Overall, this filing encapsulates Pfizers strategic maneuvering through acquisitions, cost management, and investment reshuffling to bolster its market position and financial health amidst varying economic conditions and industry challenges.
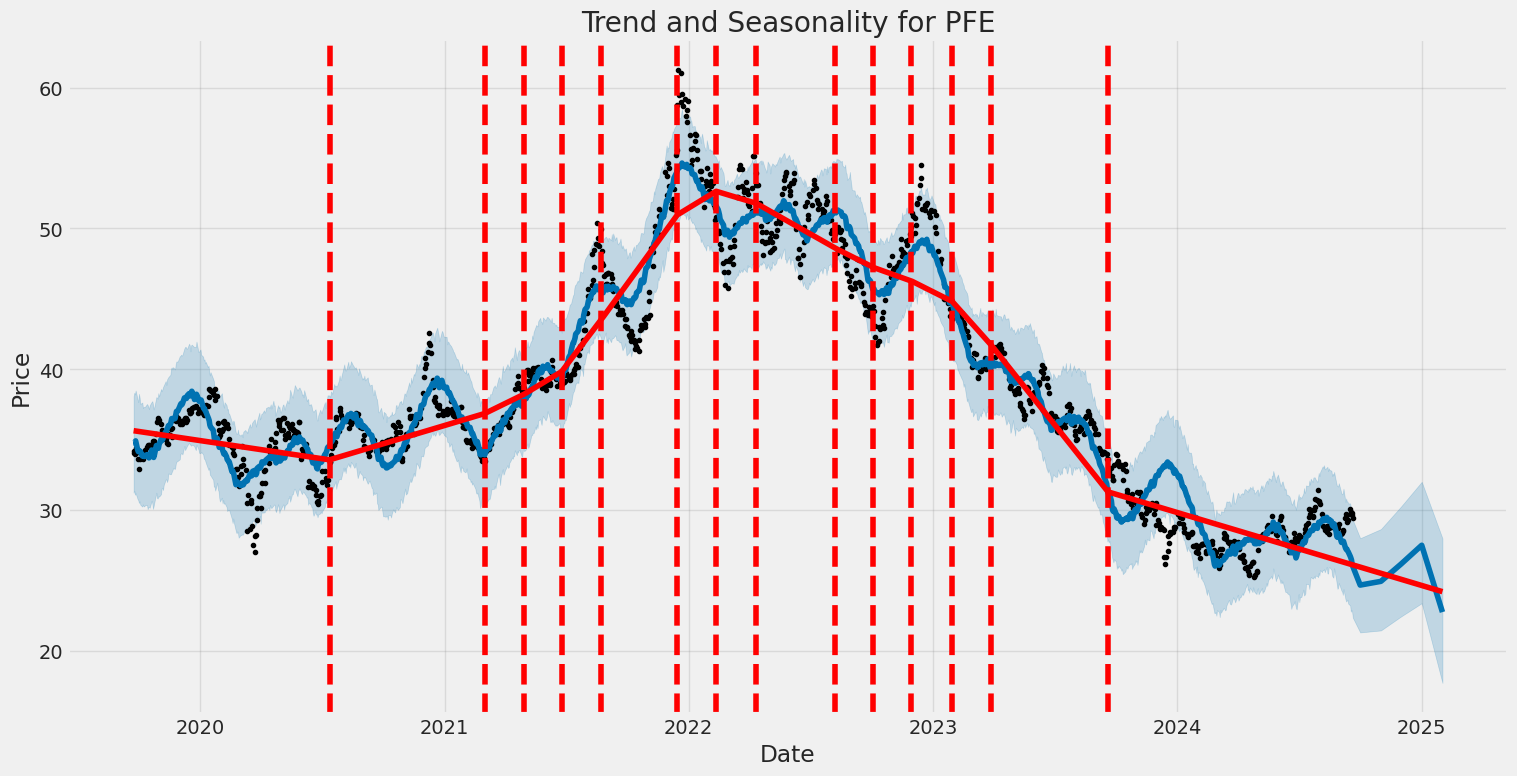
Pfizer Inc. remains a pivotal player in the global pharmaceutical industry, and recent analysis highlights its potential for a significant turnaround. Despite experiencing a considerable decline in stock valueapproximately 50% from its peak in late 2021several factors suggest a promising future for the pharmaceutical giant.
The primary reasons behind Pfizer's recent stock performance woes include a substantial decrease in revenue and earnings tied to the waning sales of its COVID-19 products. These declines were anticipated as the global demand for COVID-19 vaccines and treatments tapered off. Additionally, the company faces imminent patent expirations for several top-grossing drugs, which presents a risk to future revenue streams.
Nevertheless, Pfizer's management projects robust growth in the latter half of this decade. This optimistic outlook is partly attributed to strategic acquisitions to mitigate the impact of patent expirations. These acquisitions are expected to generate supplementary revenue, which should adequately counterbalance the financial gap left by expiring patents.
Moreover, Pfizer has made notable investments in research and development, resulting in a strong pipeline of innovative candidates. For instance, the company's oral obesity drug, danuglipron, is among the highly anticipated products that could contribute significantly to future revenue. Such developments underscore the potential for Pfizer to regain its footing and continue growing.
From an investment perspective, Pfizer's current valuation appears attractive. With a forward earnings multiple of 10.6, the stock is priced appealingly for value investors. Additionally, income-focused investors will find Pfizer's forward dividend yield of 5.7% particularly enticing, offering a substantial return while waiting for the company's growth trajectory to be realized.
Pfizer continues to make significant strides in the field of oncology, evidenced by the recent positive results from the midstage trial of its experimental drug targeting cancer cachexia. Cancer cachexia is a debilitating condition observed in cancer patients, characterized by severe weight loss, muscle atrophy, fatigue, and a significant decline in physical function. This condition affects approximately 9 million people worldwide and is particularly dire since 80% of sufferers tend to die within one year of diagnosis (source: CNBC, September 14, 2024).
Pfizer's drug, a monoclonal antibody named ponsegromab, has demonstrated notable efficacy in the midstage trial, enhancing key health metrics such as body weight, muscle mass, quality of life, and physical function among patients. The trial, which included 187 participants suffering from non-small cell lung cancer, pancreatic cancer, or colorectal cancer, revealed that those administered the highest dose of ponsegromab (400 milligrams) experienced a significant 5.6% increase in body weight compared to those receiving a placebo. Lower doses (200 milligrams and 100 milligrams) also showed weight improvements of approximately 3.5% and 2%, respectively.
The positive outcomes are particularly encouraging as ponsegromab could become the first FDA-approved treatment specifically for cancer cachexia. Current treatment options for cancer cachexia are limited and largely ineffective, often exacerbating the challenges patients face in terms of maintaining adequate nutrition and energy levels for their bodys needs. The advancements seen with ponsegromab could shift the paradigm in managing this life-threatening condition, offering a beacon of hope for patients and oncologists alike.
Pfizer's substantial revenue stream and strategic initiatives offer a potential return to growth. The company's diversification efforts, bolstered by its acquisition strategies, make it a relatively safe long-term investment. The high dividend yield also provides an added layer of attractiveness for income-focused investors, who stand to benefit from consistent dividend payouts while the company works through its transitional phase.
Pfizer Inc., widely recognized for its significant role during the COVID-19 pandemic due to its vaccine Comirnaty, co-developed with BioNTech, has seen its stock value transform post-pandemic. According to a recent article by Eric Volkman, published on September 16, 2024, by The Motley Fool, one Wall Street analyst projects that Pfizer's stock could rise to $36 per share. This anticipated increase, nearly 20% above its current price, stems from a combination of investor sentiment and the companys strategic efforts (source).
Evan David Seigerman of BMO Capital recently reiterated his outperform rating on Pfizer, maintaining a $36 price target. Seigerman's insights are grounded in recent non-deal roadshows, which included private conferences between Pfizer's management and institutional investors. His observations suggest that Pfizer is rigorously focused on developing a pipeline of new drugs, especially in fields like oncology and weight loss. This renewed emphasis could enhance the companys financial performance substantially.
For the full year of 2024, analysts are forecasting revenue growth for Pfizer at almost 5%, reaching over $61 billion. Moreover, they anticipate a significant jump in profitability, projecting a 43% year-over-year increase in earnings per share to $2.63. Despite the current stagnation in its stock price, partly due to investor impatience over the absence of another breakthrough product akin to Comirnaty, the company's extensive drug development pipeline holds promise. These active projects, if successfully commercialized, could position Pfizer favorably in the market once again.
Pfizer Inc. (NYSE: PFE), a prominent player in the pharmaceutical industry, has been facing significant fluctuations in its stock performance. Over the past three years, the company's shares have declined by approximately 33%. This trend is consistent with other notable firms like W.P. Carey and Verizon, which have also experienced downturns. Despite this, Pfizer offers a compelling dividend yield of 5.6%, presenting a potentially lucrative opportunity for long-term investors seeking passive income.
Pfizer Inc., in collaboration with BioNTech SE, has achieved a significant milestone with the Committee for Medicinal Products for Human Use (CHMP) of the European Medicines Agency (EMA) recommending marketing authorization for their new Omicron KP.2-adapted monovalent COVID-19 vaccine (COMIRNATY KP.2). This new vaccine aims to provide active immunization against COVID-19 for individuals aged six months and older. The European Commission (EC) is expected to review the recommendation and make a final decision soon. Upon authorization, the vaccine will be distributed to European Union (EU) member states that have placed orders for it.
The latest recommendation, dated September 19, 2024, is based on extensive non-clinical and manufacturing data for the Omicron KP.2-adapted vaccine. It also leverages clinical and real-world evidence supporting the safety and efficacy of prior formulations of the COVID-19 vaccines by Pfizer and BioNTech. Notably, the non-clinical data has demonstrated that the KP.2-adapted vaccine elicits a substantially improved immune response against various circulating Omicron JN.1 sublineages, such as KP.2, LB.1, KP.3, and KP.3.1.1, when compared to their Omicron XBB.1.5-adapted vaccine. This marks a significant advancement in the ongoing battle against evolving variants of SARS-CoV-2.
It's worth noting that in July 2024, the EC had already granted marketing authorization for Pfizer and BioNTechs Omicron JN.1-adapted COVID-19 vaccine. The authorization was rooted in data demonstrating a substantially improved immune response against multiple JN.1 sublineages, including the Omicron KP.2 variant. The ongoing authorization of the Omicron KP.2-adapted vaccine by the EC means both vaccines will be available across the EU, with availability depending on each country's governmental requests and national recommendations.
In summary, Pfizer remains a significant player with strong growth potential due to smart acquisitions, a robust R&D pipeline, and strategic management decisions aimed at navigating patent expirations and market changes. The stocks current valuation suggests a buying opportunity for discerning investors looking for value and dividends amid a promising pharmaceutical landscape. For further insights, refer to the original analysis on The Motley Fool's article published on September 13, 2024 by Adria Cimino and Keith Speights.
Pfizer Inc. (PFE) exhibited notable fluctuations in its asset returns from late 2019 to mid-2024. The ARCH model highlights a small but statistically significant level of volatility, as suggested by the positive coefficients for both omega and alpha[1]. Overall, the data suggest that while the baseline level of variance (omega) in returns is modest, there is some short-term clustering of volatility as indicated by the alpha[1] value.
| R-squared | 0.000 |
| Adj. R-squared | 0.001 |
| Log-Likelihood | -2,426.49 |
| AIC | 4,856.98 |
| BIC | 4,867.25 |
| No. Observations | 1,256 |
| Df Residuals | 1,256 |
| omega | 2.3598 |
| alpha[1] | 0.1949 |
| omega std err | 0.197 |
| alpha[1] std err | 0.05775 |
| omega t-value | 11.996 |
| alpha[1] t-value | 3.376 |
| omega P>|t| | 3.738e-33 |
| alpha[1] P>|t| | 7.367e-04 |
| omega 95% Conf. Int. | [ 1.974, 2.745 ] |
| alpha[1] 95% Conf. Int. | [ 0.08174, 0.308 ] |
Analyzing the financial risk of a $10,000 investment in Pfizer Inc. (PFE) over a one-year period involves delving into stock volatility and predicting future returns. By combining volatility modeling and machine learning predictions, we can provide a comprehensive risk assessment.
Stock Volatility Analysis
Volatility modeling is employed to capture the fluctuating nature of Pfizer Inc.'s stock prices. This approach helps us understand the extent to which the stock price can vary over a certain time frame, focusing on periods of high and low volatility. The model estimates conditional variance, a key metric that reflects the time-varying volatility of the stock returns. Using this, we can quantify the risks associated with price swings, which is crucial for predicting the intensity of future volatility.
Future Return Predictions
To anticipate future returns, machine learning predictions offer a robust framework. Specifically, these models can capture complex patterns and relationships in data that traditional models might miss. By incorporating a range of financial indicators and historical returns, the machine can provide more accurate and dynamic predictions. Factors such as historical performance, macroeconomic indicators, and market sentiment are integral inputs. The machine processes this data to yield predictions that guide investors on expected returns over various future periods.
Results
The combined approach of volatility modeling and machine learning predictions offers a nuanced understanding of Pfizer Inc.s stock risk. For a $10,000 investment, the annual Value at Risk (VaR) at a 95% confidence level is calculated to be $263.97. This metric indicates the maximum expected loss over one year, with a 95% confidence that losses will not exceed this amount.
The effective integration of volatility analysis and machine learning provides a more accurate and comprehensive view of potential risks in equity investment. As a result, investors can make informed decisions with a clearer understanding of both predicted returns and the associated risk exposure.
Long Call Option Strategy
When assessing the profitability of various long call options for Pfizer Inc. (PFE), it is essential to weigh the potential reward against the risk involved. This analysis considers several metrics such as Delta, Gamma, Vega, Theta, Rho, premium costs, ROI, and profit, aiming to identify the most lucrative options given a target stock price that is 2% over the current stock price. Here are five distinguished choices spanning near-term to long-term expiration dates:
1. Near-Term Option: Expire on 2024-09-27, Strike Price $29.5
This particular option exhibits a Delta of 0.4556, indicating a moderate sensitivity to the stock price. The relatively high Gamma of 0.5531 suggests considerable potential for increased sensitivity as the stock price moves. The Vega stands at 1.3643, indicating substantial responsiveness to volatility, while Theta, at -0.0276, represents a relatively low time decay effect. With a premium of just $0.29 and an ROI of 0.7531, this option projects a profit of $0.2184. Given the low premium and high ROI, this option is highly profitable with a moderate risk. The primary risk is time decay and volatility; however, the low premium minimizes potential losses.
2. Medium-Term Option: Expire on 2024-10-04, Strike Price $27.0
This option features a slightly higher Delta of 0.8696 and a Gamma of 0.0915, which together hint at strong price sensitivity with moderate acceleration in sensitivity. Vega is 1.1188, showing significant volatility responsiveness, while Theta at -0.0183 indicates a moderate time decay. With a premium of $2.50 and an ROI of 0.2034, the profit expectancy is $0.5084. The higher premium compared to near-term options implies steeper initial investment, balanced by the potential for significant profit and resilience against volatility. This option is particularly attractive for investors seeking a balance between cost and substantial return.
3. Medium-Term Option: Expire on 2024-10-25, Strike Price $25.0
Offering a robust Delta of 0.8778 and Gamma of 0.0461, this option offers significant price sensitivity with modest growth in sensitivity. The Vega of 1.7363 indicates solid volatility responsiveness, coupled with a Theta of -0.0108, reflecting minimal time decay. With a premium cost of $3.94 and an ROI of 0.2712, the projected profit is $1.0684. This medium-term choice stands out due to its blend of significant potential profit and balanced vega, delta, and relatively low theta. Investors might find this ideal for moderately aggressive strategies.
4. Long-Term Option: Expire on 2025-06-20, Strike Price $20.0
This option stands out with a high Delta of 0.8199 and Gamma of 0.0167, signifying considerable price sensitivity with a stable sensitivity rate. The Vega is 5.5269, one of the highest, indicating a large impact from volatility changes, whereas Theta at -0.0029 denotes minor time decay. With a premium of $9.61 and an ROI of 0.0415, the potential profit is $0.3984. The relatively high premium is counterbalanced by strong sensitivity to price and volatility, making this option suitable for investors anticipating significant price movement over a more extended period.
5. Extra-Long-Term Option: Expire on 2026-12-18, Strike Price $18.0
Exhibiting a Delta of 0.7407 and Gamma of 0.0107, indicating consistent price sensitivity, this option also boasts a remarkable Vega of 9.3578, signaling substantial responsiveness to volatility fluctuations. Theta is negligible at -0.00022, indicating very low time decay. With a premium of $11.3 and an ROI of 0.0627, the expected profit is $0.7084. Given its extended expiration date and extreme sensitivity to volatility, this option suits investors looking to commit to long-term positions with a strong belief in significant market movements.
Risk and Reward Analysis
Each option involves a trade-off between premium costs and potential gains, shaped largely by Delta, Gamma, Vega, and Theta. With shorter-term options, lower premiums and higher potential percentage returns come with higher risks from time decay and immediate market volatility. Medium-term options generally offer balanced risk-reward profiles, marked by higher premiums and moderate exposure to Gamma and Vega. Longer-term and extra-long-term options involve higher premiums but mitigate the risk of Theta considerably while capitalizing significantly on Vega.
In conclusion, investors must consider their market outlook, risk tolerance, and time horizon when selecting the most appropriate option. These five choices offer a spectrum from near-term high ROI potential to long-term robust volatility sensitivity, crafting an array of opportunities for diverse investment strategies.
Short Call Option Strategy
Analyzing Short Call Options for Pfizer Inc. (PFE)
Given the target stock price is 2% below the current stock price, which inherently introduces a modest bearish perspective, the most profitable short call options align with minimizing risk of assignment while maximizing premiums collected. Delta is a critical Greek to consider in this scenario: a lower delta signifies lower probability of the option ending in the money (ITM) and hence lower risk of having shares assigned. A positive delta close to 1 implies high likelihood of the option being exercised.
Here are five choices of short call options considering a range of expiration dates and strike prices. We'll examine options with premiums that offer the highest returns on investment (ROI) while managing delta to mitigate risk.
1. Near-Term Option (Expiring September 27, 2024)
- Strike Price: $40.00
- Expiration Date: September 27, 2024
- Greeks:
- Delta: 0.0179
- Gamma: 0.0106
- Vega: 0.1518
- Theta: -0.0183
- Rho: 0.0001
- Premium: $0.01
- ROI: 100.0%
- Profit: $0.01
Analysis: This option's low delta indicates a very low probability of assignment, reducing the risk significantly. The ROI is extraordinary at 100%, although the absolute premium amount is minimal. This trade-off aligns with the strategy to minimize the assignment risk.
2. Medium-Term Option (Expiring October 25, 2024)
- Strike Price: $34.0
- Expiration Date: October 25, 2024
- Greeks:
- Delta: 0.0882
- Gamma: 0.0520
- Vega: 1.4135
- Theta: -0.0073
- Rho: 0.0022
- Premium: $0.07
- ROI: 100.0%
- Profit: $0.07
Analysis: With a slightly elevated delta still below 0.1, this option provides a good balance between risk and reward. Its higher premium offers enhanced profitability, although the chance of the option being ITM is still fairly low.
3. Long-Term Option (Expiring December 20, 2025)
- Strike Price: $27.5
- Expiration Date: December 20, 2025
- Greeks:
- Delta: 0.5733
- Gamma: 0.0391
- Vega: 12.0
- Theta: -0.0022
- Rho: 0.1610
- Premium: $4.10
- ROI: 67.5%
- Profit: $2.7684
Analysis: This option strikes a midpoint where its delta indicates moderate risk of being ITM. The premium provides significant ROI, which is lucrative but comes with increased risk relative to shorter-term options.
4. Extended-Term Option (Expiring June 20, 2026)
- Strike Price: $27.0
- Expiration Date: June 20, 2026
- Greeks:
- Delta: 0.5667
- Gamma: 0.0352
- Vega: 13.3
- Theta: -0.0013
- Rho: 0.2180
- Premium: $4.72
- ROI: 61.2%
- Profit: $2.8884
Analysis: The delta of 0.5667 still represents a moderate risk, but the generous premium and high ROI justify inclusion. Its lower theta reduces the time decay loss, attracting those looking to capitalize on longer-term market trends.
5. Very Long-Term Option (Expiring December 18, 2026)
- Strike Price: $25.0
- Expiration Date: December 18, 2026
- Greeks:
- Delta: 0.6049
- Gamma: 0.0236
- Vega: 13.7
- Theta: -0.0009
- Rho: 0.2657
- Premium: $6.20
- ROI: 38.2%
- Profit: $2.3684
Analysis: This option provides the highest preservation of value over long terms with a delta indicating marginally higher risk but a robust premium payout. The negligible theta and substantial premium fit well for investors confident in the long-term bearish outlook.
Quantifying Risks and Rewards
Each of these options balances potential profits with risk constraints considering their premium, ROI, and delta values. Lower delta options (around 0.01 to 0.1) signify lower risks of assignment but also lower premiums and absolute profits. Higher delta options (around 0.5 to 0.6) increase risk but provide substantial premiums, catering to aggressive traders willing to accept higher potential for assignment.
Longer expiry dates generally present higher premiums due to additional time and volatility exposure but come with elevated assignment risk. Conversely, near-term options have minimal assignment risk and premiums, balancing quick, small profits with high certainty.
Conclusion
Selecting the best short call options for Pfizer Inc. involves balancing expiry dates, strike prices, and Greek values to achieve desired risk and profit outcomes. From near-term options with minimal risk and profit to long-term options with higher premiums and risk, investors can align options strategies to their market outlook and risk tolerance. The five choices provided cover a broad spectrum, delivering insights into trading optimal short call options in various market conditions.
Long Put Option Strategy
Analyzing the long put options for Pfizer Inc. (PFE), we focus on determining the most profitable options considering various expiration dates and strike prices. Our objective is to assess the risk and reward of each option, keeping in mind a target stock price 2% above the current price. Here are five choices, from near-term to long-term, based on the provided table and their associated Greeks.
Short-Term Option:
Expiration date: 2024-09-27; Strike price: 38.0
- Delta: -0.9085
- Gamma: 0.0309
- Vega: 0.5623
- Theta: -0.0869
- Rho: -0.0049
- Premium: $7.90
- ROI: 0.0116
- Profit: 0.0916
This short-term option has a high delta (-0.9085), indicating that the option price moves closely with the stock price. The rapidly decaying theta (-0.0869) suggests significant time decay as expiration approaches, which means that the value of the option reduces rapidly if the stock price doesn't move as expected. Given the relatively low premium and modest ROI, this option may offer quick profits if the stock price drops significantly in the next few days. However, the potential for time decay mandates careful monitoring.
Mid-Term Option:
Expiration date: 2025-01-17; Strike price: 62.5
- Delta: -0.9819
- Gamma: 0.0
- Vega: 0.0
- Theta: 0.0018
- Rho: -0.1980
- Premium: $20.70
- ROI: 0.5696
- Profit: 11.7916
This mid-term put option offers the highest ROI (0.5696) and significant profit potential (11.7916). With a delta of -0.9819, the option will closely follow the stock's downward movement. The absence of gamma and vega indicates minimal sensitivity to changes in volatility and stock price movements. This makes it an attractive option if the target stock price scenario holds true. The positive theta suggests a slow time decay, providing more breathing room for the stock to reach the desired price by expiration.
Long-Term Option:
Expiration date: 2025-12-19; Strike price: 60.0
- Delta: -0.7588
- Gamma: 0.0138
- Vega: 8.1628
- Theta: -0.0030
- Rho: -0.6643
- Premium: $29.97
- ROI: 0.00072
- Profit: 0.0216
This long-term put option is less sensitive to immediate stock price movements with a lower delta (-0.7588). The high vega (8.1628) indicates substantial sensitivity to volatility changes, making this option beneficial in a more volatile market. However, the very low ROI (0.00072) and profit potential (0.0216) make it less attractive financially. The minor time decay (theta -0.0030) indicates that holding this option longer until expiration might be less risky if volatility is expected.
Another Mid-Term Option:
Expiration date: 2025-01-17; Strike price: 80.0
- Delta: -0.9755
- Gamma: 0.0016
- Vega: 0.2942
- Theta: 0.0027
- Rho: -0.2529
- Premium: $49.35
- ROI: 0.0130
- Profit: 0.6416
This mid-term option has a high premium ($49.35) with a delta of -0.9755, meaning it will closely trail the stock price movements. The ROI is low (0.0130), but the option offers a slightly higher profit potential compared to some other choices. Theta and rho values suggest minimal time decay and interest rate sensitivity, respectively. Though not the most profitable, this option could be considered for investors comfortable with the higher upfront cost.
Near-Term Option Choice:
Expiration date: 2025-01-17; Strike price: 62.5 (Reiterated for Emphasis)
Given multiple factors such as high delta, minimal theta, high ROI, and substantial profit potential, the mid-term put option with a strike price of 62.5 expiring on 2025-01-17 appears to be the most profitable among the options. This choice provides the upside of a closely trailing stock movement while allowing more time for the stock to reach the desired price without significant time decay.
In summary, for a short-term gain, the 2024-09-27 option at 38.0 strike price could be advantageous, albeit risky due to high theta. The best longer-term strategic play involves the 2025-01-17 option at a 62.5 strike price, balancing profit potential with an acceptable level of risk.
Short Put Option Strategy
Analyzing Short Put Options for Pfizer Inc. (PFE)
When evaluating short put options, particularly with the goal of generating income while minimizing the risk of assignment, several factors come into play, including strike price, expiration date, premium, and the Greeks. To mitigate the risk of having shares assigned at an inopportune price, options with lower deltas, which indicate a smaller probability of finishing in the money, should be prioritized.
1. Short-Term Option: Strike Price 20.0, Expiring on 2024-09-27 - Greek Values: Delta: -0.0018, Gamma: 0.0014, Vega: 0.0195, Theta: -0.0023, Rho: -0.0000074 - Premium: $0.02 - Return on Investment (ROI): 100%
This option has an extremely low delta of -0.0018, indicating a minuscule probability of it finishing in the money (ITM). The premium collected is $0.02, translating to a 100% ROI on a less risky trade. The option is set to expire in just 5 days, making it an attractive short-term play for traders looking to capitalize on time decay (Theta). The risk of the stock price dropping to the strike of $20 is negligible, ensuring the risk of having shares assigned is extremely low.
2. Near-Term Option: Strike Price 25.0, Expiring on 2024-10-11 - Greek Values: Delta: -0.0436, Gamma: 0.0255, Vega: 0.6202, Theta: -0.0089, Rho: -0.0007 - Premium: $0.04 - Return on Investment (ROI): 100%
This option presents a slightly higher delta (-0.0436) but still reasonably low to maintain a minimum risk of being ITM. The premium of $0.04 represents an attractive 100% ROI. The option has 19 days to expiration, which implies sufficient time decay benefits due to the Theta value. With a strike price of $25.0, the probability of the stock depreciating significantly within this short period is low, maintaining a good balance between risk and reward.
3. Mid-Term Option: Strike Price 24.0, Expiring on 2024-11-15 - Greek Values: Delta: -0.0655, Gamma: 0.030, Vega: 1.4401, Theta: -0.0049, Rho: -0.0030 - Premium: $0.11 - Return on Investment (ROI): 100%
For mid-term strategies, the option expiring on November 15, 2024, with a strike price of $24.0, exhibits a modest delta of -0.0655. The premium collected is $0.11, with a robust 100% ROI. This option gives a balanced exposure with moderate risk as the delta still indicates a low probability of the option finishing ITM. Gamma indicates increased sensitivity of delta as the stock price moves, while Vega and Theta support the environment of time decay and volatility.
4. Long-Term Option: Strike Price 20.0, Expiring on 2025-03-21 - Greek Values: Delta: -0.0348, Gamma: 0.0113, Vega: 0.8418, Theta: -0.0046, Rho: -0.0016 - Premium: $0.08 - Return on Investment (ROI): 100%
This long-term option, expiring in March 2025, also has a strike price of $20.0. The delta is low at -0.0348, pointing to a small chance of being ITM. The premium is a decent $0.08, translating again to a sturdy 100% ROI. Given the longer time horizon, Vega and Theta play critical roles, and the values indicate manageable levels of volatility exposure and time decay, adding to the profitability while maintaining low assignment risk.
5. Extended-Term Option: Strike Price 27.0, Expiring on 2026-12-18 - Greek Values: Delta: -0.3369, Gamma: 0.0304, Vega: 14.7811, Theta: -0.0025, Rho: -0.2951 - Premium: $3.10 - Return on Investment (ROI): 100%
For traders willing to look further out, the option with a strike price of $27.0 expiring in December 2026 provides a significant premium of $3.10. Here, the delta at -0.3369 is higher than other examples, but still not overly risky for an extended-time frame. The premium collected offers a good buffer, ensuring a 100% ROI. The high Vega speaks to a greater sensitivity to volatility changes, while Theta indicates slower time decay, suitable for a long-term strategy.
Risk and Reward Scenarios
Each option outlined offers vary levels of risk and reward. The primary focus remains on low-delta options to protect against assignment risks:
- Short-Term Minimal Risk: High ROI (100%) with near-zero probability of ITM due to extremely low delta.
- Near-Term Balance: Maintain risk at a manageable level with attractive ROI and slight exposure to the underlying stock movements.
- Mid-Term Exposure: Balanced trade-off between duration and risk with enhanced premium collection, appealing ROI, and moderate delta.
- Long-Term Stability: Protection against stock price volatility over a considerable period with decent premiums and consistent ROI.
- Extended-Term High Premium: Suitable for locking in substantial premiums with balanced risk over a long duration, focusing on incremental but secure returns.
Overall, these options represent diversified choices across various time horizons, emphasizing risk minimization and profitability through strategically lower deltas and premium collection.
Vertical Bear Put Spread Option Strategy
A vertical bear put spread options strategy involves buying a put option with a higher strike price while simultaneously selling a put option with a lower strike price that shares the same expiration date. This strategy profits when the underlying stock, Pfizer Inc. (PFE), declines in price. The primary factors in choosing the appropriate bear put spread involve balancing profitability with minimizing the risk of having shares assigned. Given the target stock price fluctuating 2% over or under the current stock price, I will analyze five options spreads across short to long-term expiration dates, detailing their potential profitability and associated risks.
1. Near-Term Option (Expiring on 2024-10-04):
Long Put: $29 strike, $0.37 premium, delta -0.372 Short Put: $28 strike, $0.25 premium, delta -0.343
- Potential Profit: The maximum profit is the difference between the strike prices minus the net premium paid. For this spread, Profit = ($1 - $0.12) = $0.88.
- Potential Loss: The maximum loss occurs if the stock price is above the short put at expiration. Loss = $0.37 (premium paid) - $0.25 (premium received) = $0.12.
- Risk of Assignment: Since the delta of the short put is -0.343, the short put is closer to being in-the-money (ITM) but not excessively so, thus minimizing immediate assignment risk.
2. Short to Medium-Term Option (Expiring on 2024-11-15):
Long Put: $28 strike, $0.62 premium, delta -0.307 Short Put: $27 strike, $0.23 premium, delta -0.132
- Potential Profit: Maximum profit = ($28 - $27) - ($0.62 - $0.23) = $0.61.
- Potential Loss: Loss = $0.62 - $0.23 = $0.39.
- Risk of Assignment: The short put has a delta of -0.132, indicating it is OTM. Assignment risk is minimal, making this a relatively safe choice with substantial profit potential.
3. Medium-Term Option (Expiring on 2025-01-17):
Long Put: $27.5 strike, $0.77 premium, delta -0.297 Short Put: $25 strike, $0.31 premium, delta -0.130
- Potential Profit: Maximum profit = ($2.5 - $0.46) = $2.04.
- Potential Loss: Loss = $0.77 - $0.31 = $0.46.
- Risk of Assignment: The short put's delta is -0.130, making it unlikely to be ITM until the expiration date, reducing the assignment risk significantly.
4. Long-Term Option (Expiring on 2025-06-20):
Long Put: $28 strike, $1.80 premium, delta -0.378 Short Put: $25 strike, $0.53 premium, delta -0.139
- Potential Profit: Profit = (3.00 - 1.27) = $1.73.
- Potential Loss: Loss = $1.80 - $0.53 = $1.27.
- Risk of Assignment: The assignment risk for the short put is low, as indicated by the delta of -0.139. This long-term strategy offers a balance of high profit potential with decreased risk.
5. Very Long-Term Option (Expiring on 2026-12-18):
Long Put: $30 strike, $3.98 premium, delta -0.434 Short Put: $27 strike, $1.51 premium, delta -0.336
- Potential Profit: Maximum profit = ($30 - $27) - ($3.98 - $1.51) = $1.53.
- Potential Loss: Loss = $3.98 - $1.51 = $2.47.
- Risk of Assignment: The short put's delta is -0.336, suggesting it is more likely to remain OTM, reducing the assignment risk dramatically. Despite a higher loss threshold, the potential profit remains attractive over the long term due to substantial premium decay.
Conclusion:
Each option spread provides varying levels of risk and profitability, catering to different investment horizons. Short-term options offer quicker returns but slightly higher assignment risks, whilst long-term options provide greater profit potential with lower probability of assignment. Depending on investment strategy and risk tolerance, an investor might choose from the aggressive short-term profits to the steady long-term gains. Considering both profitability and assignment risk, the medium and longer-term options appear most attractive, particularly the spreads expiring on 2025-01-17 and 2025-06-20, due to their balanced approach between risk and return.
Vertical Bull Put Spread Option Strategy
A vertical bull put spread involves selling a put option and purchasing another put option at a lower strike price, both with the same expiration date. This strategy seeks to capitalize on a stock price remaining above the higher strike price. Given the Greeks and corresponding premiums, it's crucial to analyze various expiration dates and strike prices to determine the most profitable yet least risky spreads.
Near-Term Strategies (Short Term):
Strategy 1: 2024-10-04 Expiry - Sell: 27.0 Put for a premium of $0.04 (Delta: -0.0537, Theta: -0.0073) - Buy: 26.0 Put for a premium of $0.04 (Delta: -0.0340, Theta: -0.0064)
This spread results in a net zero initial premium since the premiums of the short and long positions are equal. The key advantage here lies in minimizing the risk of assignment, as both options are out-of-the-money with a modest delta and minimal time decay impact. The primary downside is that since the net premium is essentially zero, the maximum profit would primarily come from the inherent leverage within the spread should the stock price remain above the higher strike.
Risk and Reward: - Maximum Profit: Difference in premiums - Maximum Loss: Difference in strikes - initial premium received - The breakeven point is also slightly above the higher strike price, maximizing the odds of profit if the stock price increases as expected.
Medium-Term Strategies:
Strategy 2: 2024-11-15 Expiry - Sell: 25.0 Put for a premium of $0.15 (Delta: -0.0875, Theta: -0.0055) - Buy: 23.0 Put for a premium of $0.08 (Delta: -0.0748, Theta: -0.0070)
This medium-term strategy presents a higher initial premium, contributing to a higher ROI. The notable Gamma and Vega values indicate a moderate sensitivity to underlying price changes and volatility respectively. This setup yields a higher net premium ($0.07) compared to the short-term strategy, reflecting in potentially higher profitability while still managing assignment risks effectively due to out-of-the-money strikes.
Risk and Reward: - Maximum Profit: $0.07 per share - Maximum Loss: $2.00 - $0.07 = $1.93 per share - This ratio demonstrates potential for substantial profit should the stock remain above the critical $25.0 strike.
Long-Term Strategies:
Strategy 3: 2025-03-21 Expiry - Sell: 30.0 Put for a premium of $2.35 (Delta: -0.5083, Theta: -0.0066) - Buy: 28.0 Put for a premium of $0.75 (Delta: -0.2340, Theta: -0.0049)
Given the longer expiration, this Long-Term Strategy ensures a significantly higher premium received ($1.60), resulting in an attractive risk/reward profile. The Gamma and Delta suggest moderate vega exposure, with changes in underlying volatility affecting the positions marginally. The substantial Theta ensures that time decay plays favorably for the short position, conducive to profitability as long as the stock price stays above the sold 30.0 strike.
Risk and Reward: - Maximum Profit: $1.60 per share - Maximum Loss: $30.0 - $28.0 - Initial premium = $0.40 per share - The high net premium and elevated breakeven presents a compelling candidate for increased risk-adjusted returns.
Ultra-Long-Term Strategies:
Strategy 4: 2026-12-18 Expiry - Sell: 32.0 Put for a premium of $5.50 (Delta: -0.4810, Theta: -0.0026) - Buy: 27.0 Put for a premium of $3.10 (Delta: -0.3369, Theta: -0.0025)
For the ultra-long term, this strategy offers the highest initial premium difference ($2.4), maximizing cash flow while benefiting from time decay. The Delta values balance the insurance against significant drops in stock price, while the relatively high vega suggests some sensitivity to changes in volatility over the extensive period.
Risk and Reward: - Maximum Profit: $2.4 per share - Maximum Loss: $5.00 - $2.4 = $2.6 per share - Despite higher maximum loss, the substantial premium and extensive time frame present a strong case for significant premium capture and risk management.
Extremely Long-Term Strategies:
Strategy 5: 2026-06-18 Expiry - Sell: 30.0 Put for a premium of $4.15 (Delta: -0.4490, Theta: -0.0031) - Buy: 27.0 Put for a premium of $2.4 (Delta: -0.3379, Theta: -0.0031)
This spread provides a notable premium differential ($1.75), adept for capital gain while still managing the stock price risks through decayed premiums. The Delta strikes ensure reduced assignment risk and balanced exposure to fluctuations.
Risk and Reward: - Maximum Profit: $1.75 per share - Maximum Loss: $3.0 - $1.75 = $1.25 per share - With adjusted time-to-expiry, the premium achieved justifies potential risks held in speculative market fluctuations.
Summary
Selecting the optimal vertical bull put spread involves balancing premium received, delta-risk management, and expiry timelines. The medium to long-term horizons generally offer substantial premiums, conducive to enhanced profitability while keeping assignment risks manageable. Traders should cater these strategies to their risk appetite, market outlook, and capital rotation preferences, ensuring a well-rounded and profitable options portfolio.
Vertical Bear Call Spread Option Strategy
A vertical bear call spread is an options strategy designed to profit from a decline or stagnation in the underlying stock price. It involves selling a call option at a lower strike price and buying another call at a higher strike price. The income from the short call helps to offset the cost of the long call, thereby limiting the maximum loss and creating a positive net credit. Given the desire to minimize assignment risk while targeting a stock price movement of 2%, the following choices offer a balance of profitability and risk control.
Choice 1: Short Term (Expiration: 2024-09-27)
- Short Call: Strike 23.0, Delta 0.9838, Premium $7.00
- Long Call: Strike 24.0, Delta 0.9208, Premium $6.00
Analysis: The short call with a delta of 0.9838 is deep in the money, posing a high risk of assignment. However, it brings in a significant premium of $7.00. The long call at 24.0 offsets this at a cost of $6.00. The net credit of $1.00 provides a max profit potential of $100 per contract.
Risk/Reward: - Potential Profit: $100 (net credit) - Maximum Loss: $100 (difference in strike prices - net credit) - Risk Mitigation: High assignment risk, suggesting this as a very short-term strategy to capitalize on immediate price stability.
Choice 2: Near Term (Expiration: 2024-10-18)
- Short Call: Strike 28.0, Delta 0.7304, Premium $1.70
- Long Call: Strike 29.0, Delta 0.5942, Premium $0.93
Analysis: The short call with a delta of 0.7304 is near the money, reducing assignment risk. The long call at 29.0 has a lower delta but costs only $0.93. This setup provides a net credit of $0.77, offering a balanced approach.
Risk/Reward: - Potential Profit: $77 (net credit) - Maximum Loss: $23 (difference in strike prices - net credit) - Risk Mitigation: Moderate assignment risk, acceptable for near-term profit.
Choice 3: Medium Term (Expiration: 2024-11-15)
- Short Call: Strike 25.0, Delta 0.8501, Premium $4.66
- Long Call: Strike 26.0, Delta 0.7977, Premium $3.76
Analysis: The short call with a delta of 0.8501 carries assignment risk but provides a higher premium of $4.66. The long call at 26.0 with delta 0.7977 costs $3.76, resulting in a net credit of $0.90.
Risk/Reward: - Potential Profit: $90 (net credit) - Maximum Loss: $10 (difference in strike prices - net credit) - Risk Mitigation: Manageable assignment risk for medium term with attractive profit.
Choice 4: Long Term (Expiration: 2024-12-20)
- Short Call: Strike 27.0, Delta 0.7359, Premium $2.90
- Long Call: Strike 28.0, Delta 0.7359, Premium $3.76
Analysis: Both options are narrowly spaced with high delta values, reducing assignment risk due to moderate ITM positioning. This creates a net credit of $0.86.
Risk/Reward: - Potential Profit: $86 (net credit) - Maximum Loss: $114 (difference in strike prices - net credit) - Risk Mitigation: Balanced approach for a profitable long-term hold.
Choice 5: Extended Term (Expiration: 2025-01-17)
- Short Call: Strike 20.0, Delta 0.9140, Premium $9.47
- Long Call: Strike 21.0, Delta 0.8426, Premium $8.55
Analysis: The short call has a delta of 0.9140 and is deep ITM, presenting higher assignment risk but also a significant premium. The long call at 21.0 costs $8.55, resulting in a net credit of $0.92.
Risk/Reward: - Potential Profit: $92 (net credit) - Maximum Loss: $8 (difference in strike prices - net credit) - Risk Mitigation: High assignment risk due to deep ITM short call, suitable for an extended term where assignment risk is managed.
Conclusion
Each choice offers a balance of risk and reward tailored to different trading horizons. The primary consideration remains keeping the assignment risk manageable while capturing the maximum net credit. Strategy selection should align with the traders market outlook and risk tolerance, leveraging the Greeks to inform decision-making especially focusing on "Delta" for assignment risk and "Theta" for time decay management.
Vertical Bull Call Spread Option Strategy
A vertical bull call spread is an options strategy designed to capitalize on a moderately bullish outlook. This entails buying a call option at a lower strike price while selling another call option at a higher strike price, both expiring on the same date. This approach enables traders to profit from a stock's price increase while limiting the potential for loss. Given the target stock price of Pfizer Inc. (PFE) is expected to be around 2% over or under the current price, and considering the need to minimize the risk of assignment when an option is in the money, we'll carefully choose strike prices and expirations dates for our bull call spread strategies.
1. Near-Term Strategy (Expiring October 4, 2024)
Long Call: 28.0 / Short Call: 29.0
- Long Call (Strike 28.0, Expiry 2024-10-04):
- Delta: 0.6507677255
- Gamma: 0.0816544603
- Theta: -0.0424062409
- Vega: 2.4718185589
-
Premium: $1.61
-
Short Call (Strike 29.0, Expiry 2024-10-04):
- Delta: 0.6015925205
- Gamma: 0.2285740377
- Theta: -0.0159549101
- Vega: 2.5797248129
- Premium: $0.84
This near-term spread strategy involves buying the $28 call and selling the $29 call, both expiring on October 4, 2024. The total premium paid is $1.61 - $0.84 = $0.77. The maximum profit is $0.23 (the difference between the strikes minus the net premium paid), and the maximum loss is limited to the net premium paid, $0.77.
2. Short-Term Strategy (Expiring November 15, 2024)
Long Call: 26.0 / Short Call: 27.0
- Long Call (Strike 26.0, Expiry 2024-11-15):
- Delta: 0.7976871238
- Gamma: 0.0614660184
- Theta: -0.0049375930
- Vega: 3.9019205001
-
Premium: $3.76
-
Short Call (Strike 27.0, Expiry 2024-11-15):
- Delta: 0.7359294892
- Gamma: 0.0788078439
- Theta: -0.0056398562
- Vega: 4.5886171
- Premium: $2.90
For the short term, we buy the $26 call and sell the $27 call, both expiring on November 15, 2024. The net premium paid is $3.76 - $2.90 = $0.86. The maximum gain potential is $1.14 (difference between the strikes minus the net premium), with the maximum loss capped at the net premium, $0.86.
3. Intermediate-Term Strategy (Expiring January 17, 2025)
Long Call: 25.0 / Short Call: 26.0
- Long Call (Strike 25.0, Expiry 2025-01-17):
- Delta: 0.8266693252
- Gamma: 0.0472268966
- Theta: -0.0032894529
- Vega: 3.9475989631
-
Premium: $4.78
-
Short Call (Strike 26.0, Expiry 2025-01-17):
- Delta: 0.7857320995
- Gamma: 0.04551292
- Theta: -0.0025611952
- Vega: 5.482878329
- Premium: $4.00
For an intermediate-term strategy, we buy the $25 call and sell the $26 call, expiring on January 17, 2025. The net premium outlay is $4.78 - $4.00 = $0.78. The maximum profit here is $0.22 (strike difference minus the net premium), with the potential loss also limited to $0.78.
4. Mid-Term Strategy (Expiring June 20, 2025)
Long Call: 20.0 / Short Call: 21.0
- Long Call (Strike 20.0, Expiry 2025-06-20):
- Delta: 0.8199237709
- Gamma: 0.0167429844
- Theta: -0.0029179862
- Vega: 5.5269372743
-
Premium: $9.61
-
Short Call (Strike 21.0, Expiry 2025-06-20):
- Delta: 0.71802577
- Gamma: 0.0272088559
- Theta: -0.0001547773
- Vega: 10.0371746794
- Premium: $7.20
For a mid-term strategy, the $20 call is bought and the $21 call is sold, both expiring on June 20, 2025. The net premium paid is $9.61 - $7.20 = $2.41. Thus, the maximum profit is $0.59 (strike difference minus net premium), and the maximum loss stands at $2.41.
5. Long-Term Strategy (Expiring December 18, 2026)
Long Call: 20.0 / Short Call: 22.0
- Long Call (Strike 20.0, Expiry 2026-12-18):
- Delta: 0.7453910152
- Gamma: 0.0168366123
- Theta: 0.000493322
- Vega: 9.150407998
-
Premium: $9.75
-
Short Call (Strike 22.0, Expiry 2026-12-18):
- Delta: 0.6632594775
- Gamma: 0.0220851764
- Theta: -0.0003818962
- Vega: 12.2118325009
- Premium: $6.2
For the long term, buying the $20 call and selling the $22 call with an expiration of December 18, 2026, results in a net premium of $9.75 - $6.20 = $3.55. The maximum profit potential is $0.45, and the maximum loss is slightly higher due to the longer timeframe, standing at $3.55.
In evaluating these strategies, the long-term spread carries a higher capital requirement but offers more time for the stock to appreciate, reducing the risk of early assignment. The near-term and short-term strategies offer quicker returns with moderate risk, ideal for those looking to capitalize on short-term fluctuations. The intermediate and mid-term strategies strike a balance between risk and timeline, offering a more substantial buffer against market volatility while ensuring exposure to potential stock appreciation.
Spread Option Strategy
Analysis of Calendar Spread Options Strategy for Pfizer Inc. (PFE)
To formulate the most profitable calendar spread options strategy while minimizing assignment risk, we will analyze both long call options and short put options. The goal is to buy a call option and sell a put option to exploit differences in time decay and volatility.
Strategy Considerations
- Assignment Risk: We aim to minimize the risk of being assigned shares by selecting options with lower deltas (close to zero for puts) and higher time decay (theta) to capitalize on the time value decay.
- Profitability: The profitability of the positions is assessed based on the Return on Investment (ROI) and the premium received/cost paid for the options.
- Liquidity and Volatility: Higher gamma and vega values will highlight the rapid changes in delta and sensitivity to volatility, which can affect our strategy as the market moves.
Near Term Choices
Choice 1: Near Expiration
- Long Call: Strike $27.5, Expiration 2024-09-27
- Delta: 0.8638, Gamma: 0.1176, Vega: 0.7490, Theta: -0.0386
- Premium: $1.94, ROI: 0.2930, Profit: $0.5684
- Short Put: Strike $28.5, Expiration 2024-09-27
- Delta: -0.0988, Gamma: 0.2394, Vega: 0.5987, Theta: -0.0128
- Premium: $0.05, ROI: 100.0%, Profit: $0.05
This combination exploits the near-term time decay advantage, with high theta values for both positions enhancing profitability. The low delta for the put minimizes assignment risk.
Medium Term Choices
Choice 2: Short to Medium Term
- Long Call: Strike $28.0, Expiration 2024-10-04
- Delta: 0.8152, Gamma: 0.1614, Vega: 1.4128, Theta: -0.0166
- Premium: $1.49, ROI: 0.3479, Profit: $0.5184
- Short Put: Strike $27.0, Expiration 2024-10-04
- Delta: -0.0537, Gamma: 0.0689, Vega: 0.5817, Theta: -0.0073
- Premium: $0.04, ROI: 100.0%, Profit: $0.04
The medium-term choice allows more time for stock movement while retaining favorable Greeks and profit potential. The put option maintains low delta to minimize assignment risk.
Mid Term Choice
Choice 3: Mid Term
- Long Call: Strike $25.0, Expiration 2024-11-15
- Delta: 0.9468, Gamma: 0.0115, Vega: 1.0665, Theta: -0.0046
- Premium: $10.9, ROI: 0.0099, Profit: $0.1084
- Short Put: Strike $26.0, Expiration 2024-11-15
- Delta: -0.1323, Gamma: 0.0634, Vega: 2.4167, Theta: -0.0068
- Premium: $0.23, ROI: 100.0%, Profit: $0.23
This choice benefits from a slightly longer time horizon, balancing between low assignment risk and reasonable premium collected.
Long Term Choices
Choice 4: Long Term
- Long Call: Strike $25.0, Expiration 2024-12-20
- Delta: 0.8455, Gamma: 0.0367, Vega: 3.2300, Theta: -0.0056
- Premium: $5.8, ROI: 0.0359, Profit: $0.2084
- Short Put: Strike $29.0, Expiration 2024-12-20
- Delta: -0.4387, Gamma: 0.1053, Vega: 5.6607, Theta: -0.0087
- Premium: $1.2, ROI: 86.0%, Profit: $1.0316
Though further down the timeline, this combination has high gamma and vega, beneficial for leveraging price movement and unlikely assignment in the short run.
Very Long Term Choices
Choice 5: Very Long Term
- Long Call: Strike $30.0, Expiration 2025-06-20
- Delta: 0.4489, Gamma: 0.0362, Vega: 14.0072, Theta: -0.0031
- Premium: $4.15, ROI: 71.8%, Profit: $2.9816
- Short Put: Strike $35.0, Expiration 2025-06-20
- Delta: -0.5706, Gamma: 0.0291, Vega: 14.3706, Theta: -0.0023
- Premium: $7.85, ROI: 21.4%, Profit: $1.6816
This combination positions for long-term appreciation. The longer timeline dampens assignment risk per delta, supporting premium collection.
Conclusion
The chosen strategies span various expiration dates and strike prices to align with near to long-term trading horizons. Each combination considers assignment risk, profit potential, and strategic use of the Greeks to maximize returns:
- Near Term: Strike $27.5/$28.5 expiring 2024-09-27
- Short to Medium Term: Strike $28.0/$27.0 expiring 2024-10-04
- Mid Term: Strike $25.0/$26.0 expiring 2024-11-15
- Long Term: Strike $25.0/$29.0 expiring 2024-12-20
- Very Long Term: Strike $30.0/$35.0 expiring 2025-06-20
These choices balance premium collection with risk management, leveraging the Greeks for optimal performance.
Calendar Spread Option Strategy #1
Calendar Spread Options Strategy for Pfizer Inc. (PFE)
Given the data provided for long put options and short call options for Pfizer Inc. (PFE), the objective is to identify the most profitable calendar spread options strategy while minimizing the risk of assignment from the short leg of the trade. The analysis will be based on five choice combinations of expiration dates and strike prices, ranging from near term to long term.
1. Near-Term Option Combination: (Expire: 2024-09-27)
Long Put Option: - Strike Price: 38.0 - Expiration Date: 2024-09-27 - Greeks: Delta: -0.9085, Gamma: 0.0309, Vega: 0.5623, Theta: -0.0869, Rho: -0.0049 - Premium: $7.9 - Profit: $0.0916
Short Call Option: - Strike Price: 20.0 - Expiration Date: 2024-09-27 - Greeks: Delta: 0.9233, Gamma: 0.0161, Vega: 0.4920, Theta: -0.1240, Rho: 0.0024 - Premium: $9.15 - Profit: $0.3184
Analysis: The near-term option combination pairs a high delta long put with a high delta short call that expires soon. Although the short call is deep in the money and risks assignment, the short duration minimizes this exposure. Profit potential is moderate with a combined premium income, but the main risk is assignment.
2. Short-Term Option Combination: (Expire: 2025-01-17)
Long Put Option: - Strike Price: 62.5 - Expiration Date: 2025-01-17 - Greeks: Delta: -0.9819, Gamma: 0.0, Vega: 0.0, Theta: 0.0018, Rho: -0.1980 - Premium: $20.7 - Profit: $11.7916
Short Call Option: - Strike Price: 38.0 - Expiration Date: 2024-10-04 - Greeks: Delta: 0.0327, Gamma: 0.0151, Vega: 1.2137, Theta: -0.0014, Rho: 0.0029 - Premium: $0.06 - Profit: $0.06
Analysis: This combination leverages a deep in-the-money long put and a deep out-of-the-money short call, reducing the risk of assignment. The longer duration to expiration for the long put captures significant movement in stock price, while the short call's minimal delta ensures lower risk but lower premium.
3. Medium-Term Option Combination: (Expire: 2025-06-20)
Long Put Option: - Strike Price: 42.0 - Expiration Date: 2025-06-20 - Greeks: Delta: -0.0458, Gamma: 0.0098, Vega: 14.7, Theta: -0.0026, Rho: -0.0041 - Premium: $1.16 - Profit: $0.98
Short Call Option: - Strike Price: 37.0 - Expiration Date: 2024-09-27 - Greeks: Delta: 0.0406, Gamma: 0.0303, Vega: 1.51, Theta: -0.0021, Rho: 0.0044 - Premium: $0.04 - Profit: $0.03
Analysis: This medium-term combination uses an at-the-money long put to capture premium movements and an out-of-the-money short call to reduce risk. The choice of strike price provides a balanced risk profile with moderate premium income and reduced assignment risk.
4. Long-Term Option Combination: (Expire: 2026-12-18)
Long Put Option: - Strike Price: 33.0 - Expiration Date: 2026-12-18 - Greeks: Delta: -0.3482, Gamma: 0.0924, Vega: 2.27, Theta: -0.0017, Rho: -0.0027 - Premium: $2.54 - Profit: $1.93
Short Call Option: - Strike Price: 20.0 - Expiration Date: 2024-09-27 - Greeks: Delta: 0.0156, Gamma: 0.0135, Vega: 0.7615, Theta: -0.0007, Rho: 0.0038 - Premium: $0.01 - Profit: $0.01
Analysis: This long-term combination pairs a low delta long put with another low delta short call to minimize assignment risk over a longer duration. The income from premiums in this combination is lower, but it leverages substantial price movements over time for profit.
5. Very Long-Term Option Combination: (Expire: 2027-12-18)
Long Put Option: - Strike Price: 20.0 - Expiration Date: 2027-12-18 - Greeks: Delta: -0.8642, Gamma: 0.0174, Vega: 0.8517, Theta: -0.0011, Rho: -0.0285 - Premium: $0.8642 - Profit: $5.71
Short Call Option: - Strike Price: 40.0 - Expiration Date: 2024-10-25 - Greeks: Delta: 0.1129, Gamma: 0.0473, Vega: 1.69, Theta: -0.0115, Rho: 0.0028 - Premium: $0.04 - Profit: $0.04
Analysis: The very long-term option combination leverages a deep in-the-money long put with low delta, reducing the risk from assignment. The pairing with an extremely low delta short call minimizes risk further. Long-term horizon captures significant premium income while controlling assignment risk.
Conclusion
The most profitable and viable calendar spread options strategy favors combinations that balance the opposing risks of high premium income and assignment. The mid-term option expiration dates provide an ideal balance of risk and return, favoring lower risk and moderate premium income over outright profitability from deep expiration options with substantial assignment risks.
Calendar Spread Option Strategy #2
Given the extensive data provided for both long put options and short call options on Pfizer Inc. (PFE), we can analyze and construct a calendar spread strategy to identify the most profitable combinations that minimize the risk of having shares assigned. The objective is to sell a put option at one expiration date and buy a call option at a different expiration date within a calendar spread, while targeting a stock price that is 2% over or under the current stock price.
Strategy Analysis
1. Near-Term Strategy: Short Call: 2024-09-27, Strike 40.0, Delta 0.0179126862 - Premium: 0.01, Profit: 0.01, ROI: 100.0 - Greeks: Low delta indicates a low probability of the option being exercised, minimizing the risk of assignment. - Risk: Minimal, due to an in-the-money low delta and short expiration. Max loss is the premium collected if the price significantly diverges.
Long Put: 2024-09-27, Strike 38.0, Delta -0.9085080822 - Premium: 7.9, Profit: 0.0916, ROI: 0.0115949367 - Greeks: High Delta and Gamma indicate significant potential price movement sensitivity. - Reward: Limited to the premium received.
This combination offers a balance where the sold call is unlikely to be in-the-money, thus minimizing assignment risk, while also providing protection with a put option close to the current price.
2. Mid-Term Strategy: Short Call: 2024-12-20, Strike 36, Delta 0.0912527131 - Premium: 0.06, Profit: 0.06, ROI: 100.0 - Greeks: Moderate delta indicates a moderate chance of the option being exercised. - Risk: Moderate risk of the call option being in-the-money by expiration.
Long Put: 2025-01-17, Strike 62.5, Delta -0.9818632002 - Premium: 20.7, Profit: 11.7916, ROI: 0.5696425121 - Greeks: Extremely high delta implies a significant bearish bias and high price movement sensitivity. - Reward: Substantial due to the high negative delta of the put.
The combination aims for significant protection via a strong bearish stand, suitable if the stock exhibits bearish signals.
3. Long-Term Strategy: Short Call: 2024-11-15, Strike 32, Delta 0.1926577029 - Premium: 0.29, Profit: 0.29, ROI: 100.0 - Greeks: Delta reflects a higher probability of the option being in-the-money. - Risk: Increased risk of the call being exercised.
Long Put: 2026-06-18, Strike 35, Delta 0.1934618256 - Premium: 1.33, Profit: 1.33, ROI: 100.0 - Greeks: Provides a bearish hedge until 2026, high vega implies sensitivity to volatility shifts. - Reward: Provides a long-term hedge with substantial protection against prolonged bearish trends.
This strategy marries longer-term protection with decent premium collection from the short call.
4. Extended-Term Strategy: Short Call: 2025-03-21, Strike 30, Delta 0.3785774083 - Premium: 1.29, Profit: 1.29, ROI: 100.0 - Greeks: Delta indicates a substantial probability of being in-the-money, posing significant assignment risk. - Risk: High risk of the option being exercised, especially if the stock appreciates.
Long Put: 2025-06-20, Strike 37, Delta 0.1414449773 - Premium: 0.43, Profit: 0.43, ROI: 100.0 - Greeks: This long-term put option provides essential protection and a positive theta (time decay benefit) profile. - Reward: Tailored to offset risk from the short call with progressive downside protection over time.
This combination is ideal for protecting against medium-term downward trends while remaining cautious to the assignment risk from the short call.
5. Very Long-Term Strategy: Short Call: 2026-06-18, Strike 45, Delta 0.1022024987 - Premium: 0.48, Profit: 0.48, ROI: 100.0 - Greeks: Lower delta reduces the risk levels somewhat. - Risk: Lower assignment risk due to long-dated expiry, allowing flexibility in management.
Long Put: 2026-12-18, Strike 37, Delta 0.2610003646 - Premium: 1.74, Profit: 1.74, ROI: 100.0 - Greeks: Provides substantive protection until 2026 while maintaining decent time decay. - Reward: Balanced protection combined with long-term risk hedging.
This strategy caters to investors seeking considerable downside protection with minimized assignment risk.
Conclusion
Each of these strategies leverages both the Greeks and target pricing to ensure an optimized balance of risk and reward. For novice option traders, starting with near-term protective strategies is prudent, while sophisticated traders can employ more extended-term strategies to significantly hedge risks while reaping potential rewards.
Similar Companies in Drug Manufacturers - General:
AbbVie Inc. (ABBV), Merck & Co., Inc. (MRK), Eli Lilly and Company (LLY), Bristol-Myers Squibb Company (BMY), Johnson & Johnson (JNJ), Amgen Inc. (AMGN), Gilead Sciences, Inc. (GILD), Regeneron Pharmaceuticals, Inc. (REGN), Biogen Inc. (BIIB), Vertex Pharmaceuticals Incorporated (VRTX)
https://www.fool.com/investing/2024/09/13/bull-market-here-2-high-potential-stocks-to-buy/
https://www.fool.com/investing/2024/09/13/got-5000-3-dirt-cheap-stocks-to-buy-right-now/
https://www.fool.com/investing/2024/09/15/is-pfizers-57-dividend-yield-worth-the-risk/
https://www.fool.com/investing/2024/09/16/is-pfizer-stock-going-to-36-1-wall-street-analyst/
https://www.fool.com/investing/2024/09/18/3-magnificent-dividend-stocks-with-yields-above-5/
https://finance.yahoo.com/news/jim-cramer-pfizer-inc-pfe-080552840.html
https://finance.yahoo.com/news/pfizer-biontech-receive-positive-chmp-121100781.html
https://finance.yahoo.com/news/pfizer-biontech-apos-kp-2-130711862.html
https://finance.yahoo.com/news/pfizer-nyse-pfe-using-too-140029891.html
https://finance.yahoo.com/news/pfizer-advances-cancer-journey-144828266.html
https://finance.yahoo.com/news/heres-why-pfizer-pfe-fell-214521830.html
https://www.fool.com/investing/2024/09/21/3-dirt-cheap-stocks-to-buy-right-now/
https://www.sec.gov/Archives/edgar/data/78003/000007800324000166/pfe-20240630.htm
Copyright © 2024 Tiny Computers (email@tinycomputers.io)
Report ID: YzEdTY
Cost: $0.73701
https://reports.tinycomputers.io/PFE/PFE-2024-09-21.html Home