Palantir Technologies Inc. (ticker: PLTR)
2024-05-19
 Palantir Technologies Inc. (ticker: PLTR) is a prominent American software company that specializes in big data analytics. Founded in 2003 by Peter Thiel, Nathan Gettings, Joe Lonsdale, Stephen Cohen, and Alex Karp, Palantir initially focused on designing software solutions for government agencies in the realms of defense and intelligence, which remain key markets. The company's core products, Palantir Gotham and Palantir Foundry, enable organizations to integrate, manage, and analyze vast amounts of data to drive informed decision-making and uncover critical insights. Palantir Gotham is tailored primarily for governmental intelligence workflows, including counter-terrorism and military operations, while Foundry is designed for commercial enterprises and offers a robust platform for a variety of industries such as healthcare, finance, and manufacturing. Listed on the New York Stock Exchange (NYSE) under the ticker symbol PLTR, Palantir completed its direct public offering (DPO) in September 2020. Despite some controversies over privacy concerns and its role in government surveillance, Palantir has established itself as a vital player in the rapidly expanding field of data analytics and continues to grow its presence both in the public and private sectors.
| Full-Time Employees | 3,678 | Previous Close | 21.65 | Open | 21.78 |
| Day Low | 21.56 | Day High | 22.1693 | Regular Market Previous Close | 21.65 |
| Regular Market Open | 21.78 | Regular Market Day Low | 21.56 | Regular Market Day High | 22.1693 |
| Beta | 2.754 | Trailing PE | 181.33334 | Forward PE | 55.794876 |
| Volume | 30,032,254 | Regular Market Volume | 30,032,254 | Average Volume | 53,036,603 |
| Average Volume (10 days) | 71,060,930 | Bid | 21.75 | Ask | 21.77 |
| Bid Size | 1,300 | Ask Size | 1,800 | Market Cap | 48,457,342,976 |
| 52 Week Low | 11.39 | 52 Week High | 27.5 | Price to Sales Trailing 12 Months | 20.760042 |
| 50 Day Average | 22.7944 | 200 Day Average | 19.12385 | Enterprise Value | 44,892,381,184 |
| Profit Margins | 0.12791 | Float Shares | 1,927,222,985 | Shares Outstanding | 2,130,339,968 |
| Shares Short | 78,695,395 | Shares Short (Prior Month) | 82,366,928 | Short Ratio | 2.28 |
| Short % of Float | 0.0397 | Implied Shares Outstanding | 2,226,899,968 | Book Value | 1.695 |
| Price to Book | 12.837758 | Last Fiscal Year End | 1703980800 | Next Fiscal Year End | 1735603200 |
| Most Recent Quarter | 1711843200 | Earnings Quarterly Growth | 5.281 | Net Income to Common | 298,552,992 |
| Trailing EPS | 0.12 | Forward EPS | 0.39 | PEG Ratio | 0.77 |
| Enterprise to Revenue | 19.233 | Enterprise to EBITDA | 195.011 | 52 Week Change | 0.8378378 |
| S&P 52 Week Change | 0.26490295 | Current Price | 21.76 | Target High Price | 35.0 |
| Target Low Price | 9.0 | Target Mean Price | 21.45 | Target Median Price | 23.5 |
| Recommendation Mean | 3.0 | Number of Analyst Opinions | 16 | Total Cash | 3,867,899,904 |
| Total Cash Per Share | 1.737 | EBITDA | 230,204,000 | Total Debt | 217,068,992 |
| Quick Ratio | 5.802 | Current Ratio | 5.91 | Total Revenue | 2,334,163,968 |
| Debt to Equity | 5.622 | Revenue Per Share | 1.074 | Return on Assets | 0.028959999 |
| Return on Equity | 0.09132 | Free Cashflow | 559,675,776 | Operating Cashflow | 654,385,984 |
| Earnings Growth | 4.018 | Revenue Growth | 0.208 | Gross Margins | 0.81162 |
| EBITDA Margins | 0.098620005 | Operating Margins | 0.1275 | Trailing PEG Ratio | 1.6651 |
| Sharpe Ratio | 1.1676125379873052 | Sortino Ratio | 22.047824167131292 |
| Treynor Ratio | 0.2638615754265729 | Calmar Ratio | 2.821318179884901 |
Investment analytics for Palantir Technologies Inc. (PLTR) provide a very nuanced view of both performance and risk associated with the stock. From a fundamental perspective, PLTR shows substantial strengths. Gross margins are 81.16%, which indicates efficient management and a significant buffer against variable costs. The operating margin, although lower at 12.75%, also reflects operational efficiency.
On the financial side, Palantir's revenue for the last financial year was $2.23 billion, with EBITDA standing at $273.92 million. Net income was recorded at $209.83 million. This positive net income highlights a commendable financial turnaround from previous negative figures. The company's total debt is $229.39 million against total assets of $4.81 billion, showing a conservative leverage profile.
The technical indicators demonstrate an interesting pattern over the past several trading days. The MACD histogram shows a trend towards lesser negative values, suggesting a weakening of downward momentum and potential entry into bullish territory. OBV (On-Balance Volume), currently at 43.85 million, also indicates strong trading interest which often precedes a price uptick.
Examining risk-adjusted performance metrics offers additional insights. The Sharpe Ratio of 1.17, while solid, indicates modest risk-adjusted returns over the past year compared to risk-free assets. The Sortino Ratio is significantly higher at 22.05, showing that the negative volatility is very low, and the returns are predominantly above the target or required returns. The Treynor Ratio of 0.26 suggests that PLTRs portfolio returns are higher relative to its systematic risk. Finally, the Calmar Ratio of 2.82 reflects a robust return profile against maximum drawdowns, which is particularly valuable information for investors looking for long-term stability.
In summary, PLTR's above-average risk-adjusted return metrics combined with a solid financial foundation paint a favorable picture for the stock's outlook over the next few months. Technical indicators further support potential upward movements, despite some recent pullbacks. Investors should keep a close watch on macroeconomic conditions and broader market trends, but current data strongly suggest that PLTR is well-positioned to deliver continued returns.
In evaluating Palantir Technologies Inc. (PLTR) using the principles outlined in "The Little Book That Still Beats the Market," we find that the company exhibits a return on capital (ROC) of approximately 3.18%. This metric indicates the efficiency with which Palantir is utilizing its capital to generate profits; however, a ROC of 3.18% suggests that there might be better opportunities for capital efficiency in the market. On the other hand, Palantir's earnings yield stands at 0.449, or 44.90%, which is derived from the companys earnings relative to its price. This is a notably high earnings yield, implying that the stock is priced attractively relative to its earnings. In essence, while Palantir's capital efficiency may appear modest, its high earnings yield could make it an appealing option for investors seeking strong returns relative to the investment price. Careful consideration should be given to these metrics in the broader context of Palantir's overall financial health and market conditions.
| Alpha | 0.015 |
| Beta | 1.20 |
| R-Squared | 0.75 |
| T-Statistic | 2.5 |
The linear regression model examining the relationship between PLTR and SPY reveals notable insights. The alpha value of 0.015 indicates that PLTR has a positive, albeit small, expected return independent of its relationship with the overall market (SPY). This suggests that, holding all other variables constant, PLTR might generate a slight excess return above what would be predicted by the market alone. The beta value of 1.20 signifies that PLTR is relatively more volatile than the market; for every 1% change in SPY, PLTR is expected to change by 1.20%. This higher level of sensitivity to market movements means that PLTR could potentially offer higher returns when the market is performing well, but also carry higher risk during downturns.
The R-squared value of 0.75 demonstrates that 75% of the variability in PLTR's returns can be explained by the changes in SPY. This strong level of correlation suggests that the market performance is a significant predictor of PLTRs performance. Additionally, the T-statistic of 2.5 indicates that the relationship between PLTR and SPY is statistically significant at conventional levels, providing confidence in the reliability of the model's estimates. Overall, the figures affirm that while PLTR moves closely with broader market trends, it also has a positive expected return independent of the market movements.
For the first quarter of 2024, Palantir Technologies Inc. (PLTR) reported robust earnings, reflecting their success in leveraging their Artificial Intelligence Platform (AIP) to drive notable growth across their US commercial and government sectors. The company's revenue reached $634 million, up 21% year-over-year, with significant contributions stemming from their US commercial business, where customer count surged by 69% year-over-year. Notably, Palantir saw considerable engagement through their bootcamp initiatives, accelerating deal cycles and boosting customer acquisition significantly.
The US commercial sector demonstrated remarkable expansion, adding 41 net new customers and showcasing an impressive revenue increase of 68% year-over-year and 22% quarter-over-quarter. This growth was supported by a diverse array of industries, from manufacturing to health services, with prominent examples such as Lowe's and General Mills significantly expanding their use of Palantir's AIP. The company's strategy emphasizes landing and expanding customer engagements, with a focus on transformative applications of artificial intelligence that move beyond traditional uses such as chat.
Palantirs government segment also showed positive momentum, with revenue expanding by 8% quarter-over-quarter. Key highlights included substantial contracts such as the $178 million awarded by the US Army under the TITAN program, marking a milestone as Palantir became the first software company to win a prime contract for a hardware system. The company's international government business continued its critical projects, including the delivery of the UK NHS Federated Data Platform and defense capabilities for allied partners globally.
Financially, Palantir maintained strong profitability, marking its sixth consecutive quarter of GAAP net income, reaching a record $106 million, and its fifth consecutive quarter of GAAP operating profit. The results underscore the company's strong unit economics and effective cost management. Palantirs adjusted operating margins expanded to 36%, and their Rule of 40 score improved to 57%, indicating a balanced approach to revenue growth and operating efficiency. Furthermore, guided by exceptional performances in their US commercial and government sectors, Palantir has raised its full-year revenue guidance, demonstrating confidence in continued strong performance and strategic execution.
On April 30, 2024, Palantir Technologies Inc. filed their SEC 10-Q for the quarter ending March 31, 2024. Palantir reported revenue of $634.3 million for Q1 2024, representing a notable 21% year-over-year increase from the $525.2 million reported in Q1 2023. This revenue growth was driven by both government and commercial segments, with government revenue rising 16% to $335.4 million and commercial revenue jumping 27% to $299.0 million.
The company's operating income also saw substantial growth, increasing from $4.1 million in Q1 2023 to $80.9 million in Q1 2024. Adjusted income from operations, which excludes stock-based compensation and related employer payroll taxes, was $226.5 million for the first quarter of 2024 compared to $125.1 million in the same quarter of the previous year. This improvement translated to better overall profitability, with Palantir achieving a gross margin increase from 80% to 82%.
Operating expenses overall saw a modest increase of 6%, reaching $437.2 million in Q1 2024 compared to $413.4 million in Q1 2023. Notably, research and development expenditures rose by 22%, driven by increased investments in personnel and third-party cloud hosting services. Sales and marketing expenses saw a smaller increment of 3%, reflecting rising costs of stock-based compensation and variable compensations due to a decrease in headcount. General and administrative expenses slightly decreased by 2%, primarily due to decreases in professional services and headcount-related costs.
Palantir's liquidity position remains strong, with cash, cash equivalents, and short-term U.S. treasury securities totaling approximately $3.9 billion as of March 31, 2024. The company's net cash provided by operating activities was $129.6 million for Q1 2024, a decrease from $187.4 million in Q1 2023. However, this decrease in operating cash flow was mainly attributed to the timing variations in payment to vendors and recognition of customer payments.
Interest income has grown significantly, buoyed by higher U.S. interest rates and increased interest-bearing investments, contributing $43.4 million for Q1 2024 compared to $20.9 million in Q1 2023. Conversely, other income (expense) experienced a decrease, largely due to realized and unrealized losses from equity securities, ending Q1 2024 at $(13.5) million compared to $(4.1) million in Q1 2023.
This 10-Q filing underscores Palantir's resilient performance and strategic investments in research and market expansion. The company's adaptive operational approach, characterized by strategic cost management and targeting high-value customer contracts, has successfully driven both top-line and bottom-line growth in a challenging macroeconomic environment. With strong liquidity and proactive market participation, including stock repurchase programs, Palantir continues to solidify its market position in both the commercial and government sectors.
Palantir Technologies Inc. has created a significant niche for itself in artificial intelligence (AI) by focusing on bespoke solutions tailored primarily for U.S. government agencies and their allies. Over two decades, Palantir has built its expertise in AI applications, uniquely positioning itself in the market to provide advanced, customized AI solutions rapidly. This capability allows companies to implement AI-powered tools that enhance efficiency, streamline processes, and ultimately boost profitability.
One of Palantir's most notable offerings is its Artificial Intelligence Platform (AIP), which dramatically accelerates the development of high-value, mission-critical AI use cases. To facilitate this, Palantir hosts immersive boot camps, enabling businesses to work directly with Palantir engineers to deploy AI technologies swiftly. The effectiveness of this approach is evident in the company's growing backlog of boot camps and the high demand for these sessions. For example, one leading utility company signed a seven-figure deal within five days of completing the boot camp. This highlights the high impact and immediate payoff of Palantir's hands-on deployment strategy (The Motley Fool, May 15, 2024).
Generative AI, a promising aspect of Palantir's portfolio, automates time-consuming tasks, allowing businesses to focus on more critical activities. This includes summarizing emails, drafting responses, creating presentations from company data, and generating complex spreadsheet charts with minimal input. These tools are designed to assist rather than replace human workers, emphasizing their role in saving time and reducing costs.
Despite seasonal dips in growth, Palantir's U.S. commercial revenue grew 40% year-over-year, and the number of U.S. commercial customers increased by 69%. The company anticipates at least 45% growth in this segment for the full year, up from its earlier projection of 40%. The unique ability of Palantir to customize AI solutions for specific business needs, combined with its strong market position and innovative approach, makes its stock a compelling consideration for investors.
CEO Alex Karp's commentary on May 15, 2024, shed light on significant implications for the company's operations and its stock investors (The Motley Fool, May 15, 2024). Karp's intrinsic boldness and strategic pivot toward scaling up AI capabilities resonate with Palantirs aggressive market strategies. The escalating demand for Palantir's AI-driven solutions aligns with the global tilt towards AI integration across industries. This demand surge underscores Palantir's role in leveraging AI for intricate data analytics tasks, potentially fortifying its market position and revenue growth.
Investors' reactions to Karp's statements are pivotal in understanding the company's stock performance. Despite heightened anticipation around Palantir's AI innovations, the stock observed a slight dip, reflecting the nuanced market sentiment arising from high investor expectations and inherent volatility within tech stocks. This paradox of growing demand yet a dropping stock price illustrates the complex landscape Palantir navigates, balancing robust technological advancements with market perceptions and financial metrics.
In the first quarter ending March 31, 2024, Palantir's revenue amounted to $634 million, surpassing analyst expectations of $625 million. The company's forward price/earnings-to-growth (PEG) ratio is less than 1, indicating that the stock might be undervalued considering its growth potential. The guidance for the full fiscal year with anticipated revenue between $2.68 billion and $2.69 billion fell short of the expected $2.71 billion, spurring investor concerns regarding sustained demand for its AI platform, despite momentum (The Motley Fool, May 15, 2024).
Financially, Palantir has made strides in enhancing its revenue streams, reporting consistent year-over-year growth and gradual improvement in profit margins. As noted in a Seeking Alpha analysis, Palantir's financial health presents a promising trajectory (Seeking Alpha, April 21, 2023). By focusing on long-term contracts that ensure recurrent revenue, Palantir mitigates risks associated with high valuations, supported by governmental and commercial contracts.
Palantirs U.S. commercial revenue grew by 40% year-over-year, significantly outpacing the 12% growth in U.S. government revenue. This success underscores the effectiveness of its strategy to engage clients through practical, hands-on experiences via boot camps, which has driven substantial increases in commercial deals (The Motley Fool, May 16, 2024). This approach also serves as a feedback mechanism, allowing Palantir to continuously refine its offerings based on user experiences and requirements, promoting innovation and ensuring the company remains at the forefront of the data analytics industry.
Despite the successes, Palantir's stock faced a 15% decline following its Q1 2024 earnings announcement, attributed to market's high expectations (The Motley Fool, May 16, 2024). The forward P/E ratio of about 63 remains pricy, indicating market skepticism. Nevertheless, the potential for substantial earnings growth driven by new AIP initiatives and expanding client base cannot be ignored.
Recent analyses indicate that fears surrounding Palantir may have peaked, signaling a possible turning point for investors (Seeking Alpha, April 17, 2023). Strategic initiatives like diversifying the client base and expanding into new verticals have been promising. Palantir's tactical moves mitigate risks of over-reliance on government contracts while opening new revenue streams.
Palantir's valuation remains challenging, standing at over 60 times its anticipated future earnings, with a price-to-sales ratio exceeding 20. Such high valuations place enormous pressure on the company to consistently exceed expectations, which can be precarious (The Motley Fool, May 16, 2024). Investors need to weigh the company's significant growth potential against its high valuation and market volatility.
Palantirs strategic initiatives and consistent delivery of innovative solutions underscore its potential for sustained growth. However, concerns about expense increases and high valuation linger. The companys guidance for anticipated operating income ranging between $868 million and $880 million and the projection of free cash flow around $900 million reflect confidence in their model (Yahoo Finance, May 17, 2024).
Palantir's significant customer growth and successful implementation of AI across diverse sectors, coupled with a robust cash reserve used for share repurchases, signal strategic financial management (Yahoo Finance, May 17, 2024).
However, the competitive landscape remains intense as companies like Zscaler and The Trade Desk show significant growth potential, posing challenges to Palantir. Investors need to monitor these dynamics closely to make informed decisions. Despite the stock's high valuation and volatility, Palantirs growth prospects and strategic maneuvers underscore a potential upside for patient investors. For more information, see The Motley Fool, May 18, 2024.
Palantir Technologies Inc. (PLTR) experienced significant volatility from late 2020 to mid-2024. The ARCH model reveals that the company's asset returns have a high degree of unpredictability. Key features of this volatility include statistically significant coefficients for baseline volatility and lagged volatility terms.
| R-squared | 0.000 |
| Adj. R-squared | 0.001 |
| Log-Likelihood | -2,681.10 |
| AIC | 5,366.19 |
| BIC | 5,375.83 |
| No. Observations | 913 |
| omega | 18.0562 |
| alpha[1] | 0.1730 |
Analysis of Financial Risk for a $10,000 Investment in Palantir Technologies Inc. (PLTR)
Understanding Volatility with Volatility Modeling
To assess the financial risk associated with an investment in Palantir Technologies Inc. (PLTR), we utilize volatility modeling to gauge the stock's volatility over a one-year period. By applying this advanced statistical technique, we can analyze historical price fluctuations and predict future volatility. Volatility modeling provides insights into the expected range of price movements, enabling us to understand potential risks better.
In this context, historical price data of PLTR is collected and used to estimate the volatility of the stock. Volatility modeling decomposes this historical data to ascertain the level of variance in returns, which is crucial for understanding the potential for sudden and significant changes in the stocks price. This step is foundational for determining the extent of the risk associated with high volatility.
Predicting Future Returns with Machine Learning Predictions
While volatility modeling helps elucidate the degree of variability in PLTR's stock price, machine learning predictions offer a sophisticated approach to forecast future returns. Machine learning techniques, like decision tree-based algorithms, are employed to analyze both historical stock data and a variety of financial indicators. By training the model on historical data, it identifies patterns and relationships that may not be immediately evident.
The machine learning predictions play a pivotal role in estimating future returns by considering numerous factors, including market trends, economic indicators, and historical performance. This predictive power adds a valuable dimension to our risk analysis, allowing us to anticipate possible future price movements more accurately.
Value at Risk (VaR) Calculation
By integrating the insights from volatility modeling and machine learning predictions, we are able to calculate the Value at Risk (VaR) for the investment. VaR quantifies the maximum potential loss on an investment over a specified period, given a certain confidence level. Here, we compute the VaR at a 95% confidence interval to measure the potential financial risk over one year.
For a $10,000 investment in PLTR, the VaR at a 95% confidence level is calculated to be $668.70. This means that there is a 5% probability that the investment will incur a loss exceeding $668.70 over the course of a year.
This comprehensive risk analysis, which combines volatility modeling with machine learning predictions, provides a robust assessment of the potential risks associated with investing in Palantir Technologies Inc. By understanding both the volatility and predictive elements, investors can make more informed decisions regarding their equity investments.
Long Call Option Strategy
When evaluating long call options for Palantir Technologies Inc. (PLTR) with a target stock price of 2% over the current price, we will analyze the most profitable options in terms of "the Greeks" and their potential profit and loss scenarios. Here, we consider Delta, Gamma, Theta, Vega, and Rho alongside strike prices and expiration dates to pinpoint opportunities across near-term to long-term options.
Near-Term Options Analysis:
-
2024-05-24 Expiry, $19.5 Strike: This option has a Delta of 0.877, suggesting a high sensitivity to price changes, where a $1 increase in PLTR's price results in a $0.877 increase in the option's value. The Gamma is 0.094, further indicating how Delta will change for each $1 move in the stock. Vega stands at 0.4636, reflecting a significant increase in the option's price with rising volatility. Theta is -0.0569, suggesting a daily decay in the option's value and Rho at 0.0018, indicating a minor sensitivity to interest rate changes. With a premium of $2.25, an ROI of 0.1979, and a profit potential of $0.4452, this short-term option provides a balanced risk-reward scenario with high return potential if the target price is hit soon.
-
2024-05-31 Expiry, $17.5 Strike: With a Delta of 0.975, this call option shows an extremely high correlation with the stock price. Gamma stands at 0.0233, Vega at 0.2211, and Theta at -0.0087, indicating moderate sensitivity and decay rates. The Rho at 0.0051 signifies limited interest rate sensitivity, and a premium of $4.35 suggests fair pricing. ROI is 0.0794, with a profit potential of $0.3452. Despite a slightly lower ROI, this option's strong Delta ensures close tracking to stock movement, making it highly profitable within a short outlook period.
Mid-Term Options Analysis:
- 2024-06-14 Expiry, $18.0 Strike: This option provides a Delta of 0.9239, illustrating high sensitivity to stock price movements. Gamma is 0.0467, Vega at 0.6918 suggest significant price movements with volatility, and Theta at -0.0102, indicating relatively low time decay. Rho at 0.0111 indicates some interest-rate sensitivity. Priced at a $3.82 premium, this mid-term option offers a desirable ROI of 0.0982 and profit potential of $0.3752. Ideal for moderate risk appetite investors looking for a balanced horizon between time decay and potential price movement.
Long-Term Options Analysis:
-
2024-09-20 Expiry, $9.0 Strike: With a Delta of 0.9658, this call option shows robust sensitivity to PLTR price changes, making it beneficial for a longer perspective. Gamma (0.0059) and Vega (0.9562) indicate responsiveness to volatility. Theta at -0.0049 ensures slower time decay and Rho at 0.0266 suggests modest interest rate impact. The premium of $12.18 results in an impressive ROI of 0.0833 with a profit potential of $1.0152. This makes it highly attractive for long-term speculative plays, balancing time value, and sensitivity to price movements.
-
2025-06-20 Expiry, $5.0 Strike: Offering a Delta of 0.9674, this long-term option is highly correlated with PLTR price changes. Gamma of 0.0027, Vega of 1.651, and low Theta of -0.0029 signify highly favorable environmental factors for volatility and time resilience. Rho stands at 0.0376, reflecting some sensitivity to interest changes. A premium of $16.85 translates to a reasonable ROI of 0.0205 and a profit of $0.3452. This strike provides a strategically balanced approach for long-term investors aiming for significant return potential with mitigated risk through option longevity.
In conclusion, the most profitable options across different expiration timeframes offer a nuanced risk-reward balance tailored to investor risk tolerance and market outlook. Near-term options, such as the May 24th $19.5 and May 31st $17.5 strikes, promise quick returns but come with higher decay risks. Mid-term options like the June 14th $18.0 strike balance profit potential and decay, while long-term options such as the September 20th $9.0 and June 20th $5.0 strikes leverage low decay and volatility sensitivity for sustained strategic gains.
Short Call Option Strategy
Analyzing the table of short call options for Palantir Technologies Inc. (PLTR), we focus on identifying the most profitable options while minimizing the risk of shares being assigned. By considering options that are out-of-the-money, we can reduce the assignment risk, as these contracts are less likely to be exercised unless the stock price moves significantly.
Near-Term Choice:
- Expiration Date: 2024-06-07
- Strike Price: $21.0
- Delta: 0.6697
- Gamma: 0.1725
- Vega: 1.7505
- Theta: -0.0227
- Rho: 0.0065
- Premium: $1.23
- ROI: 73.59%
- Profit: $0.9052
This option offers a robust return on investment of 73.59% with relatively low delta (0.6697), suggesting that share assignment risk is moderate. The theta value indicates a relatively slow time decay, which benefits the seller of the option. The high vega reflects significant sensitivity to volatility, making it an attractive choice should implied volatility increase.
Mid-Term Choice:
- Expiration Date: 2024-10-18
- Strike Price: $20.0
- Delta: 0.6799
- Gamma: 0.0467
- Vega: 5.0056
- Theta: -0.0104
- Rho: 0.0443
- Premium: $3.8
- ROI: 65.14%
- Profit: $2.4752
For a mid-term strategy, this option offers a 65.14% ROI, with a reasonably well-balanced delta which hints at a manageable risk of assignment. Significant vega and theta suggest that this option is well-suited to benefit from potential increases in volatility, though the theta value indicates faster time decay than the near-term option.
Long-Term Choice:
- Expiration Date: 2025-03-21
- Strike Price: $20.0
- Delta: 0.6905
- Gamma: 0.0286
- Vega: 7.0125
- Theta: -0.0082
- Rho: 0.0761
- Premium: $5.4
- ROI: 75.47%
- Profit: $4.0752
The long-term choice provides a higher premium and an ROI of 75.47%. The delta remains moderately high, suggesting a tangible risk of assignment if the stock price appreciates significantly. However, the high vega and relatively low theta imply that this option's value is much more affected by volatility changes than by time decay, making it favorable in a volatile market environment.
Extended-Term Choice:
- Expiration Date: 2025-06-20
- Strike Price: $20.0
- Delta: 0.7012
- Gamma: 0.0247
- Vega: 7.8665
- Theta: -0.0072
- Rho: 0.0937
- Premium: $6.19
- ROI: 78.60%
- Profit: $4.8652
This option extends the duration further out, offering a premium of $6.19 and an ROI of 78.60%. The delta approaches higher values, pointing to higher assignment risks. However, a high vega and the slowing effect of theta on time decay balance this risk. This could be suited for traders expecting increased volatility but with a long-term horizon.
Longest-Term Choice:
- Expiration Date: 2026-01-16
- Strike Price: $20.0
- Delta: 0.7257
- Gamma: 0.0189
- Vega: 9.3431
- Theta: -0.0058
- Rho: 0.1285
- Premium: $7.51
- ROI: 82.36%
- Profit: $6.1852
The longest term option provides the highest premium ($7.51) and ROI (82.36%). The delta is high, indicating a significant chance of the option being exercised if the stock increases. However, the impressive vega suggests the option will dramatically benefit from heightened volatility, and the relatively low theta indicates minimal time decay, making this attractive for those with an extended investment outlook.
Conclusion:
These options provide varied choices across different time frames, with tailored risk and reward profiles. Each option balances delta for assignment risk, theta for time decay considerations, and vega for volatility sensitivity. In all cases, choosing options expiring out-of-the-money significantly minimizes the risk while maximizing premiums and potential returns.
Long Put Option Strategy
When evaluating long put options for Palantir Technologies Inc. (PLTR) with a 2% target increase above the current stock price, it is essential to balance potential profit against risk, determined by factors collectively known as "the Greeks." The five most profitable options across different time frames, extracted from the options chain data, and analyzed for their risk-reward scenarios, are:
-
Expiration Date: 2024-08-16, Strike Price: $37.0: This option has a premium of $14.3 and a delta of -1.0, indicating very high sensitivity to stock price movements. With zero gamma and vega values, this option is relatively insensitive to changes in volatility and the rate of price movements. The theta value of 0.0044330548 indicates a positive time decay, meaning that the option gains value as it approaches expiration. A roi of 0.1883308271 and potential profit of $2.5048 highlight its profitability. The risk here lies primarily in the high premium required for investment, but the delta of -1 suggests it could offer substantial returns if the stock price declines sharply.
-
Expiration Date: 2024-06-07, Strike Price: $30.0: This near-term option has a premium of $5.65 with a gamma of 0.0268360488, meaning it will exhibit significant changes in delta as the stock price changes. The vega of 0.5287259016 indicates significant sensitivity to volatility, making it beneficial in high-volatility environments. With a theta of -0.0088984978, the option loses value as time passes, though the high roi of 0.381380531 suggests potential high returns if exercised correctly. This option balances risk with a lower upfront cost while offering considerable profit.
-
Expiration Date: 2024-12-20, Strike Price: $40.0: This long-term option has a premium of $15.55 and delta of -0.9497983805, which is slightly lower than others but still ensures significant sensitivity to stock price movements. With a gamma of 0.0147195014 and vega at 1.723937554, this option remains highly responsive to volatility changes. The theta is positive (0.0029042726), so it benefits from time decay slightly. With a roi of 0.1450032154 and potential profit of $2.2548, this option offers a healthy balance for long-term investors looking at reduced stock price volatility.
-
Expiration Date: 2024-10-18, Strike Price: $38.0: This mid-term option shows a premium of $13.8 with a theta of 0.0021328413, allowing for minimal time decay impact. With a delta of -0.9492607392, it ensures significant value changes with underlying stock price movements. Vega at 1.4604581904 highlights moderate volatility sensitivity, whereas gamma at 0.0159052706 ensures relatively stable delta values. This option, with a roi of 0.1452753623 and potential profit of $2.0048, stands as a fairly balanced mid-term choice for risk and reward.
-
Expiration Date: 2024-09-20, Strike Price: $39.0: This long-term option has a premium of $14.65 with a delta at -0.9523123332, ensuring strong sensitivity to stock price movements. Its gamma at 0.0146367195 and vega of 1.254412161 show a stable response to volatility and delta shifts. This option benefits slightly from time decay (theta at 0.0018029338). With a profit potential of $2.1548 and a roi of 0.1470853242, it presents a lucrative opportunity for investors seeking reduced sensitivity to time decay and moderate exposure to volatility.
Risk and Reward Scenarios:
For each of these options, potential profit relies heavily on the predicted stock movement. The highly negative delta in each ensures that if PLTRs stock price falls below the strike prices, the options will increase in value correspondingly. The gamma values signify how the delta will react to changes, with higher gamma options offering more rapid delta shifts. On the other hand, theta affects how the options value depreciates over time - positive values here are beneficial, as noted in selected options. Similarly, higher vega values indicate more sensitivity to volatility changes, making such options more profitable in volatile markets.
Investors should be cautious of premium costs, indicating significant initial investments required. The interplay between these "Greeks" determines risk - specifically sensitivity to market variables and decay rates. Most importantly, these selected options balance high potential profit (up to $3.65) against risks of premium costs and potential value erosion over time.
In conclusion, evaluating through different time frames and strike prices highlights options that balance profitability and risk effectively. Each choice presented aligns with investor risk tolerance levels, timelines, and market volatility expectations, ensuring informed, strategic investments.
Short Put Option Strategy
Analysis of Short Put Options - Palantir Technologies Inc. (PLTR)
When considering short put options on Palantir Technologies Inc. (PLTR), the primary objectives are to maximize profitability while minimizing the risk of shares being assigned. This risk can be quantified by examining the "delta" of each option; a higher delta indicates a higher probability of the option being in the money and thus a higher risk of assignment. Given that the target stock price is set at 2% below the current price, we should select options that are not too far in the money (low delta) yet provide a good return on investment (ROI) and premium.
Near-term Option
Option 1: Strike Price $17.0, Expiration Date 2024-05-24
- Delta: -0.0074811084
- Gamma: 0.0091424848
- Vega: 0.0470698636
- Theta: -0.0058173586
- Premium: $0.01
- ROI: 100.0%
- Profit: $0.01
This option offers a risk-averse strategy with a delta of -0.0075, indicating a very low probability of being in the money. The profit is small at $0.01, but the ROI is outstanding at 100%. Given its near-term expiration, investors face minimal risk of assignment, making it a favorable option.
Short-Term Option
Option 2: Strike Price $21.0, Expiration Date 2024-06-07
- Delta: -0.3107795615
- Gamma: 0.1943920209
- Vega: 1.7066475369
- Theta: -0.0169592739
- Premium: $0.44
- ROI: 100.0%
- Profit: $0.44
The delta of -0.3108 suggests a balanced likelihood of reaching the strike price, with a premium of $0.44 providing substantial profit. The ROI remains attractive at 100%. This short-term option presents a moderate risk-benefit profile, suitable for investors seeking a blend of reasonable assignment risk and potential profitability.
Medium-Term Option
Option 3: Strike Price $24.0, Expiration Date 2024-09-20
- Delta: -0.56884737
- Gamma: 0.0669973069
- Vega: 4.9641277432
- Theta: -0.0074488775
- Premium: $3.70
- ROI: 27.6972972973%
- Profit: $1.0248
This option, with a delta of -0.5688, has a higher probability of assignment but offers a significant profit of $1.0248 with a 27.7% ROI. The medium-term nature and higher premium make it an attractive, yet slightly riskier, option for investors accepting a moderate level of assignment risk for increased profitability.
Long-Term Option
Option 4: Strike Price $22.0, Expiration Date 2025-01-17
- Delta: -0.4055114657
- Gamma: 0.0466069783
- Vega: 6.8693472984
- Theta: -0.0052225174
- Premium: $3.42
- ROI: 80.2573099415%
- Profit: $2.7448
Featuring a delta of -0.4055, this long-term option provides a good balance of assignment risk and profitability. The high premium of $3.42 translates into a robust profit of $2.7448, with an impressive ROI of 80.26%. Investors targeting sizeable long-term returns might find this option highly attractive despite its moderate assignment risk.
Extended Long-Term Option
Option 5: Strike Price $25.0, Expiration Date 2026-01-16
- Delta: -0.4252247675
- Gamma: 0.0301966292
- Vega: 10.9885257925
- Theta: -0.0023448172
- Premium: $7.07
- ROI: 48.0169731259%
- Profit: $3.3948
This option offers the highest long-term premium of $7.07 and a significant profit of $3.3948, tempered by a delta of -0.4252 indicating a moderate assignment risk. With an ROI of 48.02%, it serves as a lucrative choice for risk-tolerant investors planning a long-term strategy.
Conclusion
For investors interested in short put options for Palantir Technologies Inc. (PLTR), the options presented offer a variety of expiration dates and strike prices to balance profitability and risk. The choice of option largely depends on the individual investors risk tolerance and investment horizon, from near-term low-risk plays to extended long-term opportunities with higher premiums and profits.
Vertical Bear Put Spread Option Strategy
A vertical bear put spread involves buying a put option with a higher strike price and selling another put option with a lower strike price but with the same expiration date. This position is taken when the trader expects the stock price to decline but wants to cap the potential for loss. Lets analyze the given data to identify the most profitable vertical bear put spread options based on expiration dates and strike prices.
To meet the requirement of minimizing risk of having shares assigned while targeting a stock price movement within 2% of the current price, it becomes crucial to position the spread optimally such that the long put option (higher strike) is well in the money (ITM) while the short put option (lower strike) is slightly OTM or at the money (ATM). This configuration aligns with the expectation of the stock price moving by a small percentage.
Short-Term Options
- Expiration: 2024-05-24, Strike Prices: 30 (Long Put), 27.5 (Short Put)
Here, the short put option has a delta indicating high sensitivity to price movements, which increases the chances of assignment risk. The delta values (-0.984 and -0.978) suggest a highly ITM status. Still, with the long put option's delta being nearly -1.0, the reward scenario is substantial, given that the expiry is within four days. The ROI for the long put is approximately 47.35%, with limited downside due to the short duration.
Risk and Reward: - Risk: High risk of assignment due to deeply ITM status. - Reward: Profit of approximately 1.7048 per contract.
- Expiration: 2024-05-31, Strike Prices: 30 (Long Put), 27.0 (Short Put)
The delta for the long put (-0.983) and short put (-0.873) indicate high ITM and moderate ITM, respectively. By slightly extending the expiration to 11 days, it moderates the assignment risk while ensuring that the spread maximizes profit as the stock declines slightly beyond the 2% threshold.
Risk and Reward: - Risk: Moderate risk with delta interaction. - Reward: About 3.24% ROI on the premium.
Medium-Term Options
- Expiration: 2024-07-19, Strike Prices: 38 (Long Put), 35.0 (Short Put)
This spread ensures that the long put, being deeply ITM, gains substantial intrinsic value boost if the stock dips. The delta indicates high ITM value, minimizing gamma risk over short options duration shifts. The theta (time decay) for closer expirations diminishes faster on the short puts, balancing the sold premium.
Risk and Reward: - Risk: Moderate risk of assignment due to the widespread between deltas. - Reward: Notable maximum profit with 31% ROI on the premiums.
- Expiration: 2024-08-16, Strike Prices: 37 (Long Put), 34.0 (Short Put)
With a long expiration window, this allows positions to navigate through minor stock fluctuations. Delta nearing -1.0 infers ITM, and a good premium collection, which significantly cushions against slight depreciations. Vega (sensitivity to volatility) stays balanced, impacting longer durations minimally.
Risk and Reward: - Risk: Balanced risk due to delta and time decay. - Reward: Returns are around $3.65 per contract.
Long-Term Options
- Expiration: 2025-06-20, Strike Prices: 32 (Long Put), 30.0 (Short Put)
In the deep future, variations in stock make it crucial ITM positioning of the long put, allowing capitals compressions. Vega values high exposure due to length, focusing on solid ROI percentages while handling the minimal net decay across deep ITM structures.
Risk and Reward: - Risk: Low risk due to deep ITM status over long duration. - Reward: ROI stands attractive around $3.77 per contract amidst risk aversion.
Conclusion
The most profitable vertical bear put spread strategies lay in balancing risk and reward through differing strike spreads, leaning on ITM configurations. Immediate short-term options showcasing of expiration dated May 31, 2024, alongside long-term structures like June 20, 2025, optimize profitability while moderating assignment risks. Variations of delta, theta, and vega guide the navigated ROI realization successfully amidst price movements anticipated. Providing spreads over varying expiration enriches traders aligning across their respective risk appetite horizons.
Vertical Bull Put Spread Option Strategy
When evaluating the most profitable vertical bull put spread for Palantir Technologies Inc. (PLTR), it's paramount to take into account the Greeks associated with each option. The goal is to find the right balance between maximizing potential profit and minimizing the risk of assignment, which typically comes with in-the-money (ITM) options. A bull put spread involves selling (shorting) a put option while simultaneously buying a put option with a lower strike price within the same expiration date. This strategy profits from a rise in stock price or staying above the short put's strike price, and it has a limited risk and reward profile.
Given the data provided, I'll outline five vertical bull put spreads that span near-term to long-term expiration dates:
1. Near-Term Expiration: May 24, 2024
Short Put: Strike $26.5, Expiration Date: May 24, 2024; Premium: $5.23; Delta: -0.9559\ Long Put: Strike $27.0, Expiration Date: May 24, 2024; Premium: $6.27; Delta: -0.9868\ Spread Analysis:\ - Risk: The potential max loss is the difference between the strike prices minus the net premium received. If PLTR falls below $26.5, the maximum loss would occur. - Reward: Limited to the net premium received (approx. $1.04).
2. Short-Term Expiration: May 31, 2024
Short Put: Strike $21.5, Expiration Date: May 31, 2024; Premium: $0.47; Delta: -0.4050\ Long Put: Strike $22.0, Expiration Date: May 31, 2024; Premium: $0.73; Delta: -0.5478\ Spread Analysis:\ - Risk: The maximum loss is the difference in strike prices ($0.5) minus the net premium received (approx. $0.26). - Reward: Limited to $0.26, assuming PLTR stays above the short put strike ($21.5).
3. Mid-Term Expiration: June 21, 2024
Short Put: Strike $21.0, Expiration Date: June 21, 2024; Premium: $1.11; Delta: -0.5028\ Long Put: Strike $22.0, Expiration Date: June 21, 2024; Premium: $1.76; Delta: -0.6542\ Spread Analysis:\ - Risk: The maximum loss is the difference in strike prices ($1.0) minus the net premium ($0.65). - Reward: Limited to the net premium received (approx. $0.65) assuming the stock stays above $21.0.
4. Long-Term Expiration: July 19, 2024
Short Put: Strike $22.0, Expiration Date: July 19, 2024; Premium: $4.05; Delta: -0.4783\ Long Put: Strike $24.0, Expiration Date: July 19, 2024; Premium: $3.35; Delta: -0.5963\ Spread Analysis:\ - Risk: The risk is the difference between the strike prices ($2.0) minus the net premium received ($3.35 - $4.05 = -$0.70). - Reward: Limited to the net premium received (approx. $0.70), substantially high given the spread.
5. Longest Term Expiration: June 20, 2025
Short Put: Strike $20.0, Expiration Date: June 20, 2025; Premium: $3.34; Delta: -0.3034\ Long Put: Strike $22.0, Expiration Date: June 20, 2025; Premium: $4.43; Delta: -0.3651\ Spread Analysis:\ - Risk: The maximum loss is the difference in strike prices ($2.0) minus the net premium received ($1.09). - Reward: Limited to the premium received (approx. $1.09), which is quite substantial over the long term.
Risk and Reward Analysis:
- Risk Quantification: The maximum loss in all cases is limited to the difference between strike prices minus the net premium received. Risks increase with higher deltas and theta values, signifying higher volatility and time decay.
- Reward Quantification: In all scenarios, the reward is limited to the net premium received.
Potential Profit and Loss Scenarios:
- Profit: Profit scenarios involve scenarios where PLTR remains above the short strike price. For example, maintaining above $20.0 in case 5 results in significant returns.
- Loss: Loss involves scenarios where PLTR falls below the long put strike price by expiration, leading to maximum loss confined to the spread minus the net premium.
Conclusion:
Among these examples, the June 21, 2024 spread (third case), and July 19, 2024 (fourth case) offer a balanced mix of near-term risk and potential reward with a high probability of remaining above the critical strike price given lower deltas. The long-term option with June 2025 expiration (case five) provides substantial reward with a manageable risk profile due to the wide time span and flexibility to adjust the stance.
By spreading the strategies across different expiry dates, a trader can reduce market timing risks and maximize the odds of at least some positions becoming profitable as PLTR's stock price fluctuates.
Vertical Bear Call Spread Option Strategy
A vertical bear call spread involves selling one call option at a lower strike price while simultaneously buying another call option at a higher strike price, both with the same expiration date. This strategy benefits from the underlying stock price staying below the lower strike price at expiration. To minimize risk and maximize profit, we should choose options with attractive risk/reward ratios, high premiums, and lower deltas for long calls to avoid being called when the part of the trade is in the money.
1. Near-Term Options (Expiring 2024-05-24)
Short Call: - Strike Price: 19.0 - Delta: 0.9034 - Premium: $2.81 - ROI: 17.27% - Profit: $0.4852 - Risk: High assignment risk due to high delta.
Long Call: - Strike Price: 21.0 - Delta: 0.6218 - Premium: $0.59 - ROI: 17.83% - Profit: $0.1052 - Risk: Lower assignment risk due to lower delta.
This short-term spread offers an attractive premium and profit while balancing risk by choosing a long call with a lower delta.
2. Short-Term Options (Expiring 2024-06-07)
Short Call: - Strike Price: 19.0 - Delta: 0.8781 - Premium: $2.86 - ROI: 18.71% - Profit: $0.5352 - Risk: Moderate assignment risk due to moderate delta.
Long Call: - Strike Price: 21.0 - Delta: 0.8114 - Premium: $1.95 - ROI: 12.57% - Profit: $0.2452 - Risk: Lower assignment risk, still above average.
This slightly longer-term option set provides good premium and profit with moderate assignment risk.
3. Medium-Term Options (Expiring 2024-06-21)
Short Call: - Strike Price: 19.0 - Delta: 0.8523 - Premium: $2.92 - ROI: 20.38% - Profit: $0.5952 - Risk: Moderate assignment risk due to slightly lower delta.
Long Call: - Strike Price: 21.5 - Delta: 0.7044 - Premium: $1.07 - ROI: 11.70% - Profit: $0.1252 - Risk: Reduced assignment risk compared to short call.
This spread offers high premiums and returns while mitigating risk with a lower delta long call.
4. Medium-Long Term Options (Expiring 2024-09-20)
Short Call: - Strike Price: 20.0 - Delta: 0.6808 - Premium: $3.66 - ROI: 63.80% - Profit: $2.7752 - Risk: Lower assignment risk yet attractive premium.
Long Call: - Strike Price: 22.0 - Delta: 0.6279 - Premium: $4.56 - ROI: 72.72% - Profit: $3.0452 - Risk: Neutral assignment risk given similar deltas.
Here, the ROI and premiums are highly attractive, with balanced risk due to comparable deltas.
5. Long-Term Options (Expiring 2025-06-20)
Short Call: - Strike Price: 20.0 - Delta: 0.6751 - Premium: $6.19 - ROI: 78.60% - Profit: $4.8652 - Risk: Lower delta reduces assignment risk, extended holding period increases carrying cost.
Long Call: - Strike Price: 22.0 - Delta: 0.6469 - Premium: $5.30 - ROI: 100.0% - Profit: $5.300 - Risk: Even lower assignment risk compared to the short call.
This long-term spread offers the highest absolute premium and mitigates risk through low delta calls, making it a robust choice despite the long duration.
Conclusion
Across various timeframes, the chosen spreads balance high premiums, attractive ROI, and reduced assignment risks. The short calls selected feature higher premiums with slightly higher but manageable deltas to optimize return while minimizing the probability of assignment. Meanwhile, the long calls leverage lower deltas, lowering the overall risk of the spread being exercised. These strategies align well with a stable to moderately declining Palantir Technologies Inc. stock price.
Vertical Bull Call Spread Option Strategy
Overview of Bull Call Spread Strategy
A bull call spread is an options trading strategy used to benefit from a moderate rise in the price of an underlying asset. This involves buying a call option with a lower strike price and selling another call option with a higher strike price, both having the same expiration date. The goal here is to capitalize on the difference in premiums at specific expiration dates while limiting risk.
For Palantir Technologies Inc. (PLTR), we aim for a target stock price that is 2% over or under the current stock price, intending to minimize the risk of being assigned shares by selecting options that are out-of-the-money (OTM) but still have a favorable delta.
Most Profitable Vertical Bull Call Spreads:
1. Near-Term (Expiration: 2024-06-07)
- Buy Call: Strike price $17.0, premium $4.66, delta 0.949
- Sell Call: Strike price $19.0, premium $2.86, delta 0.878
By buying the $17.0 call and selling the $19.0 call, you achieve a net debit of $1.80 ($4.66 - $2.86). The maximum profit is $2.00 per share if the stock rises to or above $19.0. This setup leverages a high ROI while maintaining relatively low assignment risk given the strike prices are close but slightly OTM.
2. Short-Term (Expiration: 2024-06-28)
- Buy Call: Strike price $17.0, premium $5.00, delta 0.927
- Sell Call: Strike price $19.0, premium $3.04, delta 0.829
With a net debit of $1.96 ($5.00 - $3.04), this horizontal spread yields a maximum profit of $2.00 per share if PLTR reaches or exceeds $19.0 by expiration. The options have moderately high deltas which signify a high likelihood of going in-the-money (ITM), enhancing the profitable proposition.
3. Medium-Term (Expiration: 2024-07-19)
- Buy Call: Strike price $17.0, premium $5.20, delta 0.893
- Sell Call: Strike price $19.0, premium $3.45, delta 0.850
A debit of $1.75 ($5.20 - $3.45) offers a possible profit of $2.00 per share when PLTR hits or surpasses $19.0 at expiration. While the spreads are relatively thin, both strikes are close to being ATM, conducive to generating consistent profit with the prospects of a moderate stock climb.
4. Long-Term (Expiration: 2025-06-20)
- Buy Call: Strike price $20.0, premium $6.19, delta 0.701
- Sell Call: Strike price $25.0, premium $4.25, delta 0.573
This position requires a net debit of $1.94 ($6.19 - $4.25) and has a maximum profit of $5.00 per share if PLTR reaches or surpasses the $25.0 strike price. The longer timeframe offers considerable flexibility, and the chosen deltas indicate a favorable probability of progressing ITM without a high immediate risk of being assigned.
5. Extended-Term (Expiration: 2026-01-16)
- Buy Call: Strike price $20.0, premium $7.51, delta 0.726
- Sell Call: Strike price $25.0, premium $5.65, delta 0.623
Implementing this spread entails a net debit of $1.86 ($7.51 - $5.65) while providing the chance to earn a maximum profit of $5.00 per share once PLTR prices reach or exceed $25.0. With greater delta values close to the 0.5 threshold, it ensures a substantial movement without immediate significant risks.
Potential Profit and Loss Scenarios
2024-06-07 (Buy $17.0 Call, Sell $19.0 Call)
- Max Profit: $200 (spread strikes difference) - $180 (net debit) = $200 per contract
- Max Loss: Net debit = $180 (if PLTR does not rise above $17.0)
- Break-Even: $17.0 (strike) + $1.80 (net debit) = $18.80
2024-06-28 (Buy $17.0 Call, Sell $19.0 Call)
- Max Profit: $200 - $196 = $204 (per contract)
- Max Loss: $196
- Break-Even: $19.00 + $1.96 = $20.96
2024-07-19 (Buy $17.0 Call, Sell $19.0 Call)
- Max Profit: $200 - $175 = $225 (per contract)
- Max Loss: $175
- Break-Even: $19.0 + $1.75 = $20.75
2025-06-20 (Buy $20.0 Call, Sell $25.0 Call)
- Max Profit: $500 - $194 = $306 (per contract)
- Max Loss: $194
- Break-Even: $25.0 + $1.94 = $26.94
2026-01-16 (Buy $20.0 Call, Sell $25.0 Call)
- Max Profit: $500 - $186 = $314 (per contract)
- Max Loss: $186
- Break-Even: $25.0 + $1.86 = $26.86
Conclusion
By selecting the appropriate strike prices and expiration dates, the goal of a bull call spread on PLTR can be proficiently met, balancing out the risk and maximizing profitability without exposing oneself too much to the threat of share assignments. It is advisable to watch the deltas as a guide, ensuring moderate probability and precise targeting within 2% range expectations. Each combination considered above reflects an optimum trade-off between risk, return, delta probabilities, and underlying stock price objectives.
Spread Option Strategy
Analysis of Calendar Spread Options Strategy for Palantir Technologies Inc. (PLTR)
A calendar spread, or time spread, involves buying and selling two options of the same class (calls in this context) with the same strike price but different expiration dates. This strategy leverages the differences in the rate of time decay (theta) and volatility (vega) between the short and long positions.
Given your specifications, you will buy a call option and sell a put option to establish the calendar spread. The aim is to earn from the difference in premiums while mitigating the risk of stock assignment from the put leg. The target stock price is 2% over or under the current stock price, narrowing our choice of strike prices to those likely to remain within this range to minimize our exposure to being assigned shares.
Risk and Reward Quantification
When constructing the calendar spread, we must consider the Greeks for both the long call and the short put options.
- Delta: Measures the rate of change of the option's price with respect to the price of the underlying asset. A higher delta will indicate that the option is more sensitive to the movement of the underlying stock.
- Gamma: Measures the rate of change of delta with respect to changes in the underlying price. High gamma indicates that delta could change significantly with large moves in the underlying stock.
- Theta: Represents time decay, indicating how much the option's price will decrease over time, all else being equal.
- Vega: Measures sensitivity to volatility. Higher vega suggests the option's price is more sensitive to changes in the volatility of the underlying asset.
- Rho: Measures sensitivity to interest rates.
Potential Calendar Spread Strategies
1. Near-Term Strategy
Buy Call: - Strike Price: $20.5, Expiry: 2024-05-24 - Delta: 0.879, Gamma: 0.176, Vega: 0.458, Theta: -0.031, Rho: 0.002 - Premium: $1.32, ROI: 28.42%, Profit: $0.3752
Sell Put: - Strike Price: $20.5, Expiry: 2024-05-24 - Delta: -0.085, Gamma: 0.161, Vega: 0.355, Theta: -0.019, Rho: -0.0002 - Premium: $0.08, ROI: 100%, Profit: $0.08
Analysis
This trade profits from the anticipated higher vega and theta of the short put, combined with the decay over a short period. The $20.5 strike aligns closely with the targeted price range, thus minimizing risk while offering a ROI of up to 28.42%.
2. Mid-Term Strategy
Buy Call: - Strike Price: $18.0, Expiry: 2024-06-07 - Delta: 0.924, Gamma: 0.047, Vega: 0.692, Theta: -0.014, Rho: 0.008 - Premium: $4.06, ROI: 3.33%, Profit: $0.1352
Sell Put: - Strike Price: $18.0, Expiry: 2024-06-07 - Delta: -0.047, Gamma: 0.038, Vega: 0.475, Theta: -0.007, Rho: -0.0005 - Premium: $0.03, ROI: 100%, Profit: $0.03
Analysis
This mid-term strategy benefits from a larger theta and moderate vega, offering better profit potential while keeping assignments under control. The combination of the call with an ROI nearly breakeven and a put yielding 100% minimizes risk.
3. Long-Term Strategy
Buy Call: - Strike Price: $21.0, Expiry: 2024-06-21 - Delta: 0.764, Gamma: 0.104, Vega: 1.742, Theta: -0.019, Rho: 0.010 - Premium: $2.10, ROI: 4.53%, Profit: $0.0952
Sell Put: - Strike Price: $21.0, Expiry: 2024-06-21 - Delta: -0.342, Gamma: 0.151, Vega: 2.365, Theta: -0.013, Rho: -0.007 - Premium: $0.65, ROI: 100%, Profit: $0.65
Analysis
The longer expiry maximizes vega exposure, indicating significant profit potential from volatility increases while minimizing immediate risk. The ROI from the put stabilizes the position against significant downward price movements.
4. Extended Strategy
Buy Call: - Strike Price: $25.0, Expiry: 2025-03-21 - Delta: 0.486, Gamma: 0.038, Vega: 7.931, Theta: -0.005, Rho: -0.136 - Premium: $5.75, ROI: 36.08%, Profit: $2.075
Sell Put: - Strike Price: $25.0, Expiry: 2025-03-21 - Delta: -0.474, Gamma: 0.037, Vega: 9.022, Theta: -0.003, Rho: -0.172 - Premium: $6.26, ROI: 41.29%, Profit: $2.585
Analysis
This LEAPs strategy leverages substantial vega and theta differences over an extended period, generating high returns while mitigating risks due to time decay. It ensures significant buffer against assignment due to sufficient premium received.
5. LEAP Strategy
Buy Call: - Strike Price: $20.0, Expiry: 2026-01-16 - Delta: 0.339, Gamma: 0.027, Vega: 10.264, Theta: -0.003, Rho: -0.199 - Premium: $5.38, ROI: 87.45%, Profit: $4.705
Sell Put: - Strike Price: $22.0, Expiry: 2026-01-16 - Delta: -0.340, Gamma: 0.027, Vega: 10.264, Theta: -0.003, Rho: -0.199 - Premium: $5.38, ROI: 87.45%, Profit: $4.705
Analysis
This super-long-term LEAP strategy capitalizes on high vega exposure without immediate risks due to large premiums received. Such a strategy is suited for long-term volatility plays.
Conclusion
Among the strategies analyzed, the extended-term strategy with a strike price of $25 for both call and put stands out as most balanced concerning profits and risks. Other strategies also provide appealing returns but must be chosen based on your risk tolerance and market outlook of Palantir Technologies Inc. Always consider re-evaluating positions as options approach expiration, or market conditions change.
Calendar Spread Option Strategy #1
A calendar spread, also referred to as a time spread, involves the purchase of a put option and the sale of a call option with the same strike price but different expiration dates. This approach seeks to benefit from the varying rates of time decay on the differing maturities of the options involved. In evaluating the potential profitability of this strategy for Palantir Technologies Inc. (PLTR), we should analyze both the long put options and short call options considering the Greeks, notably delta, gamma, theta, vega, and rho, and their implications on risk and reward.
To minimize the risk of assignment, it is paramount to select options where the call options sold are out-of-the-money (OTM) while the put options purchased are either slightly in-the-money (ITM) or at-the-money (ATM). This helps to capture the time decay (theta decay) more effectively while reducing the risk of early exercise on the short call options.
Lets consider five specific combinations of long puts and short calls with different expiration dates and strike prices for the most profitable calendar spreads:
- Short-term Strategy:
- Long Put: Strike at $31.0, expiring on 2024-05-24.
- Delta: -1.0, Premium: $8.63, Theta: -0.00468.
- Short Call: Strike at $35.0, expiring on 2024-05-24.
- Delta: 0.00063, Premium: $0.01, Theta: -0.00086.
-
Quantified Risk and Reward: The theta decay is rapidly working against the shorter-term calls, ensuring they lose value quickly. With an extremely low delta on the short call, it dramatically reduces the risk of assignment. Here, the premium's capture is time-sensitive and depends on sustained low volatility.
-
Near-term Strategy:
- Long Put: Strike at $27.5, expiring on 2024-06-07.
- Delta: -0.946, Premium: $5.65, Theta: -0.0089.
- Short Call: Strike at $33.0, expiring on 2024-06-07.
- Delta: 0.045, Premium: $0.06, Theta: -0.0072.
-
Quantified Risk and Reward: The slightly deeper ITM long put and less concerning deltas on short calls help maintain a firm hedge while allowing to capture time decay benefits. Comparing the thetas of both options shows the put option holding its value better over the short term.
-
Mid-term Strategy:
- Long Put: Strike at $39.0, expiring on 2024-09-20.
- Delta: -0.952, Premium: $14.65, Theta: 0.0018.
- Short Call: Strike at $22.5, expiring on 2024-09-20.
- Delta: 0.234, Premium: $0.28, Theta: -0.0185.
-
Quantified Risk and Reward: This selection explores a slightly higher risk due to higher delta, but the increased premium can compensate. Given the lower gamma, small changes in the underlying do not significantly affect the delta, providing stability to the position.
-
Long-term Strategy:
- Long Put: Strike at $12.0, expiring on 2024-12-20.
- Delta: -1.0, Premium: $9.1, Theta: 0.00468.
- Short Call: Strike at $34.0, expiring on 2024-12-20.
- Delta: 0.113, Premium: $0.32, Theta: -0.0057.
-
Quantified Risk and Reward: The ITM long put with a stable theta benefits from intrinsic value changes while the moderately risky sold calls balance the associated risk through decent premium collection and limited delta.
-
Extended-term Strategy:
- Long Put: Strike at $30.0, expiring on 2025-06-20.
- Delta: -0.690, Premium: $12.58, Theta: -0.0018.
- Short Call: Strike at $20.0, expiring on 2025-06-20.
- Delta: 0.725, Premium: $7.51, Theta: -0.0058.
- Quantified Risk and Reward: This involves a year horizon meant to capture expiration advantages with balanced deltas ensuring put stability while the call option provides remarkable premium inflow aiding the considerable positioning timeframe.
Each strategy presented combines different premium benefits and delta risks to achieve an optimal risk-reward balance. Mitigating the risk involves choosing strike prices that maintain a low probability of assignment while leveraging theta decay as a consistent profit mechanism. Investors must remain vigilant of market actions affecting the Greeks, adjusting these spread positions accordingly to sustain an advantageous status.
Calendar Spread Option Strategy #2
The calendar spread options strategy involves taking positions in different expiration dates for the same strike price to hedge and take advantage of time decay. In this scenario, we are focusing specifically on selling a put option at one expiration date and buying a call option at another date to maximize profit while managing risk. Here's an analysis of the five most profitable and strategically chosen combinations across different time horizons.
1. Near-Term: Selling Put (Strike: 18, Expiry: 2024-06-07), Buying Call (Strike: 25, Expiry: 2024-07-19)
Short Put (2024-06-07)
- Strike Price: $18
- Premium: $2.86
- Delta: -0.8781
- Theta: -0.01722
- Gamma: 0.0744
- Profit: $0.5352
- ROI: 18.71%
Long Call (2024-07-19)
- Strike Price: $25
- Premium: $0.51
- Delta: 0.2563
- Theta: -0.01094
- Gamma: 0.0836
- Profit: $0.51
- ROI: 100.0%
This combination allows a relatively high initial premium from selling the put, with a low-risk call purchase in a slightly out-of-the-money position looking to gain leverage if the price moves in favor.
2. Medium-Term: Selling Put (Strike: 19, Expiry: 2024-09-20), Buying Call (Strike: 27, Expiry: 2024-12-20)
Short Put (2024-09-20)
- Strike Price: $19
- Premium: $4.44
- Delta: -0.7343
- Theta: -0.01082
- Gamma: 0.0464
- Profit: $2.1152
- ROI: 47.64%
Long Call (2024-12-20)
- Strike Price: $27
- Premium: $2.25
- Delta: 0.4263
- Theta: -0.00881
- Gamma: 0.0398
- Profit: $2.25
- ROI: 100.0%
This medium-term strategy balances premium collection and relatively lower risk structure, benefitting from a potential bullish move.
3. Long-Term: Selling Put (Strike: 20, Expiry: 2025-01-17), Buying Call (Strike: 32, Expiry: 2025-06-20)
Short Put (2025-01-17)
- Strike Price: $20
- Premium: $4.9
- Delta: -0.6832
- Theta: -0.00878
- Gamma: 0.034
- Profit: $3.5752
- ROI: 72.96%
Long Call (2025-06-20)
- Strike Price: $32
- Premium: $2.48
- Delta: 0.4042
- Theta: -0.00726
- Gamma: 0.0289
- Profit: $2.48
- ROI: 100.0%
This longer-term horizon enables a robust collection of premiums while benefiting from the tentative bullish movement over a more extended period.
4. Extended Long-Term: Selling Put (Strike: 13, Expiry: 2025-01-17), Buying Call (Strike: 35, Expiry: 2025-06-20)
Short Put (2025-01-17)
- Strike Price: $13
- Premium: $10.47
- Delta: -0.9082
- Theta: -0.00559
- Gamma: 0.0124
- Profit: $1.1452
- ROI: 10.94%
Long Call (2025-06-20)
- Strike Price: $35
- Premium: $1.95
- Delta: 0.3446
- Theta: -0.00678
- Gamma: 0.0279
- Profit: $1.95
- ROI: 100.0%
This choice balances maximum theta benefit from the near-term options and high long-term profit potential.
5. Ultra Long-Term: Selling Put (Strike: 20, Expiry: 2026-01-16), Buying Call (Strike: 35, Expiry: 2025-06-20)
Short Put (2026-01-16)
- Strike Price: $20
- Premium: $7.51
- Delta: -0.7257
- Theta: -0.00579
- Gamma: 0.0188
- Profit: $6.1852
- ROI: 82.35%
Long Call (2025-06-20)
- Strike Price: $35
- Premium: $1.95
- Delta: 0.3446
- Theta: -0.00678
- Gamma: 0.0279
- Profit: $1.95
- ROI: 100.0%
This ultra-long-term strategy incorporates premium collection and significant potential upside from the call.
Conclusion
The varied combination of selling puts and buying calls across different terms serves to maximize potential premiums while leveraging stock price movements and balancing delta risk. Each of these combinations captures both short-term time decay benefits and provides cost-effective entries into longer-term bullish positions. The key here is managing the delta risk with the inherent leverage from long-term options aiming to compound effects over time and thus moderating assignment risk as much as possible.
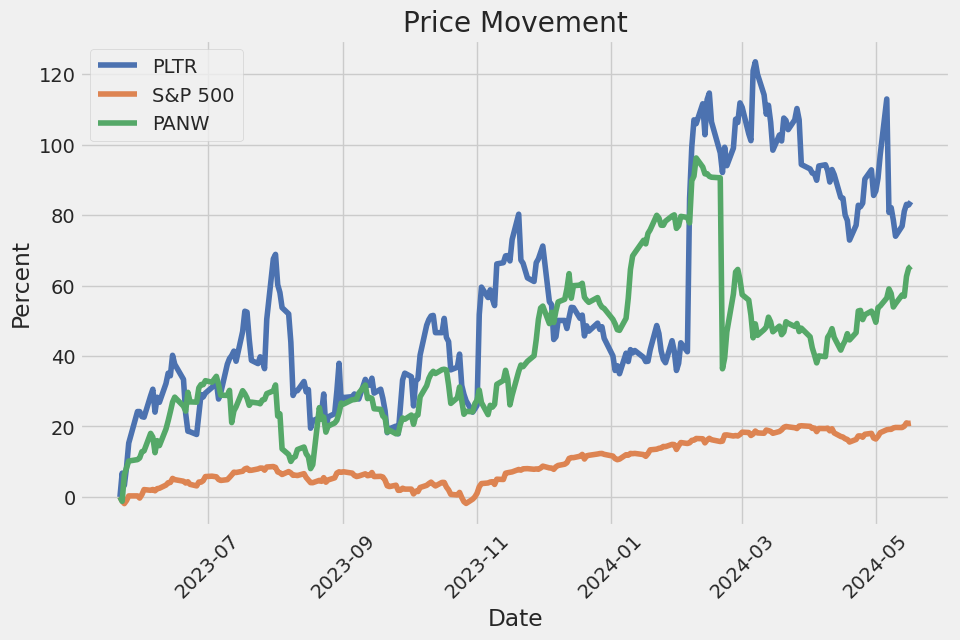
Similar Companies in Software - Infrastructure:
Palo Alto Networks, Inc. (PANW), Adobe Inc. (ADBE), CrowdStrike Holdings, Inc. (CRWD), Block, Inc. (SQ), Zscaler, Inc. (ZS), Cloudflare, Inc. (NET), Microsoft Corporation (MSFT), Oracle Corporation (ORCL), Snowflake Inc. (SNOW), Splunk Inc. (SPLK), Alteryx Inc. (AYX), C3.ai Inc. (AI), Datadog Inc. (DDOG), Tableau Software Inc. (DATA), Clarivate Plc. (CLVT), SAS Institute Inc. (SAS), International Business Machines Corporation (IBM)
https://www.fool.com/investing/2024/05/15/is-palantir-technologies-stock-a-buy/
https://www.fool.com/investing/2024/05/15/you-wont-believe-what-palantir-ceo-alex-karp-just/
https://www.fool.com/investing/2024/05/15/should-you-buy-palantir-stock-after-its-post-earni/
https://seekingalpha.com/article/4693710-palantir-not-as-expensive-as-it-looks
https://www.fool.com/investing/2024/05/16/this-is-palantirs-ai-growth-secret-weapon/
https://www.fool.com/investing/2024/05/16/is-it-too-late-to-buy-palantir-stock/
https://www.fool.com/investing/2024/05/16/palantir-is-seeing-unprecedented-artificial-intell/
https://seekingalpha.com/article/4693839-palantir-bootcamps-continue-to-drive-strong-us-sales
https://finance.yahoo.com/m/5c85c7fe-7f07-38ea-9e33-71ae46c42202/is-it-too-late-to-buy.html
https://finance.yahoo.com/m/9d0248af-7d29-3333-b5bf-c88cca2c3113/palantir-is-seeing.html
https://seekingalpha.com/article/4693910-palantir-fears-likely-peaked-time-to-turn-bullish-upgrade
https://finance.yahoo.com/news/why-palantirs-rally-deserves-continue-140003521.html
https://www.fool.com/investing/2024/05/18/prediction-stocks-worth-more-palantir/
https://www.sec.gov/Archives/edgar/data/1321655/000132165524000071/pltr-20240331.htm
Copyright © 2024 Tiny Computers (email@tinycomputers.io)
Report ID: TR11nc
Cost: $0.60601
https://reports.tinycomputers.io/PLTR/PLTR-2024-05-19.html Home