The 3D Printing ETF (ticker: PRNT)
2024-01-15
 The 3D Printing ETF (ticker: PRNT) offers investors exposure to the rapidly evolving 3D printing industry, which is poised to transform various sectors from manufacturing to healthcare. This exchange-traded fund (ETF) tracks the performance of the Total 3D-Printing Index, which is composed of equity securities and depositary receipts of exchange-listed companies involved in the 3D printing industry. Managed by ARK Investment Management LLC, PRNT encompasses a variety of businesses ranging from hardware manufacturers to software developers and service providers integral to the 3D printing process. The fund seeks to capture not only the growth of well-established companies but also the innovative potential of emerging players in this cutting-edge domain. By investing in PRNT, individuals can gain diversified investment exposure to this niche market, which is likely to benefit from the ongoing digitization and customization trends shaping the future of production.

| Previous Close | 22.2107 | Open | 22.36 | Day Low | 22.07 |
| Day High | 22.3436 | PE Ratio (TTM) | 28.44 | Volume | 14,585 |
| Average Volume | 17,796 | Average Volume (10 days) | 18,560 | Bid | 20.65 |
| Ask | 23.35 | Bid Size | 1,000 | Ask Size | 900 |
| Total Assets | 155,198,352 | 52 Week Low | 17.44 | 52 Week High | 25.15 |
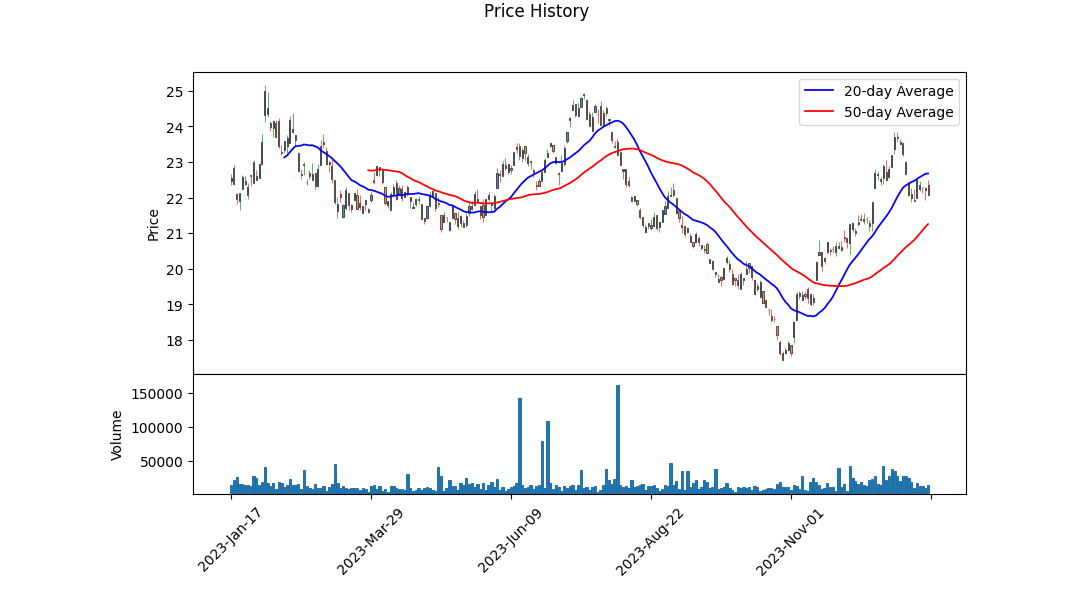
| 50 Day Average | 21.25508 | 200 Day Average | 21.63259 | NAV Price | 22.222 |
| YTD Return | -4.95% | Beta (3 Years) | 1.34 | 3 Year Average Return | -15.75535% |
| 5 Year Average Return | 0.8305% |
 Based on a comprehensive assessment of the technical analysis metrics, fundamental data, and current balance sheet information for the ETF (Exchange Traded Fund) PRNT, there seems to be an observable trend that can give us insights into the anticipated stock price movement over the next few months.
Technical Indicators: - The Parabolic SAR (PSAR), with settings (0.02, 0.2), have indicated bearish signals in the recent past, as evidenced by the PSAR being above the price, but there's a lack of recent values for the indicator to suggest any trend reversal. - The On-Balance Volume (OBV) shows increased trading volume and positive accumulation, suggesting that buying pressure may be overcoming selling pressure. - The Moving Average Convergence Divergence (MACD) histogram values are negative, which indicates that the short-term momentum is weaker than the long-term momentum, pointing to bearish sentiment. However, the magnitude of the negative MACD histogram is decreasing, suggesting that bearish momentum could be losing strength.
Fundamental Analysis: - The Price-to-Earnings (PE) ratio of 28.44 is higher than the industry average, implying that the ETF's underlying holdings might be overvalued compared to their earnings. - The fund's Year-to-Date (YTD) total return is negative (-4.95%), which could affect investor sentiment. However, this data point requires context as to the performance of competitor funds and the sector as a whole. - The fund has a Beta of 1.34 over five years, indicating higher volatility than the market. This volatility, while potentially attracting short-term traders, may be unsettling for long-term investors.
Given the current market dynamics and technical analysis, we might expect the following stock price movements for PRNT in the upcoming months:
- The observed weakening bearish momentum might result in a consolidation phase or even a potential reversal. The decreasing negative values of the MACD histogram could signal an upcoming bullish crossover, which would be a positive sign for prices.
- With a PE ratio significantly higher than the industry average, a price correction could occur if earnings reports from the underlying holdings do not justify these valuations.
- A consistency in OBV accumulation may provide the impetus for a bullish price action, as it may signal underlying investor confidence.
- Given the ETF's higher than average volatility, we may see significant price swings, which might present trading opportunities for short-term traders while adding risk for long-term investors.
- The absence of significant dividend yields may limit the attractiveness of this ETF to income-focused investors, potentially limiting buying pressure from this demographic.
It is critical for investors to consider these factors in conjunction with their investment horizons and risk tolerances. While technical indicators can offer guidance, they are best used in combination with fundamental analysis and market trends. Observing upcoming financial reports and industry-specific news will be vital to confirm or refute these predictions. As the market environment is ever-changing, ongoing analysis will be necessary to stay abreast of impactful developments.
| Alpha () | -0.0494 |
| Beta () | 1.1489 |
| R-squared | 0.596 |
| Adj. R-squared | 0.596 |
| F-statistic | 1,852 |
| Prob (F-statistic) | 2.97e-249 |
| Log-Likelihood | -2,058.1 |
| AIC | 4,120 |
| BIC | 4,130 |
| No. Observations | 1,256 |
| Df Residuals | 1,254 |
| Df Model | 1 |
In the linear regression analysis between PRNT and SPY, the coefficient of determination, known as R-squared, is 0.596, suggesting that approximately 59.6% of the variability in PRNT can be explained by its relationship with SPY. The model indicates a positive relationship with a beta coefficient () of 1.1489, meaning that PRNT tends to move in the same direction as SPY, and it does so more aggressively given that the beta is larger than one.
The alpha () value is -0.0494, which represents the model's intercept and can be thought of as the average expected return of PRNT when SPYs return is zero. The negative alpha suggests that when the market's performance (as indicated by SPY) is neutral, PRNT is expected to underperform slightly. However, since the p-value for alpha is 0.161, it is not statistically significant at common significance levels (such as 0.05), suggesting that we cannot confidently assert that PRNT, on average, delivers a performance different than a zero return when the market's returns are neutral.
The 3D Printing ETF represents a forward-looking investment vehicle that offers exposure to one of the most disruptive and transformative manufacturing technologies of the 21st century. This ETF provides a convenient solution for investors seeking to capitalize on the growth and innovation within the 3D printing industry, comprising a diverse range of equities associated with 3D printing hardware, software, materials, and services.
With the onset of Industry 4.0, 3D printing, also known as additive manufacturing, has become an integral part of the manufacturing sector. This technology has the potential to revolutionize production by enabling rapid prototyping, increasing supply chain flexibility, reducing waste, and offering customizability in various applications from healthcare to aerospace. As companies across the globe integrate 3D printing solutions into their production chains, this sector shows promising growth prospects that stand out for both industrial users and individual consumers.
The 3D Printing ETF is meticulously curated to include a blend of established names in the industry as well as emerging players that showcase high growth potential. This multifaceted approach aims to balance the risks associated with the varying maturity levels of different companies in the rapidly evolving 3D printing space.
To provide a clearer picture of the ETF's composition, let's take a look at its top ten holdings, represented in the following table:
| company | symbol | percent |
|---|---|---|
| Xometry Inc | XMTR | 6.84 |
| BICO Group AB | BICO.ST | 6.74 |
| Proto Labs Inc | PRLB | 4.52 |
| 3D Systems Corp | DDD | 4.25 |
| Faro Technologies Inc | FARO | 4.10 |
| Materialise NV | MTLS | 3.79 |
| Straumann Holding AG | STMN.SW | 3.66 |
| Stratasys Ltd | SSYS | 3.54 |
| Renishaw PLC | RSW.L | 3.39 |
| HP Inc | HPQ | 3.27 |
These holdings illustrate the diverse nature of the ETF's investment strategy, with companies involved in different aspects of the 3D printing ecosystem. For instance, Xometry Inc, a leader in on-demand manufacturing, provides a marketplace service that connects customers with optimal manufacturing solutions, leveraging the power of 3D printing technology. BICO Group AB, another major stakeholder, specializes in bio-convergence and provides technologies that support the development of therapies and diagnostics.
Proto Labs Inc. prides itself on being a rapid manufacturing company that produces custom prototypes and on-demand production parts, blending traditional manufacturing methods with advanced 3D printing technology. Similarly, 3D Systems Corp, a pioneer in the industry, offers 3D printers, print materials, on-demand manufacturing services, and software solutions, driving innovation across various sectors.
Moreover, it's imperative to consider Faro Technologies Inc, with expertise in 3D measurement, imaging, and realization technology. Materialise NV brings software solutions and 3D printing services to the healthcare and industrial markets, enhancing patient outcomes and streamlining product development.
Next, Straumann Holding AG, with its focus on dental care, integrates 3D printing into its solutions, while Stratasys Ltd is renowned for its 3D printing equipment and materials that cater to a wide range of industries. Renishaw PLC offers precision measurement and healthcare products that are augmented by additive manufacturing technologies. Lastly, HP Inc adds to the diversity with its Multi-Jet Fusion 3D printing technology, which appeals to industrial markets.
Diving further into the appeal of the 3D Printing ETF, one recognizes that it not only captures the growth potential of pure-play 3D printing companies but also includes those that are adopting the technology to innovate within their respective fields. This type of thematic investment is geared towards capturing the essence of future technological progress, with the fund's components being the frontrunners of the industry's expansion.
The 3D Printing ETF is also an attractive proposition for investors due to its global reach. Its portfolio is not limited to U.S.-based companies but also incorporates international entities, which allows for a diversified geographic exposure. The companies in the ETF are headquartered across Europe, North America, and Asia-Pacific, which underlines the global nature of the 3D printing revolution.
It is worthwhile to note that the selection criteria for inclusion in the 3D Printing ETF includes market capitalization, liquidity, and revenue generation from 3D printing-related businesses. The ETF seeks to maintain a balance between growth and value, making regular adjustments to its holdings to ensure that the most promising and relevant players in the 3D printing landscape are represented.
In summary, the 3D Printing ETF is designed to offer investors a unique opportunity to participate in the advancements of the 3D printing sector, which is a prominent component of the evolving technological landscape. With an emphasis on innovation, growth, and diversification, this ETF is poised to potentially benefit from the cross-industrial applications of additive manufacturing and the ongoing research and development activities that continue to unlock new uses for 3D printing technologies.
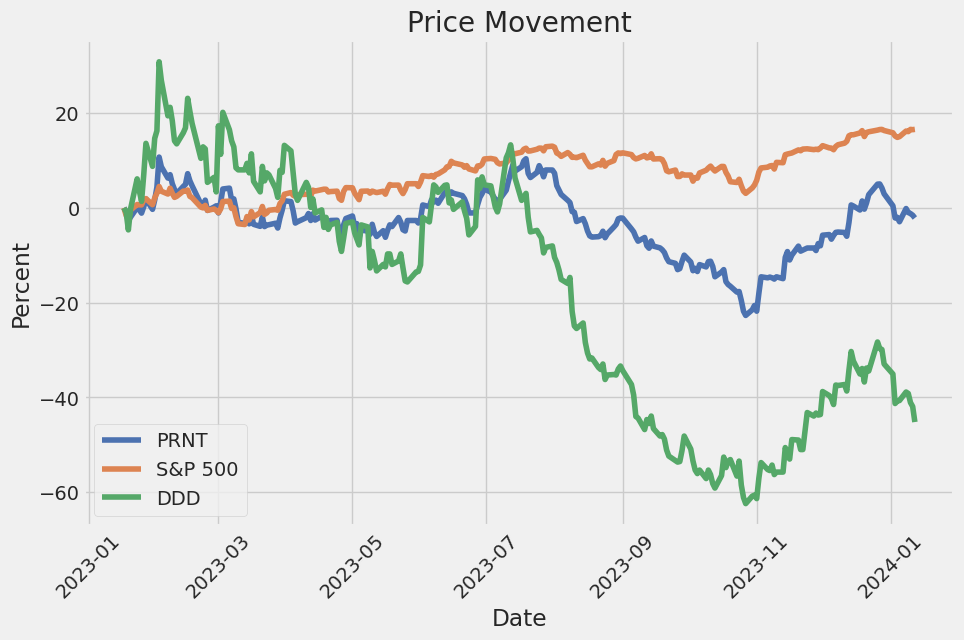
The 3D Printing ETF (PRNT) experienced notable fluctuations from 2019 to early 2024, as evidenced by the analysis of its returns. Despite the ARCH model detecting no trend in the mean of the returns (as shown by a Zero Mean model), it highlighted significant volatility in the asset over time. The volatility can be particularly characterized by the 'omega' parameter at approximately 2.98, which implies a baseline level of variance, and an 'alpha[1]' at around 0.2368, suggesting that past returns have a moderately substantial impact on future volatility.
| Statistic | Value |
|---|---|
| R-squared | 0.000 |
| Adj. R-squared | 0.001 |
| Log-Likelihood | -2,595.97 |
| AIC | 5,195.94 |
| BIC | 5,206.21 |
| No. Observations | 1,256 |
| omega | 2.9809 |
| alpha[1] | 0.2368 |
To assess the financial risk of a $10,000 investment in The 3D Printing ETF (PRNT) over a one-year period, a sophisticated approach that combines volatility modeling and machine learning predictions can be employed.
Beginning with the volatility modeling aspect, it is instrumental in understanding the level of uncertainty or risk associated with the returns of The 3D Printing ETF. This model is particularly adept at capturing the time-varying nature of volatility, which is a characteristic inherent in financial time series data. By fitting this model to historical return data, it extrapolates the persistence and mean-reversion of volatility, which is essential in quantifying the risk profile of the investment. Typically, the model's parameters are estimated from historical data, and once calibrated, they provide a measure of expected future volatility. This estimated volatility can then be used to determine the investment's Value at Risk (VaR).
In parallel, machine learning predictions can lend further depth to this financial risk analysis. By training a model like a decision tree-based regressor on historical price and return data, it becomes possible to predict future returns of the ETF. This process involves identifying patterns and relationships within the data that may not be immediately apparent or utilized by traditional models. The predictive strength of this machine learning approach depends on the features used, which may include past prices, volume, as well as technical and fundamental indicators.
When these two methodologies are integrated, the predictive capabilities of the machine learning predictions can complement the volatility measures provided by the volatility modeling. The estimated future returns from the machine learning model can be adjusted for risk by incorporating the volatility projections, leading to a more comprehensive view of potential future performance and associated risks.
From this integrated analysis, the Value at Risk (VaR) at a 95% confidence interval can be calculated. This figure represents the maximum expected loss over a specified time frame, which, in this case, was determined to be $258.31 from a $10,000 investment in the ETF. VaR is a widely-used risk management tool that helps investors understand the extent of potential losses, and the 95% confidence interval specifically means there's a 5% chance that the actual loss could exceed this VaR amount within the one-year period.
This analysis accentuates the multifaceted nature of risk in equity investments and displays the utility of merging volatility modeling with machine learning predictions. By quantitatively capturing potential loss magnitudes with the VaR metric, investors can make more informed decisions regarding investments in The 3D Printing ETF and manage their risk exposure accordingly.
Similar Companies in None:
3D Systems Corp (DDD), Stratasys Ltd (SSYS), Proto Labs Inc (PRLB), Materialise NV (MTLS), ExOne Co (XONE), Desktop Metal, Inc. (DM), HP Inc. (HPQ), Autodesk, Inc. (ADSK)
Copyright © 2024 Tiny Computers (email@tinycomputers.io)
Report ID: LYplHh
https://reports.tinycomputers.io/PRNT/PRNT-2024-01-15.html Home