Rent the Runway, Inc. (ticker: RENT)
2024-02-01
 Rent the Runway, Inc. (ticker: RENT) represents a novel approach to the fashion and apparel industry through their online service that allows customers to rent, subscribe, or buy designer apparel and accessories. The company's innovative platform addresses the growing consumer interest in the sharing economy and sustainable fashion by providing access to high-end fashion without the need for permanent ownership. Rent the Runway has capitalized on this trend by offering a range of rental options, including one-time rentals and subscription services which provide customers with a constantly rotating wardrobe, thus promoting a more sustainable and economically savvy approach to fashion. Despite its pioneering business model, Rent the Runway has faced challenges typical of many startups in scaling its operations and achieving profitability. Investors closely monitor RENT as a barometer for the subscription-based fashion rental market, observing key metrics such as subscriber growth, customer retention rates, and operational efficiencies. The company's performance is also seen as a broader indicator of the gig economy's impact on traditional retail and consumer behavior.
| Address | 10 Jay Street, Brooklyn, NY, 11201, United States | Phone | 212 524 6860 | Website | https://www.renttherunway.com |
| Industry | Apparel Retail | Sector | Consumer Cyclical | Full Time Employees | 880 |
| Previous Close | 0.6142 | Open | 0.624 | Day Low | 0.581 |
| Day High | 0.6634 | Beta | 1.014 | Forward P/E | -0.6047 |
| Volume | 264,572 | Average Volume (10 days) | 553,610 | Bid | 0.5901 |
| Ask | 0.6017 | Market Cap | 42,523,532 | 52 Week Low | 0.42 |
| 52 Week High | 4.82 | Price to Sales (TTM) | 0.14279225 | Fifty Day Average | 0.62002 |
| Two Hundred Day Average | 1.3335 | Enterprise Value | 288,291,584 | Profit Margins | -0.38481998 |
| Shares Outstanding | 67,223,104 | Shares Short | 7,651,707 | Held Percent Insiders | 19.391% |
| Held Percent Institutions | 63.054% | Short Ratio | 5.39 | Book Value | -1.473 |
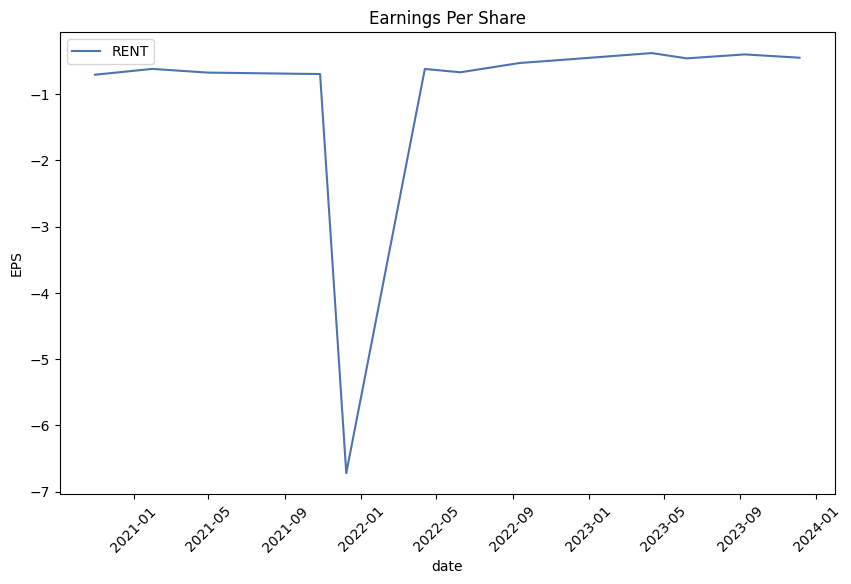
| Net Income to Common | -114,600,000 | Trailing EPS | -1.71 | Forward EPS | -1.00 |
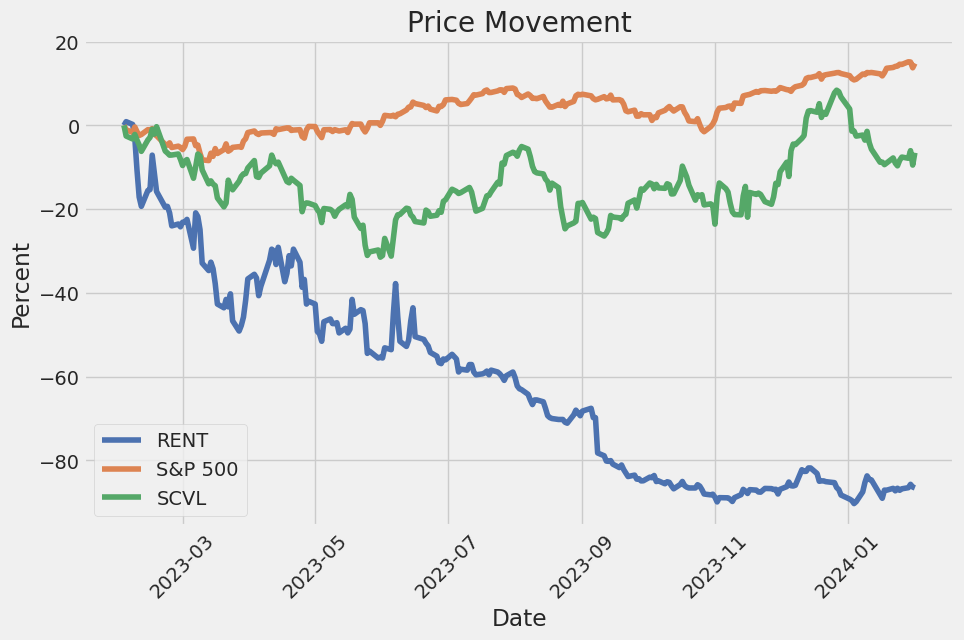
| Enterprise to Revenue | 0.968 | Enterprise to EBITDA | -15.173 | 52 Week Change | -86.3555% |
| S&P 52 Week Change | 15.9312% | Currency | USD | Current Price | 0.6047 |
| Target High Price | 3.00 | Target Low Price | 0.60 | Target Mean Price | 1.66 |
| Target Median Price | 2.00 | Recommendation Mean | 2.4 | Total Cash | 105,900,000 |
| Total Cash Per Share | 1.506 | EBITDA | -19,000,000 | Total Debt | 351,000,000 |
| Quick Ratio | 1.617 | Current Ratio | 1.852 | Total Revenue | 297,800,000 |
| Revenue Per Share | 4.448 | Return On Assets | -13.339% | Free Cash Flow | -60,250,000 |
| Operating Cash Flow | -16,000,000 | Revenue Growth (TTM) | -6.3% | Gross Margins | 70.248% |
| EBITDA Margins | -6.38% | Operating Margins | -28.138% |
| Sharpe Ratio | -1.5688372061673364 | Sortino Ratio | -26.345129258004693 |
| Treynor Ratio | -0.6738334385544403 | Calmar Ratio | -0.9586051039728312 |
The risk-adjusted performance ratios for RENT indicate a negative risk-adjusted return over the past year. A negative Sharpe Ratio suggests that an investor would receive higher risk-adjusted returns from a risk-free investment compared to holding the stock, with the Sortino Ratio emphasizing the downside risk is particularly poor. The Treynor Ratio conveys that the stock has not provided an adequate return for its beta, or systematic risk. Lastly, the negative Calmar Ratio signals that the stock's annual rate of return has not been sufficient to justify the periodic drawdowns or peak-to-trough falls experienced by investors.
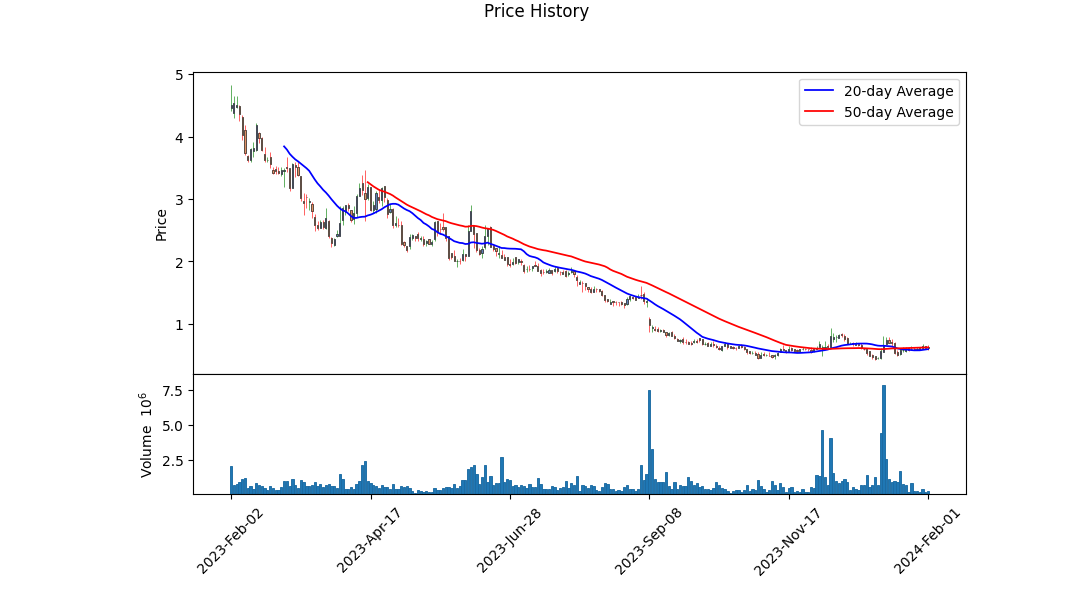
The examination of technical indicators on the last trading day reveals some positive Price Volume Trend and Accumulation/Distribution, as seen by an increasing On-Balance Volume (OBV). However, the Moving Average Convergence Divergence (MACD) histogram values seem relatively flat, indicating a potential near-term overbought scenario or reduced momentum. It is, therefore, essential to approach the next few months with caution, considering possible consolidation or a mild pullback might occur before any sustained upward price movement.
Analyzing balance sheets and cash flow statements, a pressing concern is the significant level of net debt and the negative tangible book value. The high level of retained earnings deficit suggests historical challenges in generating profits persist. Despite reducing total debt, operating income remains steeply negative, which may indicate structural issues within the company's business operations or competitive pressures in the industry.
Revenue projections for the next year appear positive, with an estimated average increase of over 6%. Earnings expectations, while still negative, are forecasted to improve from prior levels. Analysts' positive growth estimates for the coming quarter and year could be a tailwind for sentiment, but these must be contrasted carefully with the company's capability to meet these expectations based on its performance history and competitiveness within the industry.
Market conditions, company fundamentals, and technical indicators suggest a cautious approach regarding the suggested stock price movement. While there's analyst anticipation for improved earnings, fundamental difficulties may hinder this stock's upward momentum in the near to medium term. It's advisable for investors to carefully weigh the positive analyst sentiment against the negative financial ratios and weak balance sheet when considering their investment position.
In our recent analysis of Rent the Runway, Inc. (RENT) while applying the principles from "The Little Book That Still Beats the Market," we evaluated the company's financial health and performance metrics. Specifically, we calculated Rent the Runway, Inc.'s return on capital (ROC) and earnings yield. Unfortunately, both these figures underscore some financial concerns. The ROC stands at -18.18%, which indicates that the company is currently generating negative returns on the capital invested. This is a red flag as it suggests that RENT is not effectively converting its invested capital into profits. Adding to the concern, the earnings yield came in at a deeply negative -357.20%, which is exceptionally unusual and points towards a company that is losing a significant amount of money in relation to its equity valuation. Such a low earnings yield is indicative of either a high share price relative to earnings or substantial losses, which, in this case, likely reflects the latter given their negative ROC. Potential investors should exercise caution, and a thorough risk assessment would be essential before considering investment in RENT. Existing shareholders and stakeholders might expect strategic changes or restructuring efforts from the company's management to turn these financial metrics around.
Based on the provided metrics for Rent the Runway, Inc. (RENT), we can analyze how the company compares to the criteria outlined by Benjamin Graham in "The Intelligent Investor."
P/E Ratio (Price-to-Earnings): The P/E ratio for RENT is negative (-0.19095789473684213), which indicates that the company has negative earnings (losses), as a P/E ratio is calculated by dividing the current market price by the earnings per share (EPS). Because Benjamin Graham emphasized investing in companies with low, but positive, P/E ratios, RENT would not meet this criterion, as its negative earnings suggest financial distress rather than an undervaluation.
P/B Ratio (Price-to-Book): The P/B ratio for RENT is 0.12090961031766806, which is quite low and suggests that the company's market value is significantly below its book value. While at first glance this might appear to align with Graham's preference for stocks trading below their book value, the other metrics and overall context must also be considered. A low P/B ratio could sometimes signal that the market reflects underlying problems in the company or that the assets may be overstated.
Debt-to-Equity Ratio: The debt-to-equity ratio for RENT is negative (-8.929178470254957), which is unusual and typically indicates that a company has negative shareholder equity. This can occur if the company's liabilities exceed its assets. This is a red flag and not in line with Graham's criteria, as he favored companies with low debt-to-equity ratios. Negative shareholder equity could signal financial instability, which goes against the principle of a margin of safety.
Dividend History: According to the dividend history data provided, RENT does not have a history of dividend payments (the 'historical' list is empty). Benjamin Graham preferred companies with a consistent record of paying dividends, as this can be a sign of financial health and a company's ability to generate and return profits to shareholders. Thus, RENT does not meet Graham's criterion in this area.
In conclusion, from the key metrics provided, Rent the Runway, Inc. does not appear to align with Benjamin Graham's value investing principles. The negative earnings (reflected in a negative P/E ratio), the negative debt-to-equity ratio, and the lack of a dividend history all point to significant financial concerns. The stocks low P/B ratio, while possibly indicating undervaluation in other contexts, does not overcome the other negative indicators. Given these factors, RENT would not qualify as a suitable investment based on Graham's rigorous value investing standards. As such, it would not likely be recommended to either defensive or enterprising investors adhering to Graham's philosophy. It is worth mentioning that Graham's metrics are part of a larger framework and this analysis should be accompanied by thorough research and consideration of the company's competitive position, management quality, and other qualitative factors.
| Alpha () | -0.4158 |
| Beta () | 2.2901 |
| R-squared | 0.144 |
| Adj. R-squared | 0.142 |
| F-statistic | 95.18 |
| Prob (F-statistic) | 6.88e-21 |
| Log-Likelihood | -1,882.2 |
| AIC | 3,768 |
| BIC | 3,777 |
| No. Observations | 568 |
| Df Residuals | 566 |
| Df Model | 1 |
The linear regression analysis for RENT as the dependent variable and SPY representing the entire market as the independent variable indicates that the intercept, or alpha, of the model is approximately -0.4158. Alpha, in this context, represents the average value RENT would theoretically have if SPY were to be zero. Given the negative value of alpha, this suggests that RENT has a baseline negative expected return when the market's performance is not factored in. However, the true significance of the alpha value is somewhat uncertain in this analysis, as indicated by the P>|t| value for the constant term which is greater than common significance levels such as 0.05.
The beta coefficient for SPY comes in at 2.2901, which conveys a positive and more than proportional relationship between the returns of SPY and RENT. For every one-unit increase in SPY, RENT is expected to increase by approximately 2.2901 units, indicating leverage or a high degree of sensitivity to market movements. The R-squared value of the model is 0.144, which shows that around 14.4% of the variation in RENT can be explained by the SPY index. The relatively low R-squared value suggests that there are other factors besides the market, as represented by SPY, that are influential in driving RENT's performance, and these factors are not captured in this single-variable regression model.
Rent the Runway, Inc. (RENT) Q3 2023 Earnings Call Summary
Overview and Financial Health:
In the third quarter of 2023, Rent the Runway faced significant challenges, principally concerning their outstanding debt amounting to $312 million. The pandemic led to a steep fall in revenue due to lockdowns and a decline in the valuation of their inventory. An increase in debt was necessary to stabilize the business; however, their pre-COVID IPO valuation of $1.7 billion made it appear manageable. The significant level of debt resulted in the companys stock price dropping to sub-dollar levels, which affected investor confidence in its viability. CEO Jennifer Hyman emphasized reaching a pivotal moment where the focus is shifting towards their robust business model and market opportunities rather than their balance sheet struggles.
Debt Restructuring Measures:
Rent the Runway has announced substantial modifications to its debt terms to provide greater financial flexibility and the potential to generate more free cash flow before debt maturity. The changes include the elimination of both Payment-In-Kind (PIK) and cash interest for six quarters starting Q4 2023, a measure set to reduce total interest expense by $66 million in the period. This action will keep the debt stable at $312 million and allow the company to lower the strain on cash while striving for free cash flow break-even. Additionally, liquidity requirements have been reduced, and spending caps for 2024 have been mutually agreed upon, which should align with profitability goals.
Business Model and Growth Strategy:
Notwithstanding the financial issues, Rent the Runway continues to believe in the strength of their business model and the growth potential in the fashion rental market. The company acknowledged that their growth was temporarily hindered in 2023 due to inventory depth issues, resulting in increased churn rates. However, they saw improvement in customer experiences in the second half of 2023 due to enhancements in their inventory assortment, leading to higher Net Promoter Scores and lower global churn rates. The company also observed positive trends in rental satisfaction, utilization rates for workwear, and the success of particular strategies to boost customer retention and loyalty, deeming them ready to accelerate customer acquisition again.
Financial Performance and Guidance:
CFO Sid Thacker outlined financial performance in Q3, highlighting revenue decline and flat growth due to strategic decisions to improve profitability, along with a decrease in active subscribers resulting from reduced promotions and marketing expenditures. Despite fulfilling gross margin expectations, they closed the quarter with decreased revenue but maintained the active subscriber count. The management remains committed to achieving cash flow break-even in FY 2024 and plans to focus on improving profitability and controlling costs, presenting a confident outlook for the company's future performance in the rental market.
Overall, this earnings call underscored Rent the Runways determination to navigate through its current financial complexities, with an active approach to debt management and a strategic focus on enhancing customer experience, optimizing costs, and pursuing growth opportunities within the fashion rental industry.
of our new transportation contract with a major national carrier starting in September 2023. We anticipate fulfillment expenses per shipment in the fourth quarter of fiscal year 2023 to be roughly flat with the third quarter of fiscal year 2023 due to more favorable contract terms. Over time, we plan to continue to optimize our fulfillment network, reduce costs through scale, and continue to invest in fulfillment automation and technology across our centers to improve operational efficiency, even as we scale shipments.
Technology. Technology expenses include costs related to our proprietary technology that supports our transformative rental experience and logistics platform. These include costs associated with our website, mobile applications, customer data platform, and warehouse systems. Personnel and related costs for employees involved in engineering, product management, design, data analytics, IT, and other technology functions are significant components of technology expenses.
Marketing. Marketing expenses include costs associated with acquiring new subscribers and customers and retaining existing subscribers. These expenses include digital and offline advertising, promotional discounts, influencer and partnership marketing, personnel and related costs for our marketing team, and costs associated with brand events and public relations.
General and Administrative. General and administrative expenses comprise costs related to corporate functions that support the growth of our business. These include headquarter-related expenses, such as personnel and related costs for executive, finance, legal, human resources, and other administrative employees. Also included are legal, accounting, and other professional services fees, insurance, rent, and other office-related expenses. General and administrative expenses also include non-cash charges related to share-based compensation.
Rental Product Depreciation and Revenue Share. Rental product depreciation and revenue share expenses relate to the monetization and depreciation of our rental product assets. The Company depreciates owned apparel assets over three years and owned accessory assets over two years net of salvage values and recognizes the depreciation on a straight-line basis. Depreciation expense for rental product is time-based and includes all rental product items owned. As the Company diversifies its strategies for acquiring rental products (Wholesale, Share by RTR, and Exclusive Designs), the associated depreciation and cost methods affect the profitability and overall expense recognition for the related products.
Other Depreciation and Amortization. Other depreciation and amortization expenses consist of the depreciation of property and equipment, such as leasehold improvements, machinery, equipment, furniture, and fixtures, and amortization of software used in our daily operations.
Restructuring Charges/Loss on Asset Impairment. Restructuring charges and loss on asset impairment include expenses associated with initiatives like the September 2022 restructuring plan and discontinuance of certain projects. These can involve severance and related charges, as well as costs related to asset impairments.
Interest Expense/Income. Interest expense primarily relates to interest incurred on long-term debt, including the Temasek Facility. Interest income is derived from the Company's invested cash and cash equivalents.
Other Income/Expense. Other income and expense include various non-operating items such as sublease income, net foreign currency transaction gains or losses, and other non-operating expenses not related to the core business operations.
Income Tax Benefit/Expense. Income taxes reflect the provision for federal, state, and foreign income taxes, including the valuation allowance over deferred tax assets.
Liquidity and Financial Position. The Company's focus is on actively managing cash flow, maintaining a robust balance sheet, and ensuring access to sufficient liquidity. As of January 31, 2023, the Company held cash and cash equivalents of $105.9 million, decreasing from $154.5 million at the beginning of the same fiscal year. Long-term debt stood at $300.2 million, maturing in October 2026. The amended terms of the 2023 Amended Temasek Facility, including reduced minimum liquidity maintenance covenants, play a significant role in managing liquidity pressures.
The Company's management remains focused on achieving long-term sustainable growth while adapting to the evolving business and macroeconomic environment, potentially changing consumer behaviors, and other fluctuating market conditions.
Rent the Runway, Inc., once heralded as a transformative force in the fashion industry, is now navigating a landscape of evolving consumer preferences and behaviors. The company, known for its innovative garment rental model, has had to rethink its approach and realign with the changing priorities of its customer base. Faced with indications that shoppers are growing disenchanted with the concept of renting clothes, Rent the Runway has found the allure of providing variety, sustainability, and cost savings insufficient to sustain its initial momentum. As the market sentiment shifts, reflecting a potential preference for ownership and more personalized experiences over the convenience of fashion rentals, the company, and the industry at large, must re-evaluate the viability of the rental model.
In response to these challenges, Rent the Runway has undertaken a strategic restructuring which included a workforce reduction by approximately 10 percent, impacting 37 corporate roles. This downsizing is a component of a broader strategy focusing on channels anticipated to fuel growth, such as heightened marketing efforts, an improved consumer product range, and a heightened customer experience. Such changes are deemed essential for the company to gain a stronger foothold in the competitive and dynamic rental subscription market. This corporate shift was also marked by the announcement of Anushka Salinas's departure from her roles as chief operating officer and president, with CEO and co-founder Jennifer Hyman absorbing the presidential duties.
In financial terms, these strategic moves have been coupled with claims by Rent the Runway of robust unit economics and the intent to achieve free cash flow break-even in the fiscal year 2024. The company forecasts annual cost savings between $11 million and $13 million from the layoffs, though it also anticipates one-time restructuring charges in the region of $3 million to $4 million. Investors responded favorably to this news, evidenced by a notable rise in the company's stock price, which increased by 24.5 percent to 70 cents during midday trading post-announcement.
Underpinning these alterations in Rent the Runway's business tactics is the overarching goal of customer retention. To that end, the company has sought to enrich the consumer's journey by increasing the selection of items available for rent and refining the interface and functionality of its website. These improvements are viewed as critical to revitalizing consumer interest and engagement with the brand. Furthermore, Rent the Runway has demonstrated a resolve to consolidate its market position and investor confidence through a recent refinancing initiative, underscoring its commitment to overcoming the adversities brought on by shifts in consumer behaviors, such as those brought about by the COVID-19 pandemic.
According to Simply Wall St, as reported on January 19, 2024, Rent the Runway's intrinsic value was assessed using a Discounted Cash Flow analysis. The method incorporates projections of future cash flows discounted to their present value, delineating an anticipated growth from a negative $52.4 million in free cash flow in 2024, eventually reaching $16.4 million by 2033. Despite these projections, the intrinsic value of Rent the Runways stock was approximated to be near its trading price at the time, suggesting the market had already factored in the company's growth prospects.
Persevering through trials and undertaking a recovery trajectory, Rent the Runway exhibits the broader narrative of a business actively contending with fluctuating externalities and internal economic conditions. Its endeavors reflect a determination to restore its model and market prominence, with management confident in a rebound centering on fiscal year 2024.
For additional information and context on Rent the Runway's corporate restructuring and market outlook, several articles provide comprehensive accounts of these events. The Wall Street Journal article by Sabela Ojea, accessible here, delves into the evolving landscape of the fashion rental marketplace. Evan Clark's piece on Yahoo Finance, dated January 9, 2024, available via this link, details the company's workforce downsizing and the implications of Anushka Salinas's resignation. For insights into the company's financial valuations and intrinsic stock value, the Simply Wall St article on Yahoo Finance can be found here. Lastly, the article on Forbes, which analyzes the firms cost-cutting measures and leadership team's response to current challenges, can be read here.
Rent the Runway's progress and the industry's response to shifting consumer expectations will be significant factors to monitor going forward. As the company positions itself to adapt and possibly thrive in a post-pandemic economy, it underscores a broader discourse on innovation, consumer behavior, and the resilience of business models in an ever-changing market.
Rent the Runway, Inc. (RENT) experienced significant volatility between October 27, 2021, and February 1, 2024. The Zero Mean - ARCH model, which is a statistical model used to measure and predict financial volatility, indicates that the returns had a high level of variation with an omega value of approximately 51. Despite this, the alpha term, which measures the impact of past volatility on future volatility, is not statistically significant, suggesting that past volatility is not a reliable predictor of future volatility in this case.
| Statistic Name | Statistic Value |
|---|---|
| R-squared | 0.000 |
| Adj. R-squared | 0.002 |
| Log-Likelihood | -1,926.83 |
| AIC | 3,857.65 |
| BIC | 3,866.33 |
| No. Observations | 568 |
| Df Residuals | 568 |
| Df Model | 0 |
| omega | 50.9895 |
| alpha[1] | 0.0167 |
To analyze the potential financial risk associated with a $10,000 investment in Rent the Runway, Inc. (RENT) over one year, we employ a multifaceted approach involving volatility modeling and machine learning predictions. The use of volatility modeling specifically serves to capture and quantify the time-varying nature of stock volatility, which is pivotal for assessing the investment risk.
In employing volatility modeling, it's capable of handling the clustering of volatility, a common phenomenon in financial time series, where periods of high volatility tend to be followed by high volatility and periods of low volatility follow low volatility. By fitting this model to historical stock return data of Rent the Runway, Inc., we are able to estimate the conditional variance of the stock returns, which gives us insights into the expected level of fluctuation or risk associated with the stock for the upcoming period.
Alongside the volatility model, machine learning predictions are leveraged to forecast future stock returns. Using a multitude of relevant features that may include past stock prices, volume, financial ratios, market indicators, and more, the selected machine learning algorithm learns patterns from historical data to predict future outcomes. In particular, the model referred to here is recognized for its ability to capture complex nonlinear relationships within the data, while also preventing overfitting through its ensemble learning approach that combines multiple decision trees to make more accurate predictions.
With the predictions of future returns and the estimated volatility from the volatility modeling, it becomes possible to calculate the Value at Risk (VaR) a metric designed to quantify the level of financial risk over a specific time frame. VaR provides the maximum loss expected (with a certain level of confidence) over a set period for an investment in a risky asset.
In this case, the VaR at a 95% confidence interval implies that there is only a 5% chance that the investor will experience a loss greater than the calculated VaR amount over the course of a year. For the $10,000 investment in Rent the Runway, Inc., the annual VaR has been determined to be $1101.72, indicating a substantial level of risk. This highlights that there is a 95% probability that the investor should not expect to lose more than $1101.72 over the one-year period, under normal market conditions.
The integration of both volatility modeling and machine learning predictions provides a comprehensive view of investing risks. While the volatility model elucidates the potential variability component and the machine learning model aids in prognosticating expected returns, together they empower investors with a more detailed and nuanced understanding of what they might expect from their investment in Rent the Runway, Inc., thus making informed decisions about managing their potential risk exposure.
Similar Companies in Apparel Retail:
Shoe Carnival, Inc. (SCVL), Hibbett, Inc. (HIBB), Citi Trends, Inc. (CTRN), Zumiez Inc. (ZUMZ), The Buckle, Inc. (BKE), Genesco Inc. (GCO), Stitch Fix, Inc. (SFIX), Victoria's Secret & Co. (VSCO), The Children's Place, Inc. (PLCE), Lulu's Fashion Lounge Holdings, Inc. (LVLU), Torrid Holdings Inc. (CURV), Lands' End, Inc. (LE), Destination XL Group, Inc. (DXLG), Duluth Holdings Inc. (DLTH), Urban Outfitters, Inc. (URBN), The RealReal, Inc. (REAL), thredUP Inc. (TDUP), Farfetch Limited (FTCH)
https://finance.yahoo.com/m/5e5a2c12-ca0d-316c-b1cb-dc9b1378d917/rent-the-runway-lays-off-10.html
https://finance.yahoo.com/news/7-tech-stocks-destined-nvidia-223659763.html
https://finance.yahoo.com/m/6530bae4-a3af-3efb-b27f-242642b9e337/renting-clothes-was-supposed.html
https://finance.yahoo.com/news/calculating-intrinsic-value-rent-runway-105514454.html
https://finance.yahoo.com/news/rent-runway-inc-rent-upgraded-170006826.html
https://www.sec.gov/Archives/edgar/data/1468327/000146832723000341/wdq-20231031.htm
Copyright © 2024 Tiny Computers (email@tinycomputers.io)
Report ID: FLpGNPXd
Cost: $0.62031
https://reports.tinycomputers.io/RENT/RENT-2024-02-01.html Home