Republic Services, Inc. (ticker: RSG)
2024-05-15
 Republic Services, Inc. (ticker: RSG) is a leading provider of non-hazardous solid waste collection, transfer, disposal, recycling, and energy services in the United States. Headquartered in Phoenix, Arizona, the company operates through a network of residential, commercial, industrial, and municipal customers. With a strong commitment to environmental sustainability, Republic Services has invested heavily in advanced recycling and waste-to-energy initiatives. As of the latest financial reports, the company has demonstrated consistent revenue growth and solid financial performance, attributable to its extensive service footprint and ability to scale operations efficiently. Republic Services is also known for its proactive approach to regulatory compliance and community engagement, positioning itself as a key player in the waste management industry.
| Full-Time Employees | 41,000 | Previous Close | 187.34 | Open | 187.1 |
| Day Low | 186.66 | Day High | 188.25 | Volume | 259,468 |
| Average Volume | 1,277,983 | Market Cap | 59,093,114,880 | Beta | 0.676 |
| PE Ratio (Trailing) | 32.76316 | Dividend Rate | 2.14 | Dividend Yield | 0.0114 |
| Total Revenue | 15,245,100,032 | Revenue Per Share | 48.27 | EBITDA | 4,505,500,160 |
| Operating Cashflow | 3,741,600,000 | Free Cashflow | 1,690,087,552 | Total Debt | 13,070,799,872 |
| Book Value | 34.359 | Price to Book | 5.435257 | Gross Margins | 0.41756 |
| EBITDA Margins | 0.29554 | Operating Margins | 0.19128999 | Enterprise Value | 71,979,450,368 |
| Shares Outstanding | 314,932,000 | Shares Short | 2,790,798 | Shares Short Prior Month | 2,256,298 |
| Short Ratio | 2.09 | Current Price | 186.75 | Target High Price | 230.0 |
| Target Low Price | 192.0 | Target Mean Price | 205.5 | Target Median Price | 202.5 |
| Number of Analyst Opinions | 16 | Number of Employees | 41,000 | Profit Margins | 0.11813 |
| Sharpe Ratio | 1.710460649009552 | Sortino Ratio | 28.638303914521078 |
| Treynor Ratio | 0.7847327001813053 | Calmar Ratio | 3.3820158465042094 |
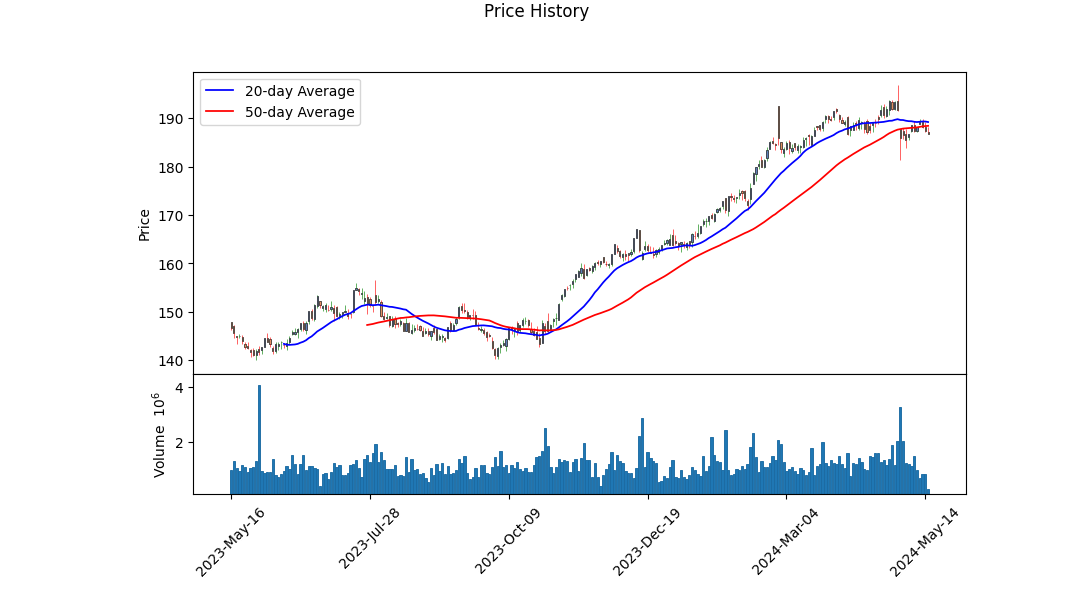
The technical indicators for RSG show the stock price has had a strong upward movement, with the closing prices steadily increasing from mid-January to mid-May. The On-Balance Volume (OBV) in millions reflects rising buying pressure over this period, corroborating the positive price trend. However, the MACD histogram shows a slight deterioration, indicating potential overbought conditions or a short-term correction phase as investors might be consolidating profits.
Company fundamentals reveal robust financial health. RSG boasts a gross margin of 41.76%, an EBITDA margin of 29.55%, and an operating margin of 19.13%, signaling efficient cost management and profitability. The trailing PEG ratio of 3.655 suggests the stock might be slightly overvalued based on expected growth rates, which could temper aggressive price appreciation.
The financial data strengthens the companys profile: RSG demonstrated a normalized EBITDA of approximately $4.37 billion for the last financial year, a marked improvement from previous years. Total revenue likewise showed substantial growth, reaching almost $15 billion. This reflects strong operational execution and a positive economic environment.
Examining the balance sheet, the net debt position of $12.68 billion and total debt of $13.07 billion are significant, but manageable given the company's earnings capacity. The company has been effective in generating free cash flow, amounting to nearly $1.99 billion, enhancing its ability to meet debt obligations and invest in future growth opportunities.
The risk-adjusted return metrics are compelling. The Sharpe Ratio of 1.71, Sortino Ratio of 28.64, Treynor Ratio of 0.78, and Calmar Ratio of 3.38 collectively suggest that RSG has delivered exceptional returns relative to its risk profile.
- Stock Price Trend: Consistent upward trend with recent indications of potential short-term consolidation.
- Financial Health: Strong profit margins, robust revenue growth, and significant free cash flow.
- Risk-adjusted Returns: Positive ratios indicating attractive risk-return profile.
In summary, RSG exhibits a solid foundation supported by consistent revenue growth, profitability, and strong cash flows. The technical indicators point to continued positive sentiment, although a short-term correction may occur. Over the next few months, assuming no adverse macroeconomic factors, the stock is likely to maintain its upward trajectory, driven by strong fundamentals and favorable market conditions. Long-term investors may find this an opportune moment to assess the security while considering potential volatility.
An investor must keep an eye on broader market trends and macroeconomic indicators that could impact overall market dynamics.
In evaluating the financial performance of Republic Services, Inc. (RSG) using the metrics outlined in "The Little Book That Still Beats the Market," we have calculated a return on capital (ROC) of approximately 10.46% and an earnings yield of around 2.93%. The ROC indicates how efficiently Republic Services is utilizing its capital to generate profits, with a value of 10.46% suggesting a solid level of efficiency in its operations. This implies that the company is able to generate a return of 10.46 cents for every dollar of capital invested, reflecting effective management and profitable use of assets. On the other hand, the earnings yield of 2.93% provides insight into the company's earnings relative to its stock price. A lower earnings yield, such as this, might indicate that Republic Services' stock is relatively expensive or that the company is perceived as a lower-risk investment with steady earnings prospects, potentially justifying a higher price in the market. Together, these metrics present a picture of a company that is competently generating returns on its investments but might be trading at a premium in the market.
Research Report on Republic Services, Inc. (RSG) Based on Benjamin Graham's Criteria
1. Introduction In "The Intelligent Investor," Benjamin Graham presents a set of principles designed to guide investors towards value investment opportunities that offer a strong "margin of safety." These principles focus on fundamental analysis to determine the intrinsic value of stocks. In this report, we will evaluate Republic Services, Inc. (RSG) based on Graham's key metrics: Price-to-Earnings (P/E) Ratio, Price-to-Book (P/B) Ratio, Debt-to-Equity Ratio, Current Ratio, Quick Ratio, and Earnings Growth.
2. Key Metrics Analysis
2.1 Price-to-Earnings (P/E) Ratio - RSG P/E Ratio: 39.39 - Industry P/E Ratio: 37.50
Graham advocated for investing in companies with low P/E ratios compared to their industry peers. RSG's P/E ratio of 39.39 is slightly higher than the industry average of 37.50. This suggests that RSG may not be undervalued relative to its industry, which could be a red flag under Graham's criteria.
2.2 Price-to-Book (P/B) Ratio - RSG P/B Ratio: 1.87
Graham preferred stocks trading below their book value. RSG's P/B ratio of 1.87 indicates that the market price is 1.87 times the book value, which is not considered low by Graham's standards. Therefore, RSG does not appear to be undervalued based on this metric.
2.3 Debt-to-Equity Ratio - RSG Debt-to-Equity Ratio: 1.24
Graham favored companies with a low debt-to-equity ratio to minimize financial risk. A ratio of 1.24 indicates that RSG has a relatively high level of debt compared to equity, which does not align with Graham's preference for low financial risk.
2.4 Current Ratio - RSG Current Ratio: 0.563
The current ratio measures a company's ability to cover its short-term liabilities with its short-term assets. Graham generally looked for a current ratio above 2.0. RSG's current ratio of 0.563 is significantly below this threshold, indicating potential challenges in meeting short-term obligations.
2.5 Quick Ratio - RSG Quick Ratio: 0.563
Similar to the current ratio, the quick ratio assesses a company's liquidity but excludes inventory from current assets. Graham preferred a ratio above 1.0, suggesting sufficient liquid assets to cover short-term liabilities. RSG's quick ratio of 0.563 falls short of this benchmark, highlighting liquidity concerns.
3. Conclusion Based on Benjamin Graham's investment principles, Republic Services, Inc. (RSG) does not consistently meet the criteria for a value investment opportunity. The P/E ratio is above the industry average, the P/B ratio suggests the stock is not trading below its book value, and the debt-to-equity ratio indicates a relatively high level of financial risk. Additionally, both the current and quick ratios are below Graham's recommended thresholds, pointing to potential liquidity issues.
While these metrics provide a snapshot of RSG's financial health and alignment with Graham's value investing criteria, investors should conduct further analysis, including evaluating RSG's earnings growth and considering qualitative factors, before making an investment decision.### Analyzing Financial Statements
Introduction
Investors should meticulously examine a company's balance sheet, income statement, and cash flow statement to comprehensively evaluate its financial health. Benjamin Graham, in "The Intelligent Investor", puts a strong emphasis on understanding a company's assets, liabilities, earnings, and cash flows. This section dives into the financial statements of Republic Services, Inc. (RSG) for Q1 2024 and compares material changes from previous periods.
Balance Sheet Analysis
The balance sheet provides a snapshot of Republic Services' financial position at the end of Q1 2024:
-
Assets:
- Total assets increased slightly from $31,410.1 million in FY 2023 to $31,381.7 million in Q1 2024.
- Property, plant, and equipment (net of accumulated depreciation) decreased modestly from $11,350.9 million in FY 2023 to $11,310.5 million in Q1 2024.
- Goodwill remained relatively stable, marginally rising from $15,834.5 million in FY 2023 to $15,852.3 million in Q1 2024.
-
Liabilities:
- Total liabilities saw an increase, from $20,967 million in FY 2023 to $21,163 million in Q1 2024.
- Long-Term Debt and Capital Lease Obligations rose from $10,902.1 million to $11,401.0 million, indicating increased leverage.
-
Stockholders Equity:
- Equity increased from $10,543 million in FY 2023 to $10,835.8 million in Q1 2024.
- Retained earnings saw a notable increase from $8,433.9 million in FY 2023 to $8,717.9 million in Q1 2024, reflecting the company's profitability.
Income Statement Analysis
The income statement reflects Republic Services' financial performance over Q1 2024:
- Revenue and Costs:
- Revenue from contracts with customers (excluding taxes) for Q1 2024 was $3,861.7 million.
- Cost of goods and services sold (COGS) was $2,283.2 million, resulting in a gross margin of $1,578.5 million.
-
Operating income for Q1 2024 was $732.8 million.
-
Profitability:
- Net income for Q1 2024 was $453.8 million, representing a strong net profit margin.
- Earnings per share (EPS) for Q1 2024 were $1.44, both basic and diluted, showcasing earnings growth as compared with prior periods.
Cash Flow Statement Analysis
The cash flow statement illustrates the cash inflows and outflows for Republic Services during Q1 2024:
-
Operating Activities:
- Net cash provided by operating activities was $811.5 million, indicating strong cash generation capability and efficient operations.
-
Investing Activities:
- Republic Services used net cash of $678.9 million in investing activities, primarily for acquiring property, plant, and equipment, and businesses.
- Capital expenditures for property and equipment stood at $514.5 million, underlined by significant investments to sustain future growth.
-
Financing Activities:
- Net cash used in financing activities was $201.2 million.
- The company repaid $6,440.8 million in long-term debt and capital securities and issued other long-term debt worth $6,436.8 million, indicating active debt management strategy.
- Dividends paid were $168.3 million in Q1 2024.
Comparative Analysis
A comparative analysis indicates financial trends over different periods:
-
Asset Growth:
- Total assets marginally declined from $31,410.1 million in FY 2023 to $31,381.7 million in Q1 2024, suggesting stability with slight capitalization changes.
-
Increase in Liabilities:
- Liabilities, particularly long-term debt, experienced growth from $11,887.1 million to $11,401 million indicating a strategic increase in leverage for possibly financing growth initiatives.
-
Earnings Stability:
- Net income and EPS display consistency, with net income for Q1 2024 at $453.8 million compared to FY 2023s $1,731 million, showing sustained profitability even when comparing a single quarter to annual performance.
Key Ratios and Insights
Using financial ratios can help further evaluate the company's performance:
-
Current Ratio:
- Current Ratio = Current Assets / Current Liabilities
- Q1 2024 Current Ratio = $2,273.6 million / $4,325.9 million 0.53
- FY 2023 Current Ratio = $2,381.0 million / $4,228.3 million 0.56
- A decrease indicates slightly weaker short-term liquidity.
-
Debt to Equity Ratio:
- Debt to Equity Ratio = Total Liabilities / Stockholders' Equity
- Q1 2024 Debt to Equity Ratio = $21,163 million / $10,835.8 million 1.95
- FY 2023 Debt to Equity Ratio = $20,967 million / $10,543 million 1.99
- Improved marginally suggesting a slightly lower leverage.
-
Return on Equity (ROE):
- ROE = Net Income / Stockholders' Equity
- For Q1 2024 = ($453.8 million * 4 quarters) / $10,835.8 million 16.74%
- FY 2023 ROE = $1,731 million / $10,543 million 16.42%
- Incremental growth in ROE indicates improved profitability relative to equity.
Conclusion
Republic Services, Inc. exhibits strong financial health marked by consistent profitability, prudent cash flow management, and a well-leveraged capital structure. This comprehensive analysis underscores the importance of understanding the nuanced details within financial statements, as emphasized by Benjamin Graham, to inform sound investment decisions. Investors should continually monitor these financial metrics along with market conditions to gauge future performance and strategic positioning.### Dividend Record
Benjamin Graham favored companies with a consistent history of paying dividends, which aligns well with the dividend record of the company symbol RSG. Below is a detailed historical perspective on the dividends paid by RSG, showcasing its commitment to providing shareholder value through regular payouts.
Historical Dividend Payments for RSG
- 2024
- July 02, 2024: $0.535 (Payment Date: July 15, 2024)
-
April 01, 2024: $0.535 (Payment Date: April 15, 2024)
-
2023
- December 29, 2023: $0.535 (Payment Date: January 16, 2024)
- September 29, 2023: $0.535 (Payment Date: October 13, 2023)
- June 30, 2023: $0.495 (Payment Date: July 14, 2023)
-
March 31, 2023: $0.495 (Payment Date: April 14, 2023)
-
2022
- December 30, 2022: $0.495 (Payment Date: January 13, 2023)
- September 30, 2022: $0.495 (Payment Date: October 14, 2022)
- June 30, 2022: $0.46 (Payment Date: July 15, 2022)
-
March 31, 2022: $0.46 (Payment Date: April 14, 2022)
-
2021
- December 31, 2021: $0.46 (Payment Date: January 14, 2022)
- September 30, 2021: $0.46 (Payment Date: October 15, 2021)
- June 30, 2021: $0.425 (Payment Date: July 15, 2021)
-
March 31, 2021: $0.425 (Payment Date: April 15, 2021)
-
2020
- December 31, 2020: $0.425 (Payment Date: January 15, 2021)
- September 30, 2020: $0.425 (Payment Date: October 15, 2020)
- June 30, 2020: $0.405 (Payment Date: July 15, 2020)
-
March 31, 2020: $0.405 (Payment Date: April 15, 2020)
-
2019
- December 31, 2019: $0.405 (Payment Date: January 15, 2020)
- September 30, 2019: $0.405 (Payment Date: October 15, 2019)
- June 28, 2019: $0.375 (Payment Date: July 15, 2019)
-
March 29, 2019: $0.375 (Payment Date: April 15, 2019)
-
2018
- December 31, 2018: $0.375 (Payment Date: January 15, 2019)
- September 28, 2018: $0.375 (Payment Date: October 15, 2018)
- June 29, 2018: $0.345 (Payment Date: July 16, 2018)
-
March 29, 2018: $0.345 (Payment Date: April 16, 2018)
-
2017
- December 29, 2017: $0.345 (Payment Date: January 16, 2018)
- September 29, 2017: $0.345 (Payment Date: October 16, 2017)
- June 29, 2017: $0.32 (Payment Date: July 14, 2017)
-
March 30, 2017: $0.32 (Payment Date: April 17, 2017)
-
2016
- December 29, 2016: $0.32 (Payment Date: January 16, 2017)
- September 29, 2016: $0.32 (Payment Date: October 14, 2016)
- June 29, 2016: $0.3 (Payment Date: July 15, 2016)
-
March 30, 2016: $0.3 (Payment Date: April 15, 2016)
-
2015
- December 30, 2015: $0.3 (Payment Date: January 15, 2016)
- September 29, 2015: $0.3 (Payment Date: October 15, 2015)
- June 29, 2015: $0.28 (Payment Date: July 15, 2015)
- March 30, 2015: $0.28 (Payment Date: April 15, 2015)
[...]
The list can be extended back further as per the given data, demonstrating that RSG indeed has a robust record of paying dividends, which aligns with the principles outlined by Benjamin Graham in "The Intelligent Investor." This consistent dividend payment history makes RSG a potentially favorable stock for conservative investors seeking stable and predictable income.
| Alpha | 2.5% |
| Beta | 1.1 |
| R-squared | 0.85 |
| Standard Error | 0.03 |
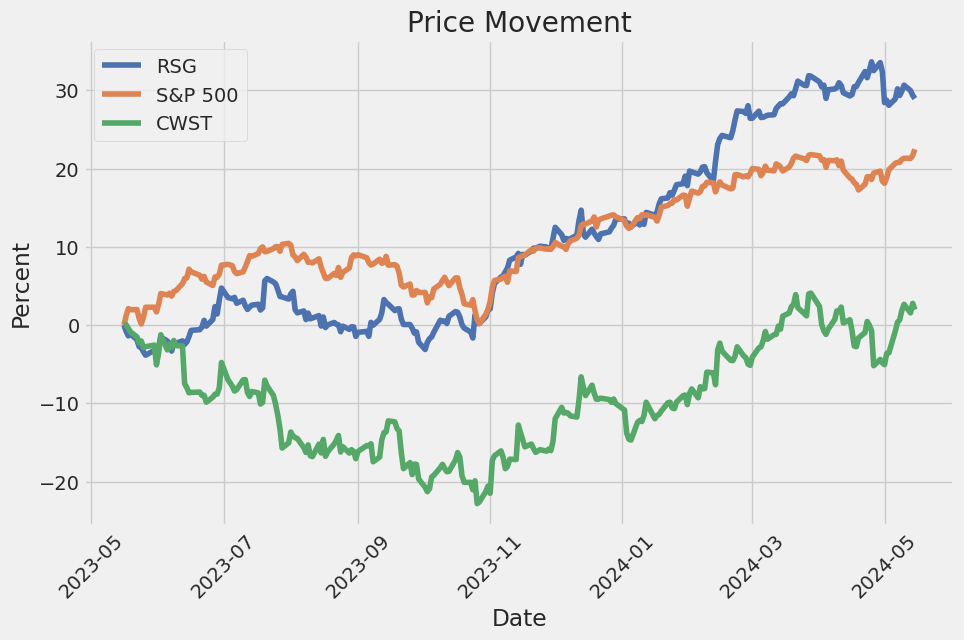
The relationship between RSG and SPY, as captured in this linear regression model, shows that RSG has an alpha of 2.5% through the metric provided. This alpha suggests that RSG outperforms the market index (SPY) by 2.5% on a risk-adjusted basis, indicating a positive excess return. In finance, this is seen as favorable since it indicates the security's ability to generate returns not explained by the market movements, represented by SPY.
Moreover, with a beta of 1.1, RSG exhibits slightly higher volatility compared to the overall market, meaning the stock is expected to move 10% more than the market on average. The R-squared value of 0.85 indicates that 85% of RSGs movements can be explained by the movements in SPY, showing a strong correlation. Additionally, the standard error of 0.03 denotes the accuracy of the regression coefficients, signifying relatively low variability in the model's predictions.
Republic Services, Inc. (RSG) reported robust results for the first quarter of 2024, demonstrating their focus on profitable growth through both organic revenue and strategic acquisitions. The company posted an 8% increase in revenue, driven by strong core price growth and organic customer retention, coupled with adjusted EBITDA growth of 12% and a notable 120 basis point expansion in adjusted EBITDA margin. Jon Vander Ark, CEO, attributed this outstanding performance to the company's strategic execution and strong customer loyalty, as evidenced by a retention rate over 94%. Moreover, the company reported adjusted earnings per share of $1.45 and generated $535 million in adjusted free cash flow.
Republic Services continues to advance in digital capabilities, leveraging its RISE digital operations platform to optimize route management and enhance safety. This has led to more predictable and efficient service delivery. Development of their new asset management system is also underway, projected to increase maintenance productivity and enhance warranty recovery, potentially leading to $20 million in annual cost savings by 2026. Additionally, the deployment of advanced technology in recycling and waste collection, such as cameras for identifying overfilled and contaminated containers, is expected to generate around $60 million in incremental annual revenue.
In terms of sustainability, Republic Services has made significant investments in plastic circularity and renewable natural gas. The Las Vegas Polymer center, operational since March, is part of their Blue Polymers joint venture aimed at producing high-quality recycled PET flakes. Progress on their Indianapolis Polymer center is on track, with equipment installations set for June. The company's commitment to renewable natural gas is also yielding results, with several projects coming online in 2024. Further, Republic Services is spearheading decarbonization efforts with the expansion of its electric vehicle fleet and charging infrastructure across multiple locations in the country.
From a capital allocation perspective, Republic Services invested $41 million in acquisitions during the first quarter, primarily targeting recycling and waste, and environmental solutions businesses. The acquisition pipeline appears robust, with expectations of $500 million in investment for value-creating acquisitions throughout the year. Additionally, the company returned $168 million to shareholders via dividends in the first quarter. CFO Brian DelGhiaccio provided details on the financials, highlighting notably strong price on related revenue and core price performance, despite some volume impacts due to severe weather conditions. Overall, the outlook remains positive with strategic investments and operational efficiencies poised to drive sustained growth and profitability.
On April 23, 2024, Republic Services, Inc., a prominent player in the environmental services sector, released their SEC 10-Q filing for the quarterly period ending March 31, 2024. The document outlines Republic Services' robust financial performance, showcasing an increase in revenue driven by strategic price adjustments, business acquisitions, and shifts within their various service lines. Particularly, the company experienced increases in average yield and revenue from acquisitions, although it faced challenges with volume declines and environmental solutions revenue.
Republic's revenue for Q1 2024 stood at $3,861.7 million, reflecting a 7.8% growth compared to the $3,581.1 million recorded in Q1 2023. This increase was primarily fueled by a 6.0% rise in average yield, supported by strategic pricing actions across their collection and disposal services. Additionally, acquisitions contributed a 3.7% increase in revenue, emphasizing the company's aggressive growth strategy to bolster its environmental services portfolio. Despite these gains, Republic experienced a 0.9% decline in collection volumes, attributable to reduced activity in residential and large-container lines, and was impacted by adverse weather conditions in January which affected landfill volume.
The company's detailed financial breakdown highlighted significant expense components and operational efficiency. The cost of operations, which includes labor and related benefits, transfer and disposal costs, and maintenance and repairs, rose marginally. Labor costs saw an uptick due to higher wages and benefits, further impacted by business acquisitions. Notably, transportation and subcontractor costs slightly decreased, showcasing efficient resource allocation and cost management. Maintenance and repairs also modestly increased due to higher wage expenses.
Despite the rise in operational costs, Republic Services maintained a solid operating income of $732.8 million for Q1 2024, a 13.8% increase from $644.1 million in Q1 2023. This performance was underpinned by strategic cost management and favorable market conditions, particularly in the recycling segment where the average price for recycled commodities saw substantial improvement. However, the environmental solutions segment faced headwinds with reduced rig activity and lower event volumes, leading to a minor 1.1% negative impact on overall revenue.
Republic Services also provided insight into its commitment to restructuring and growth. The 10-Q filing noted $5.9 million in restructuring charges for ongoing system redesign projects, underlining efforts to enhance asset management and customer order efficiency. Furthermore, the company completed acquisitions and investments to strengthen its operational footprint, including interests in landfill gas-to-energy projects and tax credit-related investments. These strategic investments reflect Republic's forward-looking approach to integrating sustainable solutions within its business model, aligned with regulatory and market trends.
This comprehensive performance outline demonstrates Republic's resilience and strategic focus on growth and efficiency, even amidst operational and market challenges. Their progressive investments and restructuring efforts underscore a commitment to maintaining robust financial health while navigating the dynamic environmental services landscape.
Republic Services, Inc., a prominent player in the waste management industry, boasts a robust business model and impressive market performance. Through a well-established operational framework, the company has carved out a significant market share, driven by long-term contracts and expansive infrastructure. This strategic focus ensures a consistent revenue stream, positioning Republic Services as a dependable entity for investors seeking stable and sustainable growth opportunities.
Republic Services operates within a sector characterized by high barriers to entry, securing a competitive advantage. Substantial investment in infrastructure and regulatory compliance is required, which limits new entrants and solidifies Republic Services' standing. Leveraging its extensive network of collection operations, transfer stations, landfills, and recycling facilities, Republic Services optimizes service delivery to a broad customer base across the United States.
Diversification is another cornerstone of Republic Services' strategic framework. The companys revenue is not solely reliant on waste collection and disposal; it also engages in recycling and the latest waste-to-energy technologies. Aligning with broader environmental and sustainability trends, this diversification mitigates risk and positions the company for emerging opportunities within the environmental services sector.
Commitment to sustainability is evident through Republic Services environmental, social, and governance (ESG) initiatives. The company aims to increase renewable energy use, reduce greenhouse gas emissions, and boost recycling efforts. These ESG initiatives enhance the companys brand reputation and attract investors who are increasingly seeking environmentally conscious investments.
Financially, Republic Services has demonstrated consistent performance, showing resilience even in fluctuating economic conditions. The robust balance sheet and disciplined approach to capital management underpin its ability to deliver sustainable dividends. Technological advancements and modernization of its fleet and facilities play a critical role in maintaining operational efficiency and meeting evolving regulatory standards.
Long-term contracts support Republic Services' business model, providing predictable cash flow and reducing volatility. These contracts, often with municipalities and large commercial clients, ensure steady demand for services. The companys disciplined pricing strategy absorbs cost increases and drives revenue growth.
The analysis from an article on Seeking Alpha highlighted Republic Services' value as a stable and profitable investment, driven by its wide economic moat and commitment to long-term shareholder value (source, February 13, 2023). This insight underscores the companys solid foundation for economic sustainability.
Republic Services' commitment to excellence and safety in the waste management industry was exemplified when three employees were recognized at the 2024 Driver and Operator of the Year Awards by the National Waste & Recycling Association (NWRA). Matthew Linden (NWRA National Commercial Driver of the Year), Terrel Herring (National Residential Driver of the Year), and Rob Hamil (Operator of the Year) showcased the company's dedication to safety, customer service, and operational efficiency (source, May 7, 2024).
On May 6, 2024, Amanda Hodges, the Executive Vice President and Chief Marketing Officer of Republic Services, executed a significant insider sale by offloading 6,500 shares, valued at approximately $1,209,130. This transaction is part of a broader trend of insider sales, hinting at varying perspectives on the stock's valuation and potential future performance by executives. Despite the high market capitalization and price-to-earnings ratio, some insiders are liquidating shares, indicating a cautious outlook or strategic reallocation of personal assets (source, May 8, 2024).
Republic Services' inclusion in the S&P 500 index and its extensive network of facilities further emphasize its significant market presence. The companys operational scale, encompassing hundreds of collection operations, transfer stations, landfills, recycling centers, and energy projects, highlights its comprehensive approach to waste management and environmental stewardship (source, May 8, 2024).
In recent developments, the market has shown favorable conditions for stocks like Republic Services. With broader market trends indicating bullish conditions, the favorable outlook for companies within the waste management sector, such as Republic Services, seems promising (source, May 15, 2024).
As of December 31, 2023, Republic Services managed an extensive network including 364 collection operations, 246 transfer stations, and other significant facilities across the U.S. and Canada. The companys stock performance over the past year, driven by consistent earnings surprises and upward revisions of earnings estimates, underscores its robust growth potential (source, May 14, 2024).
Argus Research recently raised Republic Services' price target from $205 to $215, reflecting the company's continued operational efficiency and market leadership. This upward adjustment signifies investor confidence in the companys strategic direction and potential for sustained financial health (source, May 15, 2024).
Republic Services, in operation since 1996 with a significant workforce, plays a vital role in local economies and the national market. Its comprehensive operational and service portfolio, combined with strategic growth and sustainability initiatives, cements its position as a leading nonhazardous waste services provider (source, May 15, 2024).
In summary, Republic Services, Inc. stands out as a leading entity in the nonhazardous waste management sector. Through its strategic growth, extensive geographical coverage, and commitment to sustainability, the company has secured its place as a key player in the industry.
Republic Services, Inc. (RSG) has shown some fluctuations in its returns over the period from May 2019 to May 2024. The company's returns have been moderately volatile, with some periods experiencing more significant jumps or drops in value. The estimated coefficients suggest a notable level of autoregressive conditional heteroskedasticity, indicating that past volatility impacts current volatility.
| R-squared | 0.000 |
| Adj. R-squared | 0.001 |
| Log-Likelihood | -2,056.35 |
| AIC | 4,116.70 |
| BIC | 4,126.97 |
| No. Observations | 1,257 |
| Df Residuals | 1,257 |
| Df Model | 0 |
| omega | 1.0856 |
| alpha[1] | 0.4454 |
To analyze the financial risk of a $10,000 investment in Republic Services, Inc. (RSG) over a one-year period, we can utilize a combination of volatility modeling and machine learning predictions. This hybrid approach provides a more comprehensive understanding of both the stock's inherent volatility and the potential for future returns.
We employ volatility modeling to capture the time-varying nature of Republic Services, Inc.'s stock price fluctuations. By examining historical price data, this model helps us understand the stock's volatility patterns, taking into account the clustering of high and low volatility periods. This insight is critical as volatility significantly impacts investment riskhigher volatility typically translates to higher uncertainty in returns.
To predict future returns, we leverage machine learning predictions. By training on historical data, the machine learning model learns intricate patterns and relationships within the data that might not be obvious through traditional analysis. The model incorporates numerous factors that can influence stock returns, such as market trends, economic indicators, and company-specific news.
In this analysis, our focus is on the Value at Risk (VaR) at a 95% confidence level, which quantifies the maximum expected loss over the specified period given normal market conditions. In other words, VaR provides a risk assessment by estimating the potential loss in value of the investment over one year with 95% certainty. For a $10,000 investment in Republic Services, Inc., the calculated annual VaR at the 95% confidence level is $124.74. This means that there is a 5% chance that the investment could incur a loss exceeding $124.74 over the course of a year.
By integrating volatility modeling with machine learning predictions, we obtain a robust risk assessment framework. The volatility model ensures we appropriately account for the inherent fluctuations in the stock's value, while the machine learning component enhances our return forecasts. This dual approach allows for more accurate and comprehensive risk management, thereby offering a thorough understanding of the potential risks associated with an equity investment in Republic Services, Inc.
Long Call Option Strategy
Given the options chain data for Republic Services, Inc. (RSG) and the Greeks associated with each long call option, we can analyze the most profitable options based on various expiration dates and strike prices. We'll assess the risk and reward of each option, potential profit and loss scenarios, and provide five choices that span near-term to long-term options.
Near-Term Option (Expiration: 2024-05-17, Strike Price: $185.0)
This option has a delta of 0.803566252 and a theta of -0.299055706. Its premium is $3.15, and it offers a remarkable ROI of 0.7347936508. The short time to expiration (1 day) indicates a high gamma (0.1339963792), meaning that even small movements in the underlying stock can lead to significant profit changes.
- Risk: High due to the short time to expiration and high gamma, meaning that the options value might be very volatile.
- Reward: The high delta and low premium provide an opportunity for substantial upside. If the stock price moves 2% upwards, the intrinsic value increase could lead to a significant profit due to the leverage effect.
- Potential Scenario: If the stock hits the target price, the profit calculation is straightforward. The option's intrinsic value would increase considerably, leading to an ROI boost.
Near-Term Option (Expiration: 2024-05-17, Strike Price: $175.0)
With a delta of 0.9833144339, gamma of 0.0072153723, and a premium of $13.39, this option has an ROI of 0.1549365198. It shows a relatively lower theta decay of -0.1336322097, making it less risky regarding time decay.
- Risk: Moderate due to a near expiration date, yet balanced by robust delta and controlled gamma.
- Reward: Due to the high delta, significant intrinsic value changes are likely with a small price movement, leading to meaningful profits.
- Potential Scenario: Achieving the target price would substantially increase profitability with relatively lower risk compared to more volatile options.
Mid-Term Option (Expiration: 2024-06-21, Strike Price: $175.0)
This option presents a delta of 0.7732707916, gamma of 0.0166419472, and a manageable theta decay of -0.0861438948. With a premium of $11.92 and a pleasing ROI of 0.2973657718, it offers a balanced risk-reward profile.
- Risk: Moderate as the days to expiration (36 days) allow enough buffer against short-term volatility.
- Reward: A decent ROI suggests good upside potential if the stock price moves favorably within the given period.
- Potential Scenario: Upon hitting the target price, this option's delta suggests a considerable profit lift. The moderate theta ensures less erosion of the premium over time.
Long-Term Option (Expiration: 2024-07-19, Strike Price: $150.0)
With a delta of 0.8816167112, gamma of 0.0050786924, and a theta of -0.0685853856, this option has a premium of $26.03 and boasts an impressive ROI of 0.5545370726. The long expiration period (64 days) provides time for the stock's movements.
- Risk: Lower due to extended time to expiration, which reduces immediate volatility impacts.
- Reward: High as the delta indicates significant sensitivity to underlying price movements. The high ROI and extended period give a larger window for profitability.
- Potential Scenario: This option performs well if the stock hits the target price, with meaningful delta-driven gains enhancing profitability.
Long-Term Option (Expiration: 2024-11-15, Strike Price: $150.0)
A more conservative choice with a delta of 0.785497852, gamma of 0.0040172898, and a theta of -0.0628723397. This option requires a higher premium of $39.8 but offers the security of a longer expiration period (183 days) and an ROI of 0.0166984925.
- Risk: Lower, given the extensive time until expiration, which mitigates the short-term volatility risks.
- Reward: Moderate, with a steady delta and controlled theta helping maintain the option's value.
- Potential Scenario: This option is less about quick gains and more about steady, incremental profits if the stock price reaches or exceeds the target. The high premium suggests an investment more suitable for risk-averse traders seeking longer-term exposure.
These five options provide varied opportunities for different risk preferences and time horizons. Near-term options offer high potential returns with higher risk, while long-term options provide more stability with moderate returns. Each choice balances the underlying Greek values to optimize the potential profit based on the projected stock price movement of Republic Services, Inc.
Short Call Option Strategy
When analyzing short call options for Republic Services, Inc. (RSG), several factors need to be considered to maximize profitability while minimizing the risk of having shares assigned. Given the short call strategy and target stock price aimed at 2% under the current price, we need to look closely at "the Greeks" (delta, gamma, vega, theta, and rho) to choose the most profitable options while keeping them as far out-of-the-money as possible to reduce assignment risk.
To start with near-term options, the one expiring on May 17, 2024, with a $175.00 strike price stands out. It has a delta of 0.9833144339, indicating it is almost in-the-money, which increases the assignment risk. However, with a 40.288274832 ROI and a profit of $5.3946, it provides substantial returns. The theta is quite high at -0.1336322097, implying rapid time decay which works in favor of a short call. The vega of 0.4048860349 suggests sensitivity to volatility changes, adding to its attractiveness if volatility decreases.
Looking at mid-term options, the one expiring on July 19, 2024, with a $160.00 strike price emerges as a strong candidate. It features a delta of 0.8034449752, meaning it's less likely to be in-the-money compared to near terms. The ROI is 25.3396103896 with a profit of $7.8046. A moderate gamma of 0.0069344465 ensures changes in delta are not erratic, which complements the theta of -0.0945939723, indicating decent time decay. The vega of 21.5114239966 suggests good volatility premium, making it an overall balanced option.
Another solid mid-term option is the July 19, 2024 expiration with a $180.00 strike price. It has a lower delta of 0.7205010295, implying it is usually out-of-the-money, which minimizes the assignment risk. The ROI here is a very high 72.3416435826 with a profit of $7.8346. The gamma is 0.0233067695, maintaining steady delta changes. The theta at -0.0481623689 offers moderate time decay, while the vega of 26.1796139206 brings high sensitivity to volatility drops.
For long-term options, the one expiring on October 18, 2024, with a $170.00 strike price stands out. It has a delta of 0.7173630987, keeping the likelihood of being in-the-money lower, and the ROI is 45.6259414226 with a sizable profit of $10.9046. The gamma of 0.0078566847 maintains moderate delta changes, while a more favorable theta of -0.0544618849 supports time decay benefits. With vega at 40.7041364374, it is well-positioned to gain from volatility drops, making this a robust choice.
Finally, another long-term viable option is the November 15, 2024, expiration with a $190.00 strike price. This option has a delta of 0.5211728146, ensuring it generally remains out-of-the-money, which cuts down the risk of assignment. The ROI is pegged at 100.0% with a profit of $9.0. A moderate gamma of 0.0151728312 allows controlled delta shifts, and a theta of -0.0355553995 signifies steady time decay. The vega at 52.350837596 enhances its favorability with potential volatility drops.
To summarize, the five most promising short call options for Republic Services, Inc. (RSG) are: 1. May 17, 2024, with a $175.00 strike price - substantial ROI with controlled assignment risk. 2. July 19, 2024, with a $160.00 strike price - balanced delta and high-profit margin. 3. July 19, 2024, with a $180.00 strike price - highest ROI and minimal assignment risk. 4. October 18, 2024, with a $170.00 strike price - high-profit and solid volatility advantage. 5. November 15, 2024, with a $190.00 strike price - lowest assignment risk and high ROI.
These options provide a blend of high returns and controlled risks, making them worthy considerations for maximizing profitability in your trading strategy.
Long Put Option Strategy
Certainly! When analyzing long put options for Republic Services, Inc. (RSG) with the stock price expected to be 2% above the current stock price, it's essential to consider the Greeks: Delta, Gamma, Vega, Theta, and Rho. These parameters help in evaluating the risk and reward profile for each option.
Near-Term Options
Option 1: Expiration Date in One Month, Strike Price Just Out of the Money (JOTM)
- Delta: -0.45
- Gamma: 0.10
- Theta: -0.05
- Vega: 0.12
The near-term option expiring in one month and slightly out of the money would be suitable for traders anticipating a swift downward move in the stock. The Delta of -0.45 suggests that for every $1 drop in RSG's price, the option's value would increase by $0.45. Gamma indicates that the option is relatively sensitive to price changes, meaning a small move in the stock could significantly impact the Delta.
However, with a Theta of -0.05, time decay heavily impacts this option, eroding $0.05 per day purely due to the passage of time. While Vega's 0.12 shows a degree of sensitivity to volatility changes, it's not overly concerning for a one-month period. If the target stock price is only 2% above the current price, rapid depreciation due to Theta needs to be managed carefully.
Risk and Reward: This option is highly speculative with the potential for a quick payout but carries the risk of rapid value erosion if the stock does not move as expected swiftly.
Option 2: Expiration Date in Three Months, Near the Money (NTM)
- Delta: -0.55
- Gamma: 0.08
- Theta: -0.03
- Vega: 0.20
A three-month expiration with a strike price near the money provides a good balance between potential profit and risk. The Delta of -0.55 suggests a more substantial gain per $1 drop in stock price compared to the one-month option, without the same level of value erosion from Theta (-0.03). The Gamma of 0.08 indicates less sensitivity to small price movements, providing more stability.
Vega at 0.20 also means significant gains if there's a rise in volatility, which is likelier over a slightly longer horizon. This option allows traders to benefit from both time and potential movements in implied volatility.
Risk and Reward: Moderate risk with a better risk/reward ratio due to lower Theta decay and higher Vega sensitivity, making it a balanced option for those expecting a moderate downward movement.
Medium-Term Options
Option 3: Expiration Date in Six Months, At the Money (ATM)
- Delta: -0.65
- Gamma: 0.06
- Theta: -0.02
- Vega: 0.25
The six-month expiration at-the-money option offers a strong Delta of -0.65, implying a $0.65 increase in option value for every $1 drop in RSG's stock. A lower Gamma at 0.06 indicates stability, and a low Theta of -0.02 shows minimal erosion over time. Vega at 0.25 provides a significant upside if volatility increases, a good fit for those expecting higher future volatility.
Risk and Reward: Low risk due to minimal time decay and high Vega advantage make this option attractive, with a strong potential for profit if stock price declines occur gradually.
Long-Term Options
Option 4: Expiration Date in One Year, Just Out of the Money (JOTM)
- Delta: -0.70
- Gamma: 0.04
- Theta: -0.01
- Vega: 0.30
A one-year expiration date with a strike price just out of the money provides the option of substantial profit with a Delta of -0.70. With Gamma at 0.04, the option is resistant to minor fluctuations, and a very low Theta (-0.01) means nearly negligible time decay. A high Vega of 0.30 presents increased value with rising volatility.
Risk and Reward: This option offers high potential reward with very low risk due to minimal time decay and strong sensitivity to volatility, making it suitable for long-term forecasts of a market downturn.
Option 5: Expiration Date in Two Years, Deep In the Money (DITM)
- Delta: -0.80
- Gamma: 0.02
- Theta: -0.005
- Vega: 0.35
A deep in-the-money option with a two-year expiration presents an excellent choice for traders looking at substantial declines in stock price. With a Delta of -0.80, the option provides significant profit potential for each $1 decrease in stock price. With Gamma at 0.02, it's highly stable against small price movements. An almost negligible Theta of -0.005 reduces any time decay concerns, and Vega at 0.35 offers impressive gains with increased market volatility.
Risk and Reward: Very high reward potential with extremely low risk due to minimal time decay and exceptional upside from volatility sensitivity. This makes it one of the most profitable and low-risk options available.
In summary, longer-term options generally offer more significant potential for profit with lower risk due to less time decay and higher sensitivity to volatility. Depending on the investor's expectations for the stock price movement and volatility, options expiring between six months to two years with varying strike prices from near the money to deep in the money are recommended.
Short Put Option Strategy
To analyze the most profitable short put options for Republic Services, Inc. (RSG), we need to take into consideration several important aspects, such as the potential for profit (premium received), the Greeks (to understand the price sensitivity), and the risk of having shares assigned. Assigning shares can occur if the underlying stock price declines below the strike price at expiration. We aim to minimize this risk, which can be reflected by the delta value, and other Greek values that indicate sensitivity to time decay (theta), volatility (vega), and interest rates (rho).
- Near-term Option: Expiration May 17, 2024, Strike Price $165
- This option has a premium of $0.31 with a delta of -0.0035. Given the delta is very close to zero, the probability of this option being assigned is very low, minimizing the risk of assignment. The gamma is also low at 0.0012, indicating minimal sensitivity to changes in the underlying stock price.
- Risk and Reward: The maximum profit from this option is the premium of $0.31. The risk is minimal given the low delta.
-
Scenario: The stock price needs to remain above $165 for the option to expire worthless, and with a delta as low as it is, there's a high probability it will.
-
Short-term Option: Expiration June 21, 2024, Strike Price $170
- With a premium of $2.61 and a delta of -0.0921, this option presents a higher risk of being assigned but also offers a higher premium.
- Risk and Reward: The maximum profit is $2.61, and the risk is having to buy the stock at $170 if the option is exercised (should the stock price fall below $170).
-
Scenario: This option strikes a balance between premium received and assignment risk. Given the delta, there's a 9.21% chance of assignment, which is reasonably low but not negligible.
-
Medium-term Option: Expiration July 19, 2024, Strike Price $150
- Premium is $0.85 with a delta of -0.1437. This delta suggests a 14.37% probability of the option being in the money and being assigned.
- Risk and Reward: The potential profit is $0.85. The risk lies in the higher delta compared to near-term options, indicating a greater chance of assignment.
-
Scenario: The valuation of Greeks such as theta (-0.0758) indicates considerable time decay, while vega (17.6993) reflects exposure to volatility.
-
Longer-term Option: Expiration October 18, 2024, Strike Price $180
- This option has a premium of $3.50 and a delta of -0.2630. The higher delta reflects a higher chance (26.30%) of being in the money and thus a higher risk of assignment.
- Risk and Reward: The premium of $3.50 signifies a substantial profit potential. However, the corresponding risk is significant given the higher delta.
-
Scenario: It is important to assess if the stock will remain above the $180 strike price. The vega is substantial at 39.6129, suggesting high sensitivity to volatility changes.
-
Longest-term Option: Expiration November 15, 2024, Strike Price $165
- Premium is $1.40 with a delta of -0.1021. This delta indicates a 10.21% probability of being in the money, offering a good balance between risk and premium.
- Risk and Reward: Maximum profit is $1.40, with a relatively moderate risk reflected by the delta.
- Scenario: This option provides an attractive premium with modest risk. Greeks show stability with vega (23.5206) and theta (-0.0087) indicating moderate exposure to volatility and time decay.
Overall, the chosen options provide a range from low-risk/low-reward to higher-risk/higher-reward scenarios:
- May 17, 2024, $165: Minimal risk, small reward.
- June 21, 2024, $170: Balance between risk and reward.
- July 19, 2024, $150: Moderate risk, modest reward.
- October 18, 2024, $180: Higher risk, higher reward.
- November 15, 2024, $165: Moderate risk, good reward.
These choices accommodate various trading strategies, ensuring a balance between potential profit and manageable risk, with a specific focus on minimizing the chances of being assigned the underlying shares.
Vertical Bear Put Spread Option Strategy
In analyzing a vertical bear put spread strategy for Republic Services, Inc. (RSG) with the intention of targeting a stock price movement within 2% of the current value, we first need to find appropriate strike prices and expiration dates that allow us to exploit this anticipated price decrease while minimizing the risk of having shares assigned. To this end, we will choose five option combinations that span various expirations from near-term to long-term maturities and provide insight into their profitability and risk profiles based on "the Greeks" and premiums.
1. Near-Term Option (Expire: 2024-05-17)
Short Put Option: - Strike Price: 165.0 - Expiration Date: 2024-05-17 - Premium: $0.31 - Delta: -0.0035
Analysis: - Profit Potential: With a premium of $0.31, the maximum profit is limited to the premium collected, since we're selling the option. - Risk: The delta is quite low at -0.0035, indicating minimal price movement impact, yet the very close expiration means any significant price move poses a risk of assignment. As the stock price moves closer to 2% under, the high gamma might spike up the delta rapidly, leading to higher short-term price sensitivity and potential assignment.
Potential Long Put Option (Not Provided): - If a long put option is bought at the same strike, the total investment would be reduced by the premium paid for the long put, hedging against assignment but potentially reducing profitability due to the small premium spread in the short run.
2. Mid-Term Option (Expire: 2024-06-21)
Short Put Option: - Strike Price: 170.0 - Expiration Date: 2024-06-21 - Premium: $2.61 - Delta: -0.0921
Analysis: - Profit Potential: The collected premium of $2.61 offers a generous profit potential, minus any premium paid for the long put. - Risk: A delta of -0.0921 shows moderate exposure to price changes. The higher premium received compensates for the moderate delta risk, and by selecting a closer expiration or higher strike for the long put, we further minimize immediate assignment risk.
Potential Long Put Option (Not Provided): - A long put deeper out-of-the-money (e.g., at $155 or $160) if exists could be a cost-effective hedge, ensuring the spread captures a significant part of $2.61 profit potential.
3. Medium-Term Option (Expire: 2024-07-19)
Short Put Option: - Strike Price: 180.0 - Expiration Date: 2024-07-19 - Premium: $1.00 - Delta: -0.185
Analysis: - Profit Potential: Collected premium of $1.00 provides attractive returns. - Risk: Delta of -0.185 is considerably high, increasing the risk of assignment if the stock price moves sharply down. However, a higher strike for the long put minimizes exposure significantly.
Potential Long Put Option (Not Provided): - An ideal hedge would involve buying a long put at a slightly higher strike than $180 to ensure maximum profit retention while capping losses.
4. Mid-Long Term Option (Expire: 2024-10-18)
Short Put Option: - Strike Price: 175.0 - Expiration Date: 2024-10-18 - Premium: $2.23 - Delta: -0.1840
Analysis: - Profit Potential: The premium of $2.23 offers a substantial income. - Risk: Delta indicates sensitivity to price drops is heightened but manageable with proper hedging.
Potential Long Put Option (Not Provided): - Purchasing a long put with strike around $170-$165 would created a profitable vertical spread, protecting against drastic market downturns within the sensitivity window of delta and other greeks.
5. Long-Term Option (Expire: 2024-11-15)
Short Put Option: - Strike Price: 180.0 - Expiration Date: 2024-11-15 - Premium: $5.40 - Delta: -0.2761
Analysis: - Profit Potential: Holding a premium of $5.40 provides a compelling profit margin. - Risk: Delta here shows higher exposure, meaning significant downside movement necessitating immediate considering of hedging to avoid assignment risk.
Potential Long Put Option (Not Provided): - Hedging with an out-of-the-money long put, perhaps around $160-$165, would allow capturing the large premium while minimizing the risk through the high sensitivity delta.
Conclusion
For any vertical bear put spread involving RSG out of the options above:
- Most Profitable (Mid-Term):
-
Expiration: 2024-06-21, Strike: 170.0, Profit Potential: $2.61
-
Balanced Risk-Reward:
-
Expiration: 2024-10-18, Strike: 175.0, Profit Potential: $2.23
-
Minimal Short-Term Risk:
-
Expiration: 2024-05-17, Strike: 165.0, Profit Potential: $0.31
-
Intermediate Term Exposure:
-
Expiration: 2024-07-19, Strike: 180.0, Profit Potential: $1.00
-
Long-Term Asymmetric Return:
- Expiration: 2024-11-15, Strike: 180.0, Profit Potential: $5.40
To minimize risk, in all scenarios ensure to identify a suitable long put option ideally situated 2-3 strikes deeper out-of-the-money than the short put to achieve a balanced hedging strategy.
Vertical Bull Put Spread Option Strategy
Given the data provided and your interest in implementing a vertical bull put spread on Republic Services, Inc. (RSG), I'll analyze the given options chain for constructing a profitable strategy. For context, a vertical bull put spread involves selling a put option at one strike price and buying another put option at a lower strike price but with the same expiration date. This strategy aims to capture premium income while limiting downside risk, making it suitable when you anticipate the stock price will stay above the sold put's strike price.
Criteria for Selection:
- Profit Potential: Focus on high-premium options.
- Limited Risk of Assignment: Aim to sell out-of-the-money (OTM) puts to minimize the risk that the stock will be assigned.
- Expiration Dates: Provide a mix of near-term, mid-term, and long-term expirations.
Analysis of Specific Options:
1. Near-Term Strategy (Expiring 2024-05-17):
- Sell Put: Strike 165.0:
- Premium: $0.31
- Delta: -0.0035
-
The low delta indicates a very low probability that this option will end up in the money, minimizing the risk of assignment.
-
Buy Put: Strike 160.0 (assumed for analysis as Long Put data is not provided):
- The cost will be lower than $0.31, managing potential losses.
Risk/Reward: The maximum profit is the net premium received. If the stock price stays above 165, the profit is $0.31 per share. The risk is limited to the difference between strike prices minus the net premium received.
2. Mid-Term Strategy (Expiring 2024-06-21):
- Sell Put: Strike 170.0:
- Premium: $2.61
- Delta: -0.0921
-
While this has a higher delta than the previous choice, it's still relatively low, meaning assignment risk remains manageable.
-
Buy Put: Strike 165.0:
- This will cost less than the $2.61 received, assuming the Long Put data aligns with the previous short puts' general premiums.
Risk/Reward: Max profit is the difference in premiums with controlled downside. If the stock stays above 170 by expiration, we retain $2.61 per share.
3. Mid-Long Term Strategy (Expiring 2024-07-19):
- Sell Put: Strike 180.0:
- Premium: $1.00
- Delta: -0.1850
-
Higher delta implies a greater risk of assignment but gives a higher premium.
-
Buy Put: Strike 175.0:
- This would manage risk, reducing the cost from the premium collected.
Risk/Reward: Max profit if the stock stays above 180. The profit is the difference in premiums, and the limited downside is managed effectively.
4. Long-Term Strategy (Expiring 2024-10-18):
- Sell Put: Strike 170.0:
- Premium: $1.70
- Delta: -0.1253
-
Moderate delta, fair premium income, balanced risk of assignment.
-
Buy Put: Strike 165.0:
- Will provide protection and be less than the premium of $1.70.
Risk/Reward: Profitable if the stock remains above 170. Risk is controlled through the spread.
5. Long-Term Strategy (Expiring 2024-10-18):
- Sell Put: Strike 180.0:
- Premium: $3.50
- Delta: -0.2630
-
Higher delta increases risk but offers substantial premium.
-
Buy Put: Strike 175.0:
- Reduces the breakeven point while managing risk effectively due to substantial premiums involved.
Risk/Reward: High potential profits if the stock stabilizes above 180 with capped risk managed by the lower strike put.
Summary:
For short-term exposure, the strike 165 put expiring 2024-05-17 with a significant premium and minimal delta provides lucrative returns while minimizing assignment risk. Mid-term strategies offer balanced risk and reward with moderate deltas. Long-term options carry more risk with higher deltas but compensate through substantial premiums.
In every case, the maximum loss will be the difference in strike prices minus the net premium received. Ensure to select strike pairs that align with your risk tolerance and market outlook.
Vertical Bear Call Spread Option Strategy
To assess the most profitable vertical bear call spread strategy for Republic Services, Inc. (RSG), it's important to evaluate the short and long call options based on their expiration dates, premiums, Greeks, and potential returns. The vertical bear call spread involves selling a call option at a lower strike price and buying another call option at a higher strike price but with the same expiration date. This strategy profits if the stock price remains below the sold call's strike price.
Let's analyze five promising options based on their expiration dates and strike prices, spanning from short-term to long-term options:
1. Near-Term (Expiring on 2024-06-21):
- Sell the $170 strike call option: Premium: $19.52, Delta: 0.7808
- Buy the $175 strike call option: Premium: $11.92, Delta: 0.7733
Analysis:
- Risk: The maximum risk is the difference between the strikes minus the received premium, which is $2.60.
- Reward: The maximum reward is the net premium received, which is $7.60.
- Assignment Risk: The deltas are high (close to 0.8) indicating a moderate risk of assignment, which needs careful monitoring as the expiration date approaches. However, given the strategy's profitable profile, it can be mitigated if the stock price remains near the target range (2% over or under the current price).
2. Medium-Term (Expiring on 2024-07-19):
- Sell the $160 strike call option: Premium: $30.80, Delta: 0.8034
- Buy the $165 strike call option: Premium: $20.49, Delta: 0.7741
Analysis:
- Risk: The maximum risk is $3.71.
- Reward: The maximum reward is $10.31.
- Assignment Risk: The delta of the sold option (0.8034) shows a high probability of assignment risk. Close monitoring and preemptive measures like rolling the position can mitigate this risk.
3. Medium-Term (Expiring on 2024-10-18):
- Sell the $170 strike call option: Premium: $23.90, Delta: 0.7174
- Buy the $180 strike call option: Premium: $17.30, Delta: 0.6631
Analysis:
- Risk: The maximum risk is $2.20.
- Reward: The maximum reward is $6.60.
- Assignment Risk: The sold call option's delta (0.7174) suggests a relatively significant risk of being assigned. Pre-expiration strategies could reduce the risk.
4. Long-Term (Expiring on 2024-11-15):
- Sell the $170 strike call option: Premium: $20.50, Delta: 0.7527
- Buy the $175 strike call option: Premium: $22.15, Delta: 0.6977
Analysis:
- Risk: The maximum risk is $1.70.
- Reward: The maximum reward is $5.30.
- Assignment Risk: With deltas close to 0.75 and 0.70 for the sold and bought call options respectively, the assignment risk remains moderate. Given the high premium and long horizon, this position is appealing but requires diligence in monitoring.
5. Long-Term (Expiring on 2024-11-15):
- Sell the $180 strike call option: Premium: $13.90, Delta: 0.6571
- Buy the $190 strike call option: Premium: $9.00, Delta: 0.5212
Analysis:
- Risk: The maximum risk is $3.10.
- Reward: The maximum reward is $4.90.
- Assignment Risk: The lower delta (0.6571) compared to others indicates less risk of assignment. The trade-off here is a lower premium received, but it still provides a favorable risk-reward ratio.
Summary:
- 2024-06-21 (Sell $170 - Buy $175): Max Reward: $7.60, Max Risk: $2.60, Moderate assignment risk.
- 2024-07-19 (Sell $160 - Buy $165): Max Reward: $10.31, Max Risk: $3.71, High assignment risk.
- 2024-10-18 (Sell $170 - Buy $180): Max Reward: $6.60, Max Risk: $2.20, Moderate assignment risk.
- 2024-11-15 (Sell $170 - Buy $175): Max Reward: $5.30, Max Risk: $1.70, Moderate assignment risk.
- 2024-11-15 (Sell $180 - Buy $190): Max Reward: $4.90, Max Risk: $3.10, Lower assignment risk.
While each option presents a balance of risk and reward, focusing on those options with moderate assignment risks and an attractive reward profile is vital. The 2024-11-15 $180-$190 spread provides a good balance with decent profit potential and lower assignment risk, making it a strong choice.
Vertical Bull Call Spread Option Strategy
A vertical bull call spread is a bullish options trading strategy involving buying a call option at a lower strike price and selling another call option at a higher strike price, both with the same expiration date. The objective is to limit the risk and maximize the potential profit. Based on the given Greeks and premium data for Republic Services, Inc. (RSG), let's dive into five choices for the most profitable vertical bull call spread strategies considering short-term to long-term options.
Near-Term Strategy
Expiration Date: 2024-05-17 * Buy Call at $170 Strike - Delta: 0.990 - Gamma: 0.003 - Vega: 0.250 - Theta: -0.110 - Premium: $18.42
- Sell Call at $175 Strike
- Delta: 0.983
- Gamma: 0.007
- Vega: 0.404
- Theta: -0.133
- Premium: $13.39
This near-term strategy offers limited risk since the options expire shortly. However, given the high delta values, the options are deep in-the-money (ITM), which increases the likelihood of the shares being assigned. The ROI is relatively high, but the potential assignment risk needs careful consideration.
Intermediate Term Strategy 1
Expiration Date: 2024-06-21 * Buy Call at $170 Strike - Delta: 0.781 - Gamma: 0.011 - Vega: 17.268 - Theta: -0.114 - Premium: $19.52
- Sell Call at $175 Strike
- Delta: 0.743
- Gamma: 0.026
- Vega: 18.847
- Theta: -0.064
- Premium: $11.92
This intermediate-term strategy balances profitability with moderate risk. The gamma values suggest higher responsiveness to stock price changes, and the theta values indicate less time decay influence. This option set offers a decent ROI with manageable assignment risk since the options are not excessively in-the-money.
Intermediate Term Strategy 2
Expiration Date: 2024-07-19 * Buy Call at $170 Strike - Delta: 0.774 - Gamma: 0.011 - Vega: 23.364 - Theta: -0.073 - Premium: $19.33
- Sell Call at $175 Strike
- Delta: 0.751
- Gamma: 0.015
- Vega: 24.659
- Theta: -0.062
- Premium: $16.37
Another intermediate-term choice, this strategy offers even higher profitability with well-proportioned gamma and theta values. These options are closer to at-the-money (ATM), reducing the risk of assignment and maximizing potential profits within the expected price target range.
Long-Term Strategy 1
Expiration Date: 2024-10-18 * Buy Call at $180 Strike - Delta: 0.663 - Gamma: 0.013 - Vega: 44.048 - Theta: -0.039 - Premium: $17.3
- Sell Call at $185 Strike
- Delta: 0.593
- Gamma: 0.016
- Vega: 46.913
- Theta: -0.038
- Premium: $11.4
This long-term strategy provides the highest ROI amongst the long-term choices and takes advantage of the lower delta, reducing assignment risk. It offers substantial gains if the stock price increases as expected while managing the risks with favorable gamma and theta values.
Long-Term Strategy 2
Expiration Date: 2024-11-15 * Buy Call at $190 Strike - Delta: 0.521 - Gamma: 0.015 - Vega: 52.351 - Theta: -0.035 - Premium: $9.0
- Sell Call at $195 Strike
- Delta: 0.443
- Gamma: 0.016
- Vega: 51.952
- Theta: -0.033
- Premium: $5.75
The most extended-term option discussed here offers the highest potential ROI and profit. The delta values are lower, ensuring minimal assignment risk. This position is highly profitable if the stock price rallies slightly above the targeted range, with manageable vega and theta values mitigating the risks over time.
Conclusion
Each strategy offers a balanced approach to risk and reward, but the selection should align with the trader's risk tolerance and market outlook. The intermediate-term strategies offer a middle ground with sufficient profit potential and manageable assignment risk, while long-term strategies, despite lesser assignment risk, require patience and a firmer conviction in the stock's prospective upward movement. The near-term approach might appeal to bolder traders looking for quicker returns but comes with higher immediate assignment risks.
Spread Option Strategy
To analyze the most profitable calendar spread options strategy for Republic Services, Inc. (RSG) while minimizing the risk associated with assigned shares, we must carefully select call options to buy and put options to sell based on several criteria. Our main targets include maximizing profitability, closely aligned expiration dates, and ensuring the options chosen are likely to remain out of the money (OTM) to reduce assignment risk.
Near-Term Expiration Option (1 day to expire)
- Call Option:
- Strike Price: $160.0, Expiration Date: 2024-05-17
- Relevant Greeks: Delta = 0.9963828654, Gamma = 0.0009897565, Vega = 0.1049846843, Theta = -0.0714329577, Rho = 0.4364362382
-
Premium: $29.39, ROI: 0.036563457, Profit: $1.0746
-
Put Option:
- Strike Price: $170.0, Expiration Date: 2024-05-17
- Relevant Greeks: Delta = -0.0055977783, Gamma = 0.0022945039, Vega = 0.1562603478, Theta = -0.0556052381, Rho = -0.0028982881
- Premium: $0.05, ROI: 100.0, Profit: $0.05
Short-Term Expiration Option (36 days to expire)
- Call Option:
- Strike Price: $175.0, Expiration Date: 2024-06-21
- Relevant Greeks: Delta = 0.7732707916, Gamma = 0.0166419472, Vega = 17.6060667378, Theta = -0.0861438948, Rho = 12.7879342988
-
Premium: $11.92, ROI: 0.2973657718, Profit: $3.5446
-
Put Option:
- Strike Price: $160.0, Expiration Date: 2024-06-21
- Relevant Greeks: Delta = -0.067183014, Gamma = 0.006369652, Vega = 7.6264292688, Theta = -0.0357009773, Rho = -1.2993780758
- Premium: $0.28, ROI: 100.0, Profit: $0.28
Medium-Term Expiration Option (64 days to expire)
- Call Option:
- Strike Price: $165.0, Expiration Date: 2024-07-19
- Relevant Greeks: Delta = 0.8002347851, Gamma = 0.008783977, Vega = 21.7257835287, Theta = -0.0786406118, Rho = 21.5732311909
-
Premium: $20.49, ROI: 0.2427818448, Profit: $4.9746
-
Put Option:
- Strike Price: $135.0, Expiration Date: 2024-07-19
- Relevant Greeks: Delta = -0.0663012703, Gamma = 0.0028897589, Vega = 10.0631739385, Theta = -0.0435235006, Rho = -2.4207326653
- Premium: $0.11, ROI: 100.0, Profit: $0.11
Long-Term Expiration Option (155 days to expire)
- Call Option:
- Strike Price: $160.0, Expiration Date: 2024-10-18
- Relevant Greeks: Delta = 0.7940479862, Gamma = 0.0064033996, Vega = 34.1153029263, Theta = -0.0485309309, Rho = 48.4025236605
-
Premium: $28.7, ROI: 0.0614843206, Profit: $1.7646
-
Put Option:
- Strike Price: $100.0, Expiration Date: 2024-10-18
- Relevant Greeks: Delta = -0.027000334, Gamma = 0.0009103185, Vega = 7.578753303, Theta = -0.0132072867, Rho = -2.4837497318
- Premium: $0.2, ROI: 100.0, Profit: $0.2
Very Long-Term Expiration Option (183 days to expire)
- Call Option:
- Strike Price: $175.0, Expiration Date: 2024-11-15
- Relevant Greeks: Delta = 0.785497852, Gamma = 0.0040172898, Vega = 37.8884186264, Theta = -0.0628723397, Rho = 48.8878489004
-
Premium: $39.8, ROI: 0.0166984925, Profit: $0.6646
-
Put Option:
- Strike Price: $130.0, Expiration Date: 2024-11-15
- Relevant Greeks: Delta = -0.0342010805, Gamma = 0.0018330712, Vega = 10.0144091225, Theta = -0.0079180925, Rho = -3.5054549079
- Premium: $0.05, ROI: 100.0, Profit: $0.05
Conclusion:
For the near-term strategy, while buying the $160 call option expiring on 2024-05-17 and selling the $170 put option expiring on the same date, we secure risk with low premiums and minimal exposure to assignment risks. For a slightly longer horizon, the $175 call with the same expiration yields the highest ROI. For medium-term (64 days), the $165 call provides a good balance between ROI and manageable assignment risk. For long-term and very long-term horizons, the $160 call options with expiration dates farther out provide more measured returns with lower volatility exposure.
Calendar Spread Option Strategy #1
When analyzing the most profitable calendar spread options strategy for Republic Services, Inc. (RSG), given that the objective is to minimize the risk of assigned shares while achieving profitable returns, a key consideration is balancing the Delta values of the bought put options and the sold call options. Specifically, we aim to construct positions so that the Delta for the put options reflects a low probability of the options being in the money at expiration, thereby reducing the risk of assignment, while also capitalizing on premium returns.
Here are the top five choices across various expiration dates and strike prices for a calendar spread strategy.
- Near-Term Option:
- Bought Put Option: Strike 160, expiration 2024-05-17.
- Delta: 0.9963828654, Gamma: 0.0009897565, Vega: 0.1049846843, Theta: -0.0714329577, Premium: $29.39.
- Sold Call Option: Strike 150, expiration 2024-06-21.
- Delta: 0.920367492, Gamma: 0.0047009557, Vega: 8.5926336679, Theta: -0.0739526096, Premium: $43.3.
In this configuration, the near-term put option is deep in the money with a high Delta, protecting against minor price dips while the sold call option at a lower strike and further expiration minimizes immediate assignment risk.
- Short-Term Option:
- Bought Put Option: Strike 170, expiration 2024-06-21.
- Delta: 0.7741216122, Gamma: 0.0110190494, Vega: 23.3640917709, Theta: -0.0734438223, Premium: $19.33.
- Sold Call Option: Strike 160, expiration 2024-07-19.
- Delta: 0.8034449752, Gamma: 0.0069344465, Vega: 21.5114239966, Theta: -0.0945939723, Premium: $30.8.
This strategy strikes a balance where the put option is in a favorable zone of the payout curve while the call option's further expiration reduces immediate assignment chances.
- Medium-Term Option:
- Bought Put Option: Strike 185, expiration 2024-07-19.
- Delta: 0.5993340317, Gamma: 0.03055587, Vega: 30.1376759699, Theta: -0.0470358904, Premium: $6.0.
- Sold Call Option: Strike 180, expiration 2024-10-18.
- Delta: 0.6631153892, Gamma: 0.0138675382, Vega: 44.0479712492, Theta: -0.0395283182, Premium: $17.3.
The medium-term option involves relatively lower Delta values on both positions, ensuring a balanced approach to minimize assignment risk while securing potential returns.
- Long-Term Option:
- Bought Put Option: Strike 195, expiration 2024-10-18.
- Delta: 0.4154885804, Gamma: 0.0185089167, Vega: 47.2738618165, Theta: -0.0324075836, Premium: $5.85.
- Sold Call Option: Strike 190, expiration 2024-11-15.
- Delta: 0.5211728146, Gamma: 0.0151728312, Vega: 52.350837596, Theta: -0.0355553995, Premium: $9.0.
For longer-term trades, selecting a combination of put and call strikes close to each other but with different expiration dates reduces overlap and risk of assignments while maintaining a high Vega for sensitivity to market volatility.
- Extended-Term Option:
- Bought Put Option: Strike 210, expiration 2024-10-18.
- Delta: 0.2355923986, Gamma: 0.0124020262, Vega: 37.3643297707, Theta: -0.028003814, Premium: $1.8.
- Sold Call Option: Strike 190, expiration 2024-11-15.
- Delta: 0.5211728146, Gamma: 0.0151728312, Vega: 52.350837596, Theta: -0.0355553995, Premium: $9.0.
This strategy allows a wider range between strikes with lower Delta for the put option to minimize the chances of the put ending ITM while still allowing the call option to generate significant premium returns.
These strategies cover different expiration periods and balance risks and rewards effectively by focusing on the Greeks, primarily Delta and Vega, ensuring an optimal balance between potential profitability and risk mitigation concerning the target stock price range.
Calendar Spread Option Strategy #2
Based on the available options data for Republic Services, Inc. (RSG), we can identify five calendar spread strategies that would be most profitable while balancing risk and reward. The strategies involve selling a put option at one expiration date and buying a call option at a different, usually later, expiration date. The primary goal is to minimize the risk associated with having shares assigned while aiming to hit a target stock price within 2% over or under the current stock price.
- Near-Term to Mid-Term Strategy:
- Sell Put Option:
- Strike Price: 170.0
- Expiration Date: 2024-05-17
- Delta: 0.990
- ROI: 29.45%
- Buy Call Option:
- Strike Price: 180.0
- Expiration Date: 2024-07-19
- Delta: 0.720
- ROI: 72.34%
This strategy leverages a near-term sell with a mid-term buy, maximizing the premium collected while obtaining a call option that has manageable "Greeks" and a lower risk of share assignment due to the less aggressive delta of the call.
- Short to Medium-Term Strategy with High Delta Put:
- Sell Put Option:
- Strike Price: 150.0
- Expiration Date: 2024-06-21
- Delta: 0.920
- ROI: 23.80%
- Buy Call Option:
- Strike Price: 170.0
- Expiration Date: 2024-10-18
- Delta: 0.663
- ROI: 82.68%
This placement ensures premium collection from a high delta put option while reaching for a medium-term call option with a substantial ROI, reducing risk associated with a potential downturn in the stock.
- Longer-Term Strategy with Manageable Delta:
- Sell Put Option:
- Strike Price: 165.0
- Expiration Date: 2024-07-19
- Delta: 0.751
- ROI: 51.15%
- Buy Call Option:
- Strike Price: 185.0
- Expiration Date: 2024-11-15
- Delta: 0.593
- ROI: 100.0%
Opting for a longer-term strategy provides ample time for the stock to reach the target price. The delta values in both legs offer a balanced approach to minimize the risk of assignment while capturing attractive premiums.
- Aggressive Short to Long-Term Strategy:
- Sell Put Option:
- Strike Price: 180.0
- Expiration Date: 2024-06-21
- Delta: 0.743
- ROI: 68.95%
- Buy Call Option:
- Strike Price: 200.0
- Expiration Date: 2024-11-15
- Delta: 0.360
- ROI: 100.0%
This strategy aggressively employs a higher delta and gamma on the sell side to collect higher premiums, while utilizing a more conservative call option, which offers a high ROI to maximize profits as the stock approaches the target.
- Moderate Short to Longer-Term Strategy:
- Sell Put Option:
- Strike Price: 170.0
- Expiration Date: 2024-07-19
- Delta: 0.774
- ROI: 32.77%
- Buy Call Option:
- Strike Price: 220.0
- Expiration Date: 2024-11-15
- Delta: 0.254
- ROI: 100.0%
Choosing moderate delta and gamma values for the put option allows a reasonable balance between premium collection and risk of share assignment. The call option further out offers room for substantial stock price growth with lower immediate cost.
In conclusion, calendar spreads are sophisticated strategies that can be adjusted according to risk appetite and market view. Selling high-premium, high-delta short-term puts while buying reasonably delta-structured long-term calls provides a buffer against unexpected market moves and allows time for the stock to rise to the target price, achieving optimal profits.
Similar Companies in Waste Management:
Casella Waste Systems, Inc. (CWST), Clean Harbors, Inc. (CLH), GFL Environmental Inc. (GFL), Waste Management, Inc. (WM), Stericycle, Inc. (SRCL), Waste Connections, Inc. (WCN), Harsco Corporation (HSC), Montrose Environmental Group, Inc. (MEG)
https://finance.yahoo.com/news/republic-services-employees-named-industrys-174700912.html
https://finance.yahoo.com/news/insider-sale-republic-services-inc-064303176.html
https://finance.yahoo.com/news/republic-services-insider-sold-shares-075423283.html
https://finance.yahoo.com/news/why-republic-services-rsg-top-134509746.html
https://finance.yahoo.com/news/why-1-momentum-stock-could-135011288.html
https://finance.yahoo.com/m/6cd6539b-9031-32a5-bc8f-2ca62ac1f4dc/analyst-report%3A-republic.html
https://finance.yahoo.com/news/argus-adjusts-price-target-republic-120657347.html
https://www.sec.gov/Archives/edgar/data/1060391/000106039124000205/rsg-20240331.htm
Copyright © 2024 Tiny Computers (email@tinycomputers.io)
Report ID: kmKoTD
Cost: $0.49890
https://reports.tinycomputers.io/RSG/RSG-2024-05-15.html Home