Schwab U.S. REIT ETF (ticker: SCHH)
2024-01-18
 Schwab U.S. REIT ETF (ticker: SCHH) is an exchange-traded fund that offers investors exposure to the U.S. real estate sector, specifically focusing on real estate investment trusts (REITs). Managed by Charles Schwab Investment Management, SCHH seeks to track the total return of the Dow Jones U.S. Select REIT Index, which represents the performance of publicly traded equity REITs and other real estate-related investments. The fund is designed to provide a diversified portfolio of U.S. real estate holdings, allowing investors to partake in the growth and income potential of the real estate market with the liquidity and transparency of an ETF. As with many sector-specific ETFs, SCHH may appeal to those looking to allocate a portion of their assets to real estate as part of their investment strategy without the need to directly buy or manage properties. The fund's low expense ratio, along with its broad market capitalization range, makes it accessible for both individual and institutional investors seeking real estate exposure in their portfolios.
| Previous Close | 19.99 | Open | 20.01 | Day Low | 19.7145 |
| Day High | 20.08 | Volume | 2,375,413 | Average Volume | 3,403,200 |
| Average Volume (10 days) | 2,823,030 | Bid | 19.72 | Ask | 19.98 |
| Bid Size | 21,500 | Ask Size | 3,100 | Yield | 0.0324 |
| Total Assets | 6,546,981,888 | 52-Week Low | 16.63 | 52-Week High | 21.99 |
| 50-Day Average | 19.6102 | 200-Day Average | 19.08425 | NAV Price | 19.99 |
| Trailing P/E | 27.988943 | YTD Return | -3.47658% | Beta (3 Year) | 1.18 |
| 3 Year Average Return | 4.57581% | 5 Year Average Return | 2.34398% |
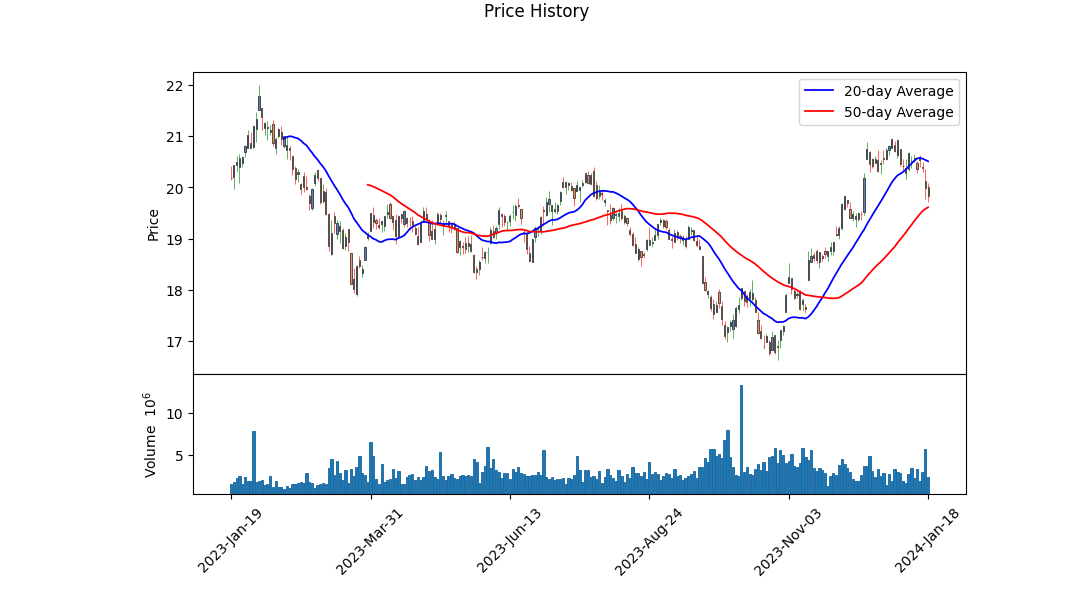
 Analyzing the market trends for SCHH based on the provided technical, fundamental, and balance sheet data sheds light on the ETF's possible future performance. A deep dive into the closing days' technical indicators reveals a downward pressure on the share price. Notably, the price has been oscillating below the Parabolic SAR, indicating a bearish sentiment. The On-Balance Volume (OBV) waned towards the end of the period, further signaling a drop in buying interest.
Fundamental analysis aligns with the technical perspective. Given the moderately high PE Ratio (TTM) at 27.99 and a small yield of 3.24%, investors might be cautious, especially if they expect interest rate hikes, which traditionally affect real estate investments negatively. However, the stability offered by the net assets of 6.55B and a reasonably consistent NAV around 19.99 provides a counterargument for resilience. The low expense ratio of 0.07% is appealing, but the YTD return flags a cautious note for investors banking on short-term gains.
The 50-day and 200-day moving averages reveal a sideways trend, with the price hovering around 19.61 and 19.08, respectively. The lack of prominent divergence between these averages indicates a lack of momentum, suggesting that any substantial upward or downward movements may be limited in the near term.
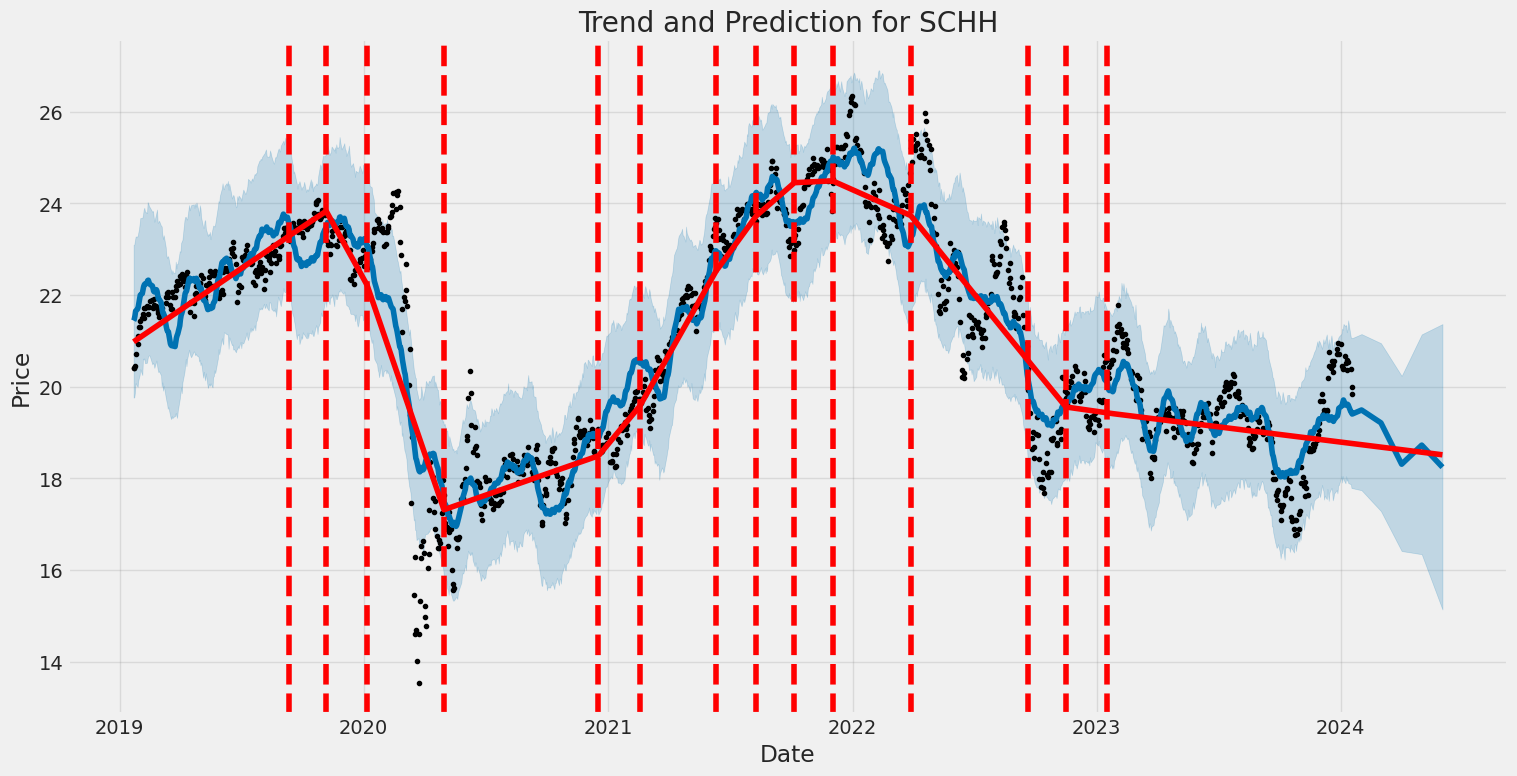
Given the empty datasets for financials, balance sheets, and cash flows, our extrapolation relies solely on the provided data. The pullback from the 52-week high of 21.99 towards the current levels could tempt value-seeking investors to consider SCHH as a mild contrarian bet, assuming the broader market does not expect further significant downturns in the real estate sector.
A closer examination of the MACD histogram underscores a reinforced negative trend with decreasing momentum, implying that any potential reversals might be short-lived or lack strength for a solid positive trajectory.
Overall, considering the assortment of these indicators, SCHH may experience a consolidation or mild bearish phase in the next few months, with critical support near the 50-day and 200-day averages, acting as pivot points for any changes in the trend. Fluctuations are to be expected, with a tendency for sideways to a slightly downward movement, unless significant market catalysts emerge that can markedly improve investor sentiment toward the real estate sector. Trading volume will be crucial for sustaining any potential upswing; hence, the market's reaction to volume changes should be monitored. Long-term investors might not be deterred, given the underlying assets and fundamental stability, whereas short-term traders could approach with caution, prioritizing defensive strategies until clearer bullish signals manifest.
| Statistic Name | Statistic Value |
| Alpha () | -0.0385 |
| Beta () | 0.9581 |
| R-squared | 0.617 |
| Adj. R-squared | 0.616 |
| F-statistic | 2016 |
| Prob (F-statistic) | 2.77e-263 |
| Log-Likelihood | -1775.8 |
| No. Observations | 1,256 |
| AIC | 3556 |
| BIC | 3566 |
| Df Residuals | 1254 |
| Df Model | 1 |
In the linear regression model of SCHH against SPY, beta () represents the sensitivity of the real estate sector ETF (SCHH) returns to the returns of the broader stock market index SPY. A beta of 0.9581 suggests that SCHH typically moves in the same direction as SPY but with slightly less volatility. R-squared, a measure of the percentage of variance in SCHH that is explained by SPY, is 0.617, indicating a strong positive relationship between SCHH and SPY. However, there is still a considerable amount of variance not captured by the model.
Alpha (), often regarded as a measure of the asset's performance relative to the benchmark, is -0.0385 in this model. This negative alpha suggests that, after adjusting for market movements, SCHH has underperformed the broader market by an average of 3.85 basis points over the period studied. The small magnitude of alpha indicates that the returns on SCHH are primarily driven by the market factor, as represented by the movements in SPY. Nonetheless, the statistic's p-value of 0.172 implies that this alpha is not statistically significant at conventional levels, suggesting insufficient evidence to claim that SCHH has a performance markedly different than the market after adjusting for risk.
The Schwab U.S. REIT ETF (SCHH) has established itself as a notable player in the real estate sector for exchange-traded funds. With a specific focus on large-cap stocks, SCHH mirrors the performance of U.S. equity REITs, which are investment vehicles that own, operate, or finance income-producing real estate. The SCHH offers investors exposure to a sector known for providing substantial dividend yields and the potential for capital appreciation.
| company | symbol | percent |
|---|---|---|
| Prologis Inc | PLD | 9.54 |
| American Tower Corp | AMT | 7.80 |
| Equinix Inc | EQIX | 4.99 |
| Crown Castle Inc | CCI | 3.92 |
| Welltower Inc | WELL | 3.92 |
| Public Storage | PSA | 3.79 |
| Simon Property Group Inc | SPG | 3.65 |
| Realty Income Corp | O | 3.26 |
| Digital Realty Trust Inc | DLR | 3.20 |
| Extra Space Storage Inc | EXR | 2.66 |
As of January 8, 2024, SCHH continues to exhibit a commendable track record with its AUM reaching an impressive $6.62 billion, spread across 123 holdings. Benchmarking against competitors such as VNQ, IYR, and XLRE, SCHH has performed well, maintaining a respectable 10-year compound annual growth rate of 5.14%. Though this growth rate falls short of VNQ's more robust 7.35%, the disparity must be assessed in the context of SCHH's lower expense ratio of merely 0.07%, which is an attractive feature for cost-conscious investors.
The fund's dividend offerings also merit attention. With a historical dividend yield of 3.29% and a 5-year dividend CAGR of 1.75%, SCHH investors have enjoyed consistent income, making it an appealing choice for income-focused portfolios. It is important to note, however, that higher yielding alternatives do exist in the market.
The Seeking Alpha article pertaining to SCHH and VNQ assesses the strengths and weaknesses of each ETF's holdings. SCHH's top holdings, including Prologis Inc, American Tower Corp, and Equinix Inc, command a significant weight within the portfolio, as can be seen in the adjacent table.
Critically speaking, concerns have been raised about the valuations of certain holdings within SCHH's portfolio. American Tower Corp, a heavyweight in SCHH, operates with a high forward P/E ratio and an elevated payout ratio which may cast doubt on the sustainability of its dividends. Similarly, Welltower Inc displays a high P/E ratio that, paired with negative trends in its AFFO growth and dividend yield, might introduce additional concerns for the fund's investors. It is this scrutiny of individual components that separates a rigorous investment analysis from a cursory one.
Contrasting SCHH with VNQ, there is an appreciation for VNQ's broader diversification, higher dividends, and long-standing performance track record. The Vanguard Real Estate II Index Fund (VRTPX), a notable component of VNQ's holdings, demonstrates the tactical advantage of VNQs diversified approach. This fund alone has sustained a 5-year CAGR of 7.37%, offering a compelling case for VNQ's strategic allocations.
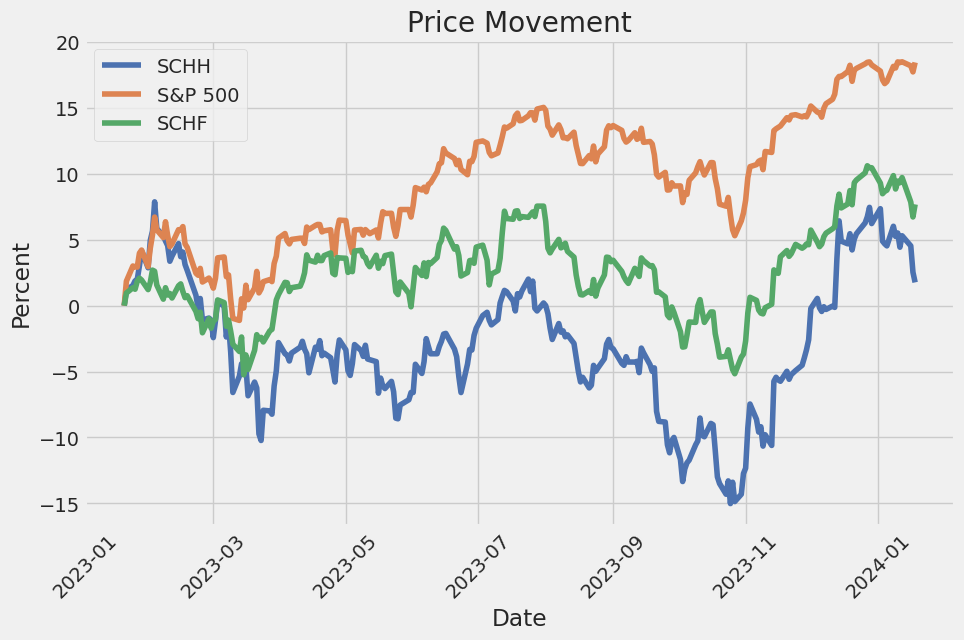
In a landscape that is sensitive to changes in interest rates, SCHH's market performance is expected to align with historical trends, and potential rate decreases in 2024 could provide favorable conditions for growth. However, with a beta value of 1.18, SCHH is susceptible to market volatility, a factor that must be weighed by prospective and current investors alike.
When placing SCHH within the wider context of REIT ETFs, there's an evident balance to be found between its cost efficiency, yield, and performance. Investors are inclined to examine these metrics in concert with each other to gauge the true potential of their investment. This ETF presents an opportunity for stable income through dividends and the promise of capital gains, blended with concerns that require a discerning eye, especially regarding the valuation and future performance of its top holdings.
The comparison and discussion informed by the Seeking Alpha article provide a compelling case for VNQ as a preferred choice for many investors, yet SCHH remains a notable contender worthy of consideration, particularly for those attracted to its lower expense ratio and substantial dividend yield. In an ever-evolving financial landscape, such an analysis is essential for any investor seeking to optimize their real estate exposure in the ETF space.
The volatility of Schwab U.S. REIT ETF (SCHH) as outlined by the ARCH model from 2019 to 2024 indicates a persistent level of fluctuation in its returns. The omega coefficient is sizeable at 1.2433, suggesting there is a substantial baseline volatility inherent in the ETF's returns. Additionally, the alpha coefficient is quite significant at 0.5379, demonstrating the ETF's returns have a tendency to exhibit large swings following periods of market movement.
| Statistic Name | Statistic Value |
|---|---|
| Mean Model | Zero Mean |
| Vol Model | ARCH |
| Log-Likelihood | -2187.96 |
| AIC | 4379.92 |
| BIC | 4390.19 |
| No. Observations | 1,256 |
| omega | 1.2433 |
| alpha[1] | 0.5379 |
When assessing the financial risk of a $10,000 investment in the Schwab U.S. REIT ETF (SCHH) over one year, it is essential to understand the fund's historical volatility and to make predictions about its future returns.
The volatility modeling technique allows us to quantify the level of uncertainty or risk associated with the ETF's return over time. By fitting a model like GARCH, we can capture the time-varying nature of volatility and recognize patterns of clustering in periods of high and low volatility. This model operates under the premise that future volatility can be estimated from past trends of variance, incorporating the idea that market conditions tend to persist and affect future volatility.
Having estimated the ETFs volatility, it's possible to forecast future price movements and thus potential losses. The Value at Risk (VaR) is a statistical measure that's used in this context to estimate the potential loss over a set time frame, given normal market conditions, at a specified confidence level.
For the machine learning predictions, an approach such as utilizing a regression-based model can be instrumental. Specifically, the role of a decision tree-based ensemble method, like RandomForest, is to use historical data to predict future returns of the ETF. This model works by aggregating the predictions of a large number of individual decision trees, which are generated on different subsets of the data and features. It is a robust predictor since it reduces the risk of overfitting by averaging multiple deep decision trees, trained on different parts of the data set.
Integrating the findings from the volatility model and machine learning predictions provides us with a nuanced view of the investment's exposure to financial risk. The calculated amount for the annual Value at Risk (VaR) at a 95% confidence level is $202.86 for the $10,000 investment. This figure implies that under normal market conditions, there is only a 5% chance that the investment in SCHH could lose more than $202.86 over the course of one year. It is a useful figure for investors as it quantifies potential losses within a certain confidence interval, making it easier to weigh against the expected return from the investment. This level of analysis is crucial for any investor interested in better understanding and preparing for the risks associated with equity investments in real estate investment trusts (REITs).
Similar Companies in None:
Schwab International Equity ETF (SCHF), Schwab Emerging Markets Equity ETF (SCHE), Schwab U.S. Small-Cap ETF (SCHA), Schwab U.S. Large-Cap ETF (SCHX), Schwab International Small-Cap Equity ETF (SCHC), Vanguard Real Estate ETF (VNQ), iShares U.S. Real Estate ETF (IYR), Real Estate Select Sector SPDR Fund (XLRE), Invesco Active U.S. Real Estate ETF (PSR), iShares Cohen & Steers REIT ETF (ICF), First Trust S&P REIT Index Fund (FRI), Nuveen Short-Term REIT ETF (NURE), Global X SuperDividend REIT ETF (SRET), Pacer Benchmark Industrial Real Estate SCTR ETF (INDS), FlexShares Real Assets Allocation Index Fund (ASET)
https://seekingalpha.com/article/4661668-schh-worth-buying-but-i-like-another-reit-etf-more
Copyright © 2024 Tiny Computers (email@tinycomputers.io)
Report ID: yZrt35
https://reports.tinycomputers.io/SCHH/SCHH-2024-01-18.html Home