S&P Global Inc. (ticker: SPGI)
2024-01-27
 S&P Global Inc., trading under the ticker symbol SPGI on the New York Stock Exchange, stands as an influential player in the provision of credit ratings, benchmarks, analytics, and data to the global capital and commodity markets. Originally known as McGraw Hill Financial before rebranding in 2016, S&P Global has a rich history that can be traced back to the 19th century. The company's renowned divisions include S&P Global Ratings, which offers credit ratings on public and private corporations; S&P Global Market Intelligence, which provides multi-asset-class and real-time data, research, and analytics; S&P Dow Jones Indices, which is famous for its S&P 500 and Dow Jones Industrial Average indices; and S&P Global Platts, which focuses on providing information and benchmark prices for the energy and commodities markets. S&P Global consistently plays a critical role in providing transparent and independent data that enables investors, companies, and governments to make informed financial decisions. The company's commitment to market intelligence and its influence on global financial ecosystems make it a pivotal entity in the financial services industry.
| Address | 55 Water Street, New York, NY 10041, United States | Phone Number | 212 438 1000 | Website | https://www.spglobal.com |
| Industry | Financial Data & Stock Exchanges | Sector | Financial Services | Full-Time Employees | 39,361 |
| Previous Close | 449.34 | Market Cap | 141,482,885,120 | Dividend Rate | 3.64 |
| Dividend Yield | 0.82% | Beta | 1.192 | Volume | 615,695 |
| Average Volume | 1,212,177 | Market Cap | 141,482,885,120 | Total Cash | 1,644,999,936 |
| Total Debt | 12,113,000,448 | Total Revenue | 12,282,000,384 | Operational Cash Flow | 3,488,999,936 |
| Free Cash Flow | 3,498,374,912 | EBITDA | 5,439,000,064 | Return on Equity | 6.907% |
| Gross Margins | 66.374% | EBITDA Margins | 44.284% | Operating Margins | 38.067% |
| Sharpe Ratio | -18.481840620432127 | Sortino Ratio | -269.7714742641712 |
| Treynor Ratio | 0.1847827676723319 | Calmar Ratio | 1.1804838985370596 |
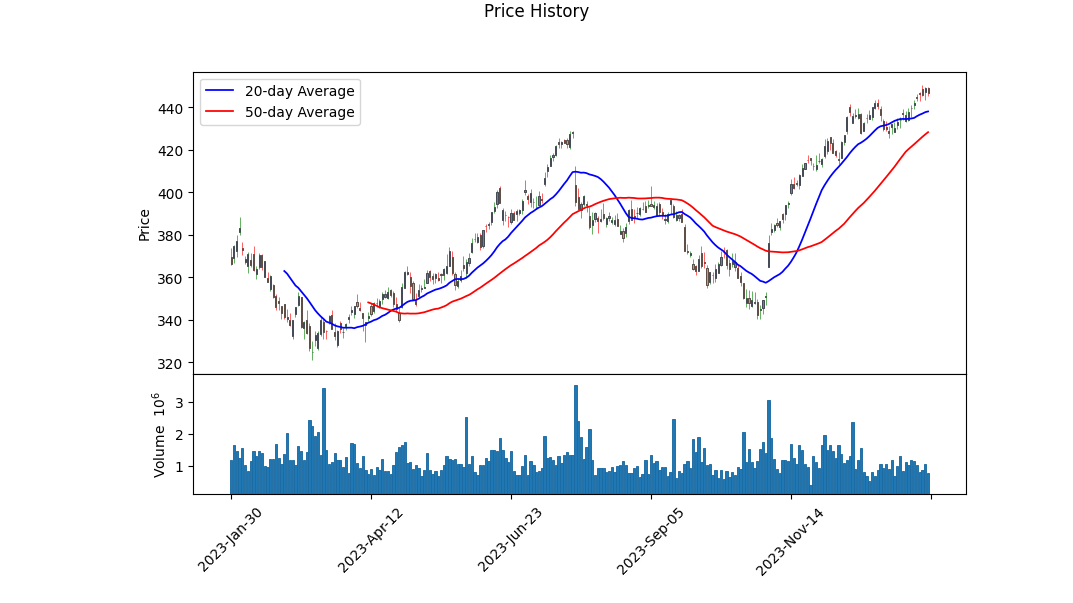
Technical analysis of SPGI's last day of trading suggests that the stock is undergoing a volatile phase. Over the past few trading sessions, the stock price has experienced fluctuations with a noticeable uptick towards the last trading day. The On-Balance Volume (OBV) indicator shows accumulation, as evidenced by its increase to 2.69952 million, which could be considered a bullish signal. The Moving Average Convergence Divergence (MACD) histogram is positive and trending upwards, suggesting that the current momentum could persist in the short-term.
However, combining this technical assessment with a review of risk-adjusted performance metrics unveils a concerning picture. Negative Sharpe and Sortino ratios signal poor risk-adjusted returns, with the latter penalizing the downside volatility severely. The Treynor Ratio, while positive, does not correct for the massive underperformance indicated by the other metrics. The Calmar Ratio stands out as the lone strong positive, suggesting that the return per unit of downside risk is reasonable.
After reviewing company fundamentals, a mixed outlook is presented. Gross, EBITDA, and operating margins are robust, which bodes well for the operational efficiency of the company. Yet, a glance at the balance sheets reveals a high net debt position, although this isn't necessarily alarming for a company with strong cash flows. Analyst expectations project an optimistic future, with a consensus on earnings growth over the following year.
The cash flow statements portray a company with a strong capacity to generate free cash flow, despite significant repurchases of capital stock. This financial strength could allow for continued investment and return of value to shareholders.
In consideration of these variables, an anticipation of stock price performance requires caution. Although the company is fundamentally sound and growing, the negative risk-adjusted return metrics cannot be ignored. Should the rising MACD confirm a bullish phase, coupled with analyst growth estimates, there may be a short-term rise in the stock price. Nevertheless, the poor performance on a risk-adjusted basis implies that the stock may not be adequately compensating for the risks being undertaken.
Predominantly, these risk metrics should not be overlooked, as they reflect underlying volatility and potential downturns that may not be immediately apparent from the raw financial statements or current analyst optimism. Investors may be well-advised to prepare for potential short-term gains while remaining vigilant of any shifts that could trigger the adverse conditions suggested by some of the risk measures. This is especially true in a market environment that continues to navigate uncertainties, thereby potentially inflating the impact of negative events on stock prices.
| Statistic Name | Statistic Value |
| R-squared | 0.579 |
| Adj. R-squared | 0.579 |
| F-statistic | 1,729 |
| Prob (F-statistic) | 2.62e-238 |
| Log-Likelihood | -2,022.1 |
| AIC | 4,048 |
| BIC | 4,058 |
| Coefficient (const) | 0.0216 |
| Std Err (const) | 0.034 |
| t (const) | 0.632 |
| P>|t| (const) | 0.527 |
| [0.025 (const) | -0.045 |
| 0.975] (const) | 0.089 |
| Coefficient (SPGI) | 1.0780 |
| Std Err (SPGI) | 0.026 |
| t (SPGI) | 41.583 |
| P>|t| (SPGI) | 0.000 |
| [0.025 (SPGI) | 1.027 |
| 0.975] (SPGI) | 1.129 |
| Omnibus | 202.698 |
| Prob(Omnibus) | 0.000 |
| Skew | -0.124 |
| Kurtosis | 10.836 |
| Cond. No. | 1.32 |
In examining the linear regression model between SPGI (S&P Global ratings, part of the stock market) and SPY (a tracker of the S&P 500 and therefore a representation of the entire market), the model reveals an interesting dynamic between these assets. Alpha, often considered a measure of a stocks performance on a risk-adjusted basis, is valued at 0.0216 in this model. However, with a p-value of 0.527 for alpha, this indicates that there is not a statistically significant difference from zero, suggesting that the model does not conclusively assert that SPGI has a positive alpha. The emphasis on alpha in this context is the additional return expected from the SPGI beyond what the market itself would offer.
Furthermore, the R-squared value for this regression is 0.579, indicating that roughly 57.9% of the variability in SPGI can be explained by the market index (SPY). A strong F-statistic (1,729) with an essentially zero probability value signals the overall model is statistically significant, with the independent variable (SPY) collectively having a meaningful impact on SPGI. Despite the relatively high R-squared, the lack of evidence supporting a significant alpha points towards SPGI's returns being closely tied to the markets performance, without strong indications of abnormal performance.
Summary of S&P Global Inc.'s Third Quarter 2023 Earnings Call:
Introduction and Highlights: The call began with introductions by Mark Grant, Senior Vice President of Investor Relations. Doug Peterson, President and CEO, provided the highlights for the third quarter, which showed an 11% growth in revenue (excluding Engineering Solutions), acceleration in every division, and a 100 basis point margin expansion despite certain headwinds. Adjusted EPS grew by 10% year-over-year, and the adjusted EPS guidance was raised by $0.10 at the midpoint. Peterson also mentioned the rapid pace of product launches, the strategic growth areas, and the Vitality Index reaching 12% in revenue contribution. AI initiatives were briefly discussed with further updates promised in the next quarter.
Financial Performance: Ewout Steenbergen, EVP and CFO, explained the financial details, emphasizing the non-GAAP adjusted metrics and noting significant year-over-year growths in revenues, profit margins, and reductions in the diluted share count. He stressed the company's progress with cost synergies ($149 million) and revenue synergies ($25 million), the path to achieving a $600 million run rate for cost synergies, and a $112 million annualized run rate for revenue synergies by year-end.
Revenue growth was led by the Ratings division, benefitting from high-yield and bank loan market activity, while the Market Intelligence division saw strong growth in subscription-based offerings and Enterprise Solutions. Adjusted expenses were up due to compensation expenses, but overall, S&P Global demonstrated disciplined expense management.
Business Segment Performance and Outlook: - Market Intelligence saw an 8% revenue increase with strong performance in Data & Advisory Solutions and Enterprise Solutions. Full-year revenue growth expectations were tightened to 6.5% - 7.5%. - Ratings revenue increased by 20%, with strong growth in transaction revenue due to the bank loan and high-yield markets. Full-year revenue guidance was adjusted to 6% - 8% growth. - Commodity Insights revenue increased by 11%, with Price Assessments and Energy & Resources Data & Insights driving growth. The full-year revenue guidance range was raised to 8.5% - 9.5%. - Mobility's revenue increased by 10% due to growth in the dealer segment and financials. Guidance for revenue growth was narrowed to 9% - 10%. - S&P Dow Jones Indices saw a 6% revenue increase, with asset-linked fees up 4%, and exchange-traded derivative volumes grew by 18%.
Closing Remarks: Martina Cheung, President of S&P Global Ratings, joined the Q&A session. Doug Peterson concluded the call with a commendation to the team for their performance and for advancing the integration with IHS Markit. He expressed confidence in the company's trajectory and thanked participants for their questions and engagement.
Overall, S&P Global Inc. demonstrated robust financial performance, effective cost synergy realization, acceleration in strategic growth initiatives, and a strong outlook underscored by innovative new product launches and ongoing investments. The firm remained committed to delivering value in all market conditions and anticipated strong results for the rest of 2023.
S&P Global Inc.'s (SPGI) 10-Q filing, dated October 27, 2023, reported comprehensive financial and operational results for the third quarter and the nine months ended September 30, 2023. The company operates through multiple segments including Market Intelligence, Ratings, Commodity Insights, Mobility, and Indices, with a notable divestiture of Engineering Solutions as of May 2, 2023, sold to a company controlled by funds affiliated with Kohlberg Kravis Roberts & Co. L.P. (KKR).
Revenue for the third quarter was $3,084 million compared to $2,861 million for the same period in 2022. For the nine months ended September 30, total revenue increased to $9,345 million from $8,244 million in the prior year. Total expenses for the quarter edged up slightly to $2,018 million from $2,012 million the previous year, with a full nine-month period comparison resulting in a rise to $6,179 million up from $5,934 million. Operating profit for the third quarter of 2023 was $1,074 million, showing considerable growth compared to $853 million in the same quarter the prior year, while full nine-month operating profit stood at $3,130 million compared to $4,228 million, influenced by gains on divestitures in 2022.
Interest expense, net of $84 million for the quarter, increased compared to $71 million in the same period last year, with a nine-month figure also up to $258 million from $218 million. A loss on extinguishment of debt of $15 million was recorded for the nine months ended September 30, 2022, while there was none for the comparable period in 2023.
Income before taxes was $995 million for the quarter versus $823 million, with a nine-month period totalling $2,877 million, down from $4,081 million primarily due to tax charges on merger-related divestitures and deal-related costs the previous year. Subsequently, the provision for income taxes followed a similar trend with $181 million for the quarter, up from $145 million, and $628 million for nine months, displaying a decrease from the $1,053 million in the prior year.
Net income attributable to SPGI was $742 million for the quarter, showing an increase compared to $608 million in the third quarter of 2022. The net income attributable for the nine months was $2,047 million, featuring a decline from $2,815 million the previous year which included the impact of divestitures.
SPGIs consolidated balance sheet as of September 30, 2023, reported total assets of $60,561 million, a slight decrease from $61,784 million at the end of the previous year. Total liabilities were $21,537 million, showing a decrease from $22,040 million. Redeemable noncontrolling interest was recorded at $3,510 million as of the report date, showing an increase from $3,267 million as of the end of the previous year.
SPGI's cash flows from operations remained strong, providing $2,376 million in the nine months, compared to $1,490 million in the same period of 2022. Investing activities yielded a positive cash flow of $607 million mainly due to proceeds from dispositions, contrasting with the $3,689 million inflow the previous year which included significant divestiture activities. Financing activities showed a cash use of $2,602 million, contrasting with a cash use of $10,128 million in the prior year due to share repurchases and dividend payments.
The company's effective tax rate for the quarter was relatively consistent at 18.2%, whereas for the nine months ended September 30, the rate fell to 21.8% from 25.8% the prior year. This fluctuation was attributed to various discrete adjustments and the impact of considerable divestiture activities.
Stock repurchases remain a part of SPGI's capital allocation strategy with approval of a new 2022 Repurchase Program for 30 million shares. The company remained active in returning value to shareholders, increasing its quarterly dividend to $0.90 per share in 2023, and executing share repurchases of $2,001 million in the nine months under review.
SPGI's 10-Q filing reflects a robust business model capable of delivering consistent revenue growth across diversified streams, while managing expenses and cash flow effectively. The strategic divestiture of Engineering Solutions aligns the companys focus on its core business segments, and the repurchase program indicates a shareholder-centric approach to capital management. The solid operational performance and financial positioning allow SPGI to navigate the economic landscape while investing in growth opportunities and committing to shareholder returns.
S&P Global Inc., a preeminent provider of ratings, benchmarks, analytics, and data to capital and commodity markets, has been advancing its offerings through strategic moves and collaborative efforts. Significantly, S&P Global Market Intelligence, a division of S&P Global Inc., announced the incorporation of Nikkei's news into its S&P Capital IQ Pro platform. This move, reported on January 23, 2024, exemplifies the company's commitment to enriching its analytics and insights, especially in the Asia-Pacific (APAC) region. Through the partnership with Nikkei, known for its authoritative financial reportage, the enhanced platform aims to deliver deeper market understanding and enable informed decision-making for finance professionals.
On the performance front, S&P Global has demonstrated commendable market behavior with its stock surpassing the industry growth over a six-month period, accentuated by a long-term EPS growth rate of 13.13%. This upward trajectory is the result of both strategic acquisitions, such as those of Market Scan Information Systems and ChartIQ, and the landmark merger with IHS Markit, which broadened the reach of its data and analytical services. Moreover, the company has been proactive in launching innovative services across different divisions, notably Platts and S&P Global Market Intelligence.
The integration with Nikkei, together with an astute acquisition strategy and service expansion, has positively influenced S&P Global's market ranking. It secured a coveted Zacks Rank #2 (Buy), based on the Zacks Equity Research report, suggesting strong investment potential fostered by its enhanced content offerings and analytical capabilities.
Illustrative of its prominence within the financial information sector, S&P Global recently reported on the U.S. auto sales for January 2024, revealing a moderated start to the year. S&P Global Mobility, the division responsible for the report, forecast the sales pace and inventory dynamics, indicating a careful yet optimistic outlook based on production recovery. This analysis provides valuable insights for stakeholders in the auto industry and reflects the company's capacity to decipher market trends.
In parallel to its market analytics activities, S&P Global was placed in the limelight regarding stock movements and investor behavior. The stock index futures on January 24, 2024, suggested that the media streaming and semiconductor sectors' positive earnings reports positively affected S&P Global's presence in the market, according to Reuters reporters Ankika Biswas and Johann M Cherian.
The S&P Global Ratings' recent launch of a research product focusing on the secondary market for leveraged loans is yet another example of the company's innovative spirit, providing data-driven insights via "RatingsDirect" on the S&P Global website. The report assesses market liquidity and dynamics, offering crucial information for market health and investment strategies.
Additionally, the company's impressive record of 50 years of dividend growth underscores its financial strength and investor appeal. As of January 23, 2024, it declared a quarterly dividend of $0.90 per share, with a notable five-year average payout ratio of 28.6%. These figures appeal to income-focused investors and reflect the companys sustainable and prudent approach to shareholder rewards.
Similarly, S&P Dow Jones Indices, another division under the S&P Global umbrella, continues to champion market benchmarking. Following its annual review, the division announced updates to the S&P/TSX Canadian Dividend Aristocrats Index, indicative of its commitment to maintaining accurate and relevant indices for investors and market watchers.
Investor expectations around S&P Global have been heightened with the release of projections for significant earnings in fiscal 2024 and the positive indicators in the Purchasing Managers Index readings, which contribute to a bullish outlook for the company. Such robust earnings forecasts, strategic growth initiatives, and favorable industry rank make S&P Global an appealing prospect for investment consideration.
Lastly, the division automotiveMastermind, as part of S&P Global Mobility, is advancing the utilization of data within dealerships through enhancements to its Mastermind technology. The introduction of new integrations with dealership management and CRM systems, leveraging predictive analytics and AI tools, promises to elevate the consumer experience and optimize marketing within the automotive retail space.
S&P Global Inc. continues to reflect strength in its core areas of business, while its divisions drive innovation and expand the company's reach into various market segments, exemplifying a dynamic enterprise at the confluence of financial intelligence provision and technological advancement.
S&P Global Inc. (SPGI) experienced volatility from January 2019 to January 2024 that can be summarized as follows: The model used to evaluate the volatility, known as the ARCH (Autoregressive Conditional Heteroskedasticity) model, did not detect any direct relationship between past returns and future returns, as indicated by an R-squared of 0.000. The estimated coefficient for the constant volatility term (omega) was significant, suggesting a baseline level of fluctuation in the returns of SPGI. Additionally, the alpha coefficient was also significant, indicating that past volatility impacted future volatility during this period.
Here are the key features of the volatility described:
- The R-squared value near zero suggests that the volatility of SPGI is not explained by its own past returns, indicating a lack of predictability using past return data.
- The
omegacoefficient indicates a fundamental volatility level present in the returns. - The
alphaterm signifies the impact of past volatility on current volatility, though this effect is not predictable from past returns.
Below is the HTML table presenting the ARCH model results without timestamps:
| Statistic Name | Statistic Value |
|---|---|
| Mean Model | Zero Mean |
| R-squared | 0.000 |
| Adj. R-squared | 0.001 |
| Log-Likelihood | -2447.63 |
| AIC | 4899.26 |
| BIC | 4909.53 |
| No. Observations | 1,257 |
| omega | 2.0729 |
| alpha[1] | 0.4258 |
To analyze the financial risk of a $10,000 investment in S&P Global Inc. (SPGI) over a one-year period, we integrate volatility modeling and machine learning predictions.
The first step in the assessment involves volatility modeling, which is fundamental to understanding how the price of SPGI stock fluctuates over time. These models are adept at capturing the temporal clustering of volatility a commonly observed phenomena in financial time series where high-volatility events tend to follow each other, likewise for low-volatility periods. This model takes historical stock price data to estimate future levels of volatility, projecting that there may be periods where the price of SPGI could experience significant movement either upwards or downwards.
Further insights are derived from machine learning predictions, in which historical data is used to train an algorithm capable of identifying complex patterns and relationships that influence stock performance. Here, a machine learning model is trained to predict future stock returns based on current and past information. This technique adds value by factoring in numerous variables and their interactions, potentially enhancing the prediction accuracy of future stock returns and their associated risks.
Combining the findings from the volatility model with machine learning predictions provides a multi-dimensional view of potential future scenarios. By correlating predicted stock returns with the estimated volatility, it is possible to gauge the investment risk more accurately.
Based on the integrated results from both methods, the calculated Value at Risk (VaR) for a $10,000 investment in SPGI over one year stands at $214.85 with a 95% confidence level. This represents the potential loss which should not be exceeded with a probability of 95% over the coming year, according to the modeled risk. It implies that, under normal market conditions, there is only a 5% chance that an investor would experience losses exceeding $214.85 on their $10,000 investment over the course of the year.
This blended approach of volatility modeling and machine learning predictions underlines the inherent risks within equity investment, showing that while the potential for profit exists, there is also a quantifiable risk of loss. The VaR figure gives investors an indication of the upper threshold of expected financial risk associated with their investment in a given confidence interval, guiding decision-making with a clarified assessment of downside exposure.
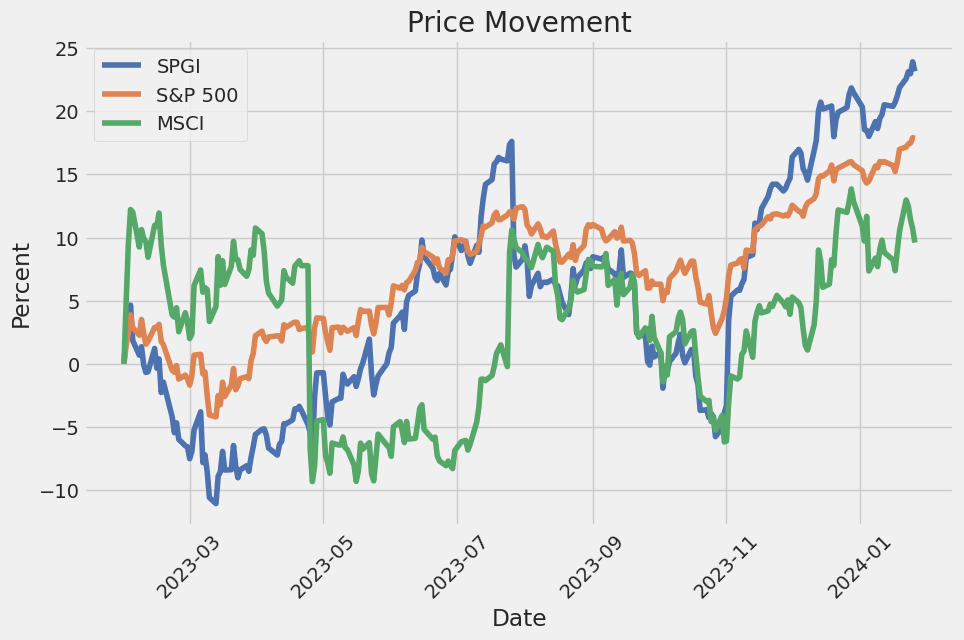
Similar Companies in Financial Data & Stock Exchanges:
MSCI Inc. (MSCI), Nasdaq, Inc. (NDAQ), Intercontinental Exchange, Inc. (ICE), CME Group Inc. (CME), Moody's Corporation (MCO), FactSet Research Systems Inc. (FDS), Morningstar, Inc. (MORN), Verisk Analytics, Inc. (VRSK)
https://seekingalpha.com/article/4658149-12-stocks-i-hope-to-buy-if-the-market-crashes
https://finance.yahoo.com/news/us-stocks-futures-rise-boost-130302148.html
https://finance.yahoo.com/news/p-global-mobility-january-2024-131500683.html
https://finance.yahoo.com/news/us-stocks-p-500-eyes-141650905.html
https://finance.yahoo.com/news/10-dividend-stocks-sustainable-payout-200827049.html
https://finance.yahoo.com/news/p-dow-jones-indices-announces-221500258.html
https://finance.yahoo.com/news/p-global-ratings-secondary-market-160400150.html
https://finance.yahoo.com/news/5-stocks-watch-recent-dividend-131600909.html
https://www.sec.gov/Archives/edgar/data/64040/000006404023000193/spgi-20230930.htm
Copyright © 2024 Tiny Computers (email@tinycomputers.io)
Report ID: BujeoQP
Cost: $0.82810
https://reports.tinycomputers.io/SPGI/SPGI-2024-01-27.html Home