SPDR Portfolio S&P 600 Small Cap ETF (ticker: SPSM)
2023-12-30
 The SPDR Portfolio S&P 600 Small Cap ETF (ticker: SPSM) is an exchange-traded fund designed to provide investment results that correspond generally to the total return performance of the S&P SmallCap 600 Index. This index comprises 600 small-capitalization U.S. companies, which provides a broad representation of small-cap market performance. Managed by State Street Global Advisors, SPSM aims to offer investors diversified exposure to the small-cap segment of the market, which is known for its higher growth potential compared to larger, more established companies. The ETF employs a passive management or indexing strategy and seeks to track the performance of the index as closely as possible before expenses. SPSM offers the benefits of low expense ratios, liquidity, and the convenience of trading like a single stock. As of the knowledge cutoff date, the ETF is a popular choice for investors looking to tap into the potential of smaller companies within the United States equity market.
| Previous Close | 42.73 | Open | 42.67 | Day Low | 42.16 |
| Day High | 42.74 | Trailing P/E | 13.34 | Volume | 2,460,709 |
| Average Volume | 1,595,720 | Average Volume 10 days | 2,083,910 | Bid | 42.18 |
| Ask | 42.81 | Bid Size | 1,100 | Ask Size | 1,000 |
| Yield | 0.014 | Total Assets | 8,416,976,384 | 52 Week Low | 34.17 |
| 52 Week High | 43.02 | 50 Day Average | 38.0574 | 200 Day Average | 37.8684 |
| NAV Price | 42.71777 | YTD Return | 0.176 | Beta 3 Year | 0.99 |
| Three Year Average Return | 0.0753 | Five Year Average Return | 0.1205 |
 Based on the provided Technical Analysis (TA) data and fundamentals for SPSM, we observe a few key indicators that can help inform the potential movement of the stock price in the coming months.
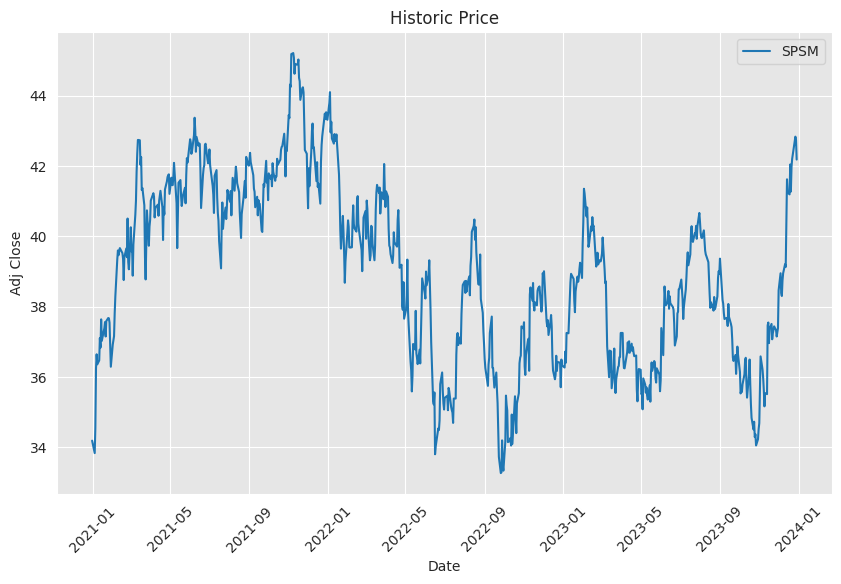
Key Technical Indicators: - The stock has been trending upwards, as evidenced by the series of higher lows and higher highs in the past few months. - The Parabolic SAR (PSAR) currently indicates a bullish trend, with the dots (PSARl_0.02_0.2) below the price for the last observed sessions. However, the flip of PSAR on the last day to a short signal (PSARs_0.02_0.2) can be a sign for potential trend reversal. - The On-Balance Volume (OBV) shows an increase in volume on up days and is indicative of positive sentiment, as it has grown from 0.11273 million to 0.79767 million over the selected period. - The Moving Average Convergence Divergence (MACD) histogram values are declining, suggesting that the bullish momentum may be losing strength.
Fundamental Aspects: - The trailing Price-to-Earnings (PE) ratio stands at an attractive level of 13.34, which could be favorable if the market views it as undervalued. - The stock has seen a year-to-date (YTD) return of approximately 17.6%, outperforming many of its peers, indicating positive sentiment towards its performance. - Total assets under management are significant, reflecting trust and sizeable investment in the ETF. - The fiftyTwoWeekLow and fiftyTwoWeekHigh show a wide range in the past year, with the current price near the 52-week high, suggesting a strong uptrend.
Price Movement Analysis: Considering the information at hand, while recent sessions have shown bullish behavior, the slight downturn on the last trading day alongside a declining MACD histogram raises caution for a potential consolidation or pullback in the near term. However, the overall uptrend observed in the previous months might still be intact.
In the medium term, if the stock maintains its support levels above the 50-day and 200-day moving averages, we could expect continued bullish sentiment. However, any significant breaks below these averages might suggest a re-evaluation of the bullish case.
Short-term Outlook: In the immediate future, traders should watch for the PSAR indicator closely. If PSAR flips back to bullish or the price surpasses the last PSAR short level, it could indicate the continuation of the uptrend. It is also crucial to monitor the OBV, as any significant divergence from the price movement might signal a shift in sentiment.
Mid-term Outlook: For the next few months, considering the solid YTD return and attractive PE ratio, the fundamentals could continue to support the bullish sentiment if corporate profits and the macroeconomic environment remain steady. However, prices being at the higher end of the 52-week range means that any negative news or market sentiment shifts could lead to profit-taking and price correction.
Investors should regularly evaluate both technical indicators and market sentiment, and consider the overall trend in conjunction with volume patterns and the MACD histogram. While the longer-term trajectory appears positive, short-term fluctuations are likely, therefore careful monitoring of the indicators and market conditions is recommended for potential strategy adjustments.
Investors often seek to diversify their financial portfolios by including a variety of assets. Among these assets, Exchange Traded Funds (ETFs) have gained popularity for their lower expense ratios and ease of trading. The SPDR Portfolio S&P 600 Small Cap ETF (SPSM) provides a means for investors to gain exposure to the small-cap sector of the U.S. equity market. This ETF is designed to track the performance of the S&P SmallCap 600 Index and is well-suited for investors seeking to capitalize on the potential of small-cap stocks.
Recent economic data has given rise to optimism among some market participants. The reported jobless claims have significantly dropped to 202,000, as noted by Bespoke Investment Group. This figure is one of the lowest levels recorded since the year before and represents a cooling off from earlier jobless claims estimates of 221,000. These initial claims highlight a potentially strong labor market, a factor that could have important implications for funds like SPSM which involve smaller companies that may benefit from a healthier economic environment.
Continuing claims provide another layer of insight into the labor market, painting a more complex picture. Over the past few months, the total number of continuing claims has elevated, reaching 1.876 million from 1.658 million. While this could suggest an increase in longer-term joblessness, the figure is still below the mid-November peak of 1.925 million. Despite the rising continuing claims, the historical context reveals unadjusted claims at remarkably low levels, with the current unadjusted figure of 248,300 touted as the lowest for the same week since 1969.
Taking these economic factors into account is vital when examining investment vehicles like SPSM. Bespoke Investment Group, led by experienced analysts Paul Hickey and Justin Walters, is renowned for their analytically rich financial content, offering detailed investment analyses that can be immensely helpful for investors exploring options in small-cap ETFs.
For an in-depth view of the SPDR Portfolio S&P 600 Small Cap ETF, let us examine the fund's composition beginning with its top ten holdings:
| company | symbol | percent |
|---|---|---|
| Rambus Inc | RMBS | 0.73 |
| Comfort Systems USA Inc | FIX | 0.68 |
| e.l.f. Beauty Inc | ELF | 0.63 |
| SPS Commerce Inc | SPSC | 0.62 |
| Applied Industrial Technologies Inc | AIT | 0.61 |
| Ensign Group Inc | ENSG | 0.59 |
| Fabrinet | FN | 0.58 |
| ATI Inc | ATI | 0.56 |
| Meritage Homes Corp | MTH | 0.51 |
| DXC Technology Co Registered Shs When Issued | DXC | 0.47 |
This representation of the ETF's portfolio demonstrates that it is well-diversified among various sectors, with companies like Rambus Inc and Comfort Systems USA Inc leading the pack. These sectors are likely to respond differently to economic changes and could potentially benefit from the trends within the labor market and beyond.
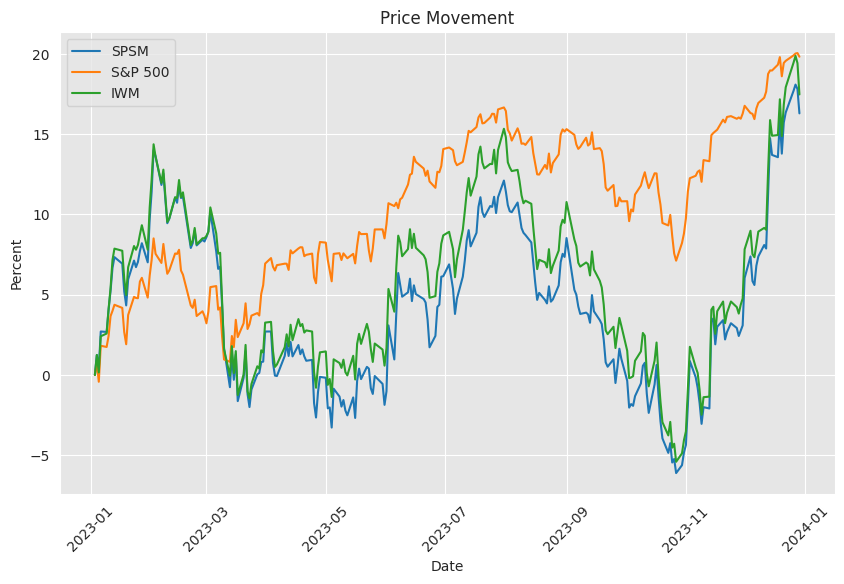
In the broader market context, Sanjeev Sharma's prediction for the S&P 500 to potentially reach the 6000 mark by the end of 2024 also influences the small-cap market. This prediction, primarily based on the Sharma Disposable Income Formula, takes into consideration several macroeconomic factors such as wages, interest rates, home prices, and inflation. A robust consumer-led U.S. economy, evidenced by an incremental annual increase in the population, particularly in states like Texas, bolsters this positive outlook. GenerationType: Plain Text
Government spending is also predicted to swell in the election year of 2024, historically providing an economic impetus. Wage growth, though decelerating from previous years, is expected to continue at around 5% per year. Inflation, which had peaked, is projected to be reined in to the Federal Reserve's target rate by the end of 2024, thanks to the central bank's aggressive measures. Meanwhile, a modest uptick in gas prices, buoyed by global growth dynamics and pre-election fiscal measures, further complicates the economic outlook.
The expectation of a modest increase in home prices by about 5% throughout 2024, aligned with a continued consumer confidence and housing demand, is another positive factor in play. Taking these factors together, Sharma presents both an optimistic and a pessimistic scenario for the S&P 500, with an average of a projected 21% increase potentially lifting the index to around 5800 from its current levels, with an optimistic outlook exceeding 6000. While these points offer a tentative roadmap for the S&P 500's trajectory, they also have implications for small-cap stocks and, by extension, SPSM. However, it is emphasized that past performance is not indicative of future results and should not be taken as investment advice.
The climate of uncertainty that often accompanies investment landscapes necessitates a nuanced understanding of how short-term market movements relate to long-term macroeconomic themes. The equity market has illustrated some optimism, suggesting a potential 'soft landing' from economic pressures. This climate has been indicated by rallying stock indices and a decrease in the yield of the 10-year Treasury note. These signals point towards a sentiment that central banks, such as the Federal Reserve, may be concluding their tightening cycles in the face of moderating inflation and wagesan outlook that could shape investment strategies for small-cap ETFs like SPSM moving forward.
However, concerns such as the significant US budget deficit and broader global economic issues continue to loom large, which could lead to clashes with the short-term market optimism. Added to this are the potential implications of the upcoming election cycle, expected to drive increased fiscal spending, and the need to manage an unprecedented volume of maturing government debt.
Within the realm of consumer behavior and small businesses, there are resilience indicators despite the broader economic concerns. Small businesses demonstrate less susceptibility to interest rate fluctuations, given fixed-rate mortgage debts below current rates. Large corporations have capitalized on low rates during the pandemic to extend debt maturities, thus providing them a cushion against short-term market fluctuations. Additionally, consumer debt is growing, yet when considered as a percentage of disposable income, it remains below alarming levels historically.
Similar Companies in Exchange-Traded Fund:
iShares Russell 2000 ETF (IWM), Vanguard Small-Cap ETF (VB), iShares Core S&P Small-Cap ETF (IJR), Schwab U.S. Small-Cap ETF (SCHA), Vanguard Small-Cap Growth ETF (VBK), Vanguard Small-Cap Value ETF (VBR), iShares S&P Small-Cap 600 Growth ETF (IJT), iShares S&P Small-Cap 600 Value ETF (IJS), First Trust Small Cap Core AlphaDEX Fund (FYX), WisdomTree U.S. SmallCap Fund (EES)
News Links:
https://seekingalpha.com/article/4659629-fed-going-to-put-big-hurt-on-everyone-2024
https://seekingalpha.com/article/4659417-sp-500-prediction-2024-6000-year-end
https://seekingalpha.com/article/4658186-wall-street-investing-2-different-worlds
https://seekingalpha.com/article/4658005-claims-cooling-down
https://seekingalpha.com/article/4658290-you-will-get-too-bullish-in-2024
https://seekingalpha.com/article/4658265-fed-strategic-bluff-or-massive-blunder
https://finance.yahoo.com/video/why-investors-betting-actively-managed-184242483.html
https://seekingalpha.com/article/4659750-5-big-market-predictions-for-2024
https://seekingalpha.com/article/4659409-massive-market-bubble-may-burst-as-volatility-is-unleashed
https://www.fool.com/retirement/2023/12/19/3-ways-to-grow-100000-into-1-million-retirement/
Copyright © 2023 Tiny Computers (email@tinycomputers.io)
Report ID: cLuEaH
https://reports.tinycomputers.io/SPSM/SPSM-2023-12-30.html Home