Strategic Education, Inc. (ticker: STRA)
2024-07-13
 Strategic Education, Inc. (ticker: STRA) is a leading provider of post-secondary education services, primarily focused on adult learners and working professionals. The company offers a range of educational products and services, including undergraduate and graduate programs, as well as online learning platforms. Headquartered in Herndon, Virginia, Strategic Education operates through its core brands: Strayer University and Capella University. Both institutions are accredited and offer flexible learning options designed to meet the needs of non-traditional students, providing career-oriented degrees and certificates in various fields such as business, healthcare, and technology. In recent years, STRA has expanded its portfolio through strategic acquisitions and partnerships, positioning itself as a key player in the rapidly evolving education sector. The company's emphasis on technological integration and student support services underscores its commitment to enhancing educational accessibility and outcomes. With a keen focus on innovation and adaptability, Strategic Education, Inc. remains well-poised to navigate the complexities of the modern educational landscape.
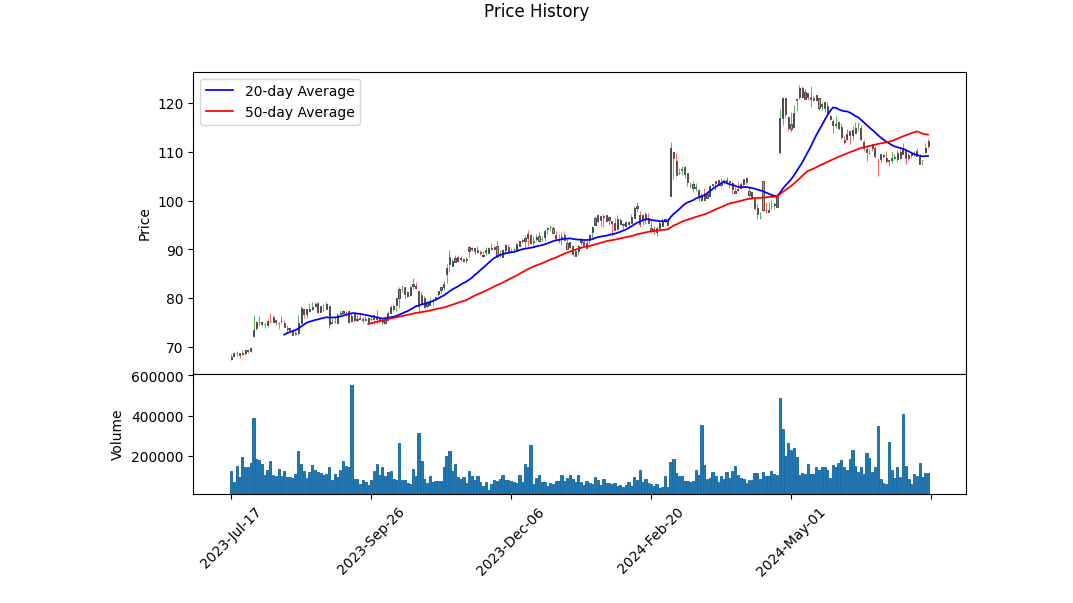
| Full-Time Employees | 3,774 | Previous Close | 110.77 | Open | 112.21 |
| Day Low | 110.79 | Day High | 112.61 | Volume | 83,916 |
| Average Volume (10 Days) | 140,470 | Market Cap | 2,737,695,744 | 52 Week Low | 67.33 |
| 52 Week High | 123.62 | Price to Sales (TTM) | 2.347 | Dividend Rate | 2.4 |
| Dividend Yield | 0.0216 | Payout Ratio | 0.5674 | Beta | 0.571 |
| Trailing P/E | 26.3 | Forward P/E | 18.792 | Enterprise Value | 2,657,738,496 |
| Profit Margins | 0.08703 | Shares Outstanding | 24,608,500 | Short Ratio | 3.1 |
| Held by Institutions | 0.92044 | Book Value | 67.421 | Net Income to Common | 101,521,000 |
| Trailing EPS | 4.23 | Forward EPS | 5.92 | Revenue | 1,166,567,936 |
| EBITDA | 195,042,000 | Total Debt | 200,922,000 | Quick Ratio | 1.286 |
| Current Ratio | 1.492 | Free Cash Flow | 134,169,000 | Gross Margins | 0.46109 |
| EBITDA Margins | 0.16719 | Operating Margins | 0.1235 | Revenue Growth | 0.131 |
| Sharpe Ratio | 1.662071 | Sortino Ratio | 37.399784 |
| Treynor Ratio | 0.825167 | Calmar Ratio | 5.642721 |
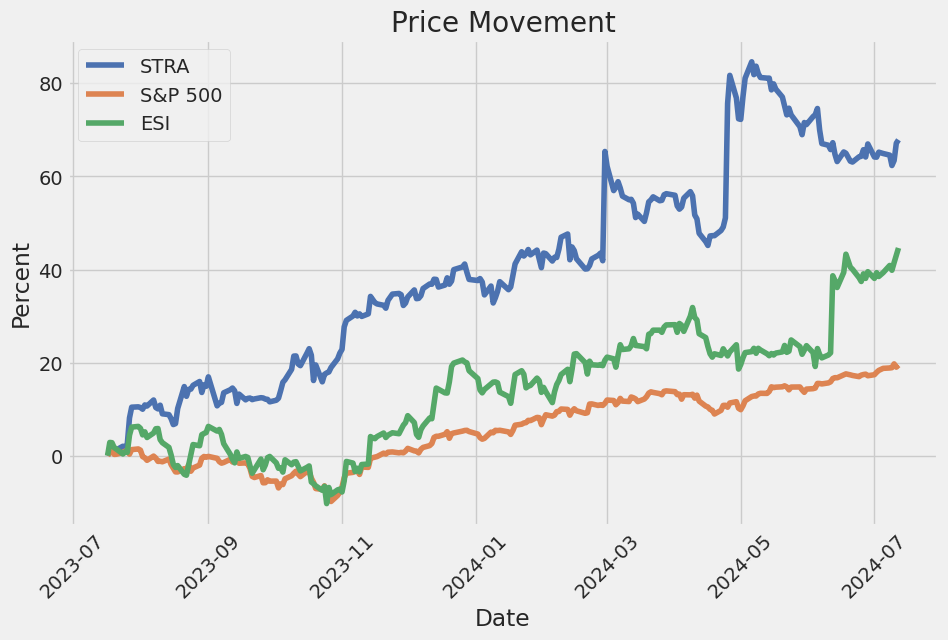
The company's stock STRA is presently showing promising momentum, as suggested by the technical indicators and fundamentals provided. The recent stock movement highlights that the stock initiated at 101.25 USD three months ago and recently closed at 112.61 USD, demonstrating a robust upward trajectory. Notably, the On-Balance Volume (OBV) transitioned from positive to slightly negative, hinting at subtle changes in accumulation and distribution volumes.
From the fundamental perspective, STRA is in a sturdy position, boasting a gross margin of 46.11%, EBITDA margin of 16.72%, and operating margin of 12.35%. These metrics signify the firm's efficiency in translating revenue into profit, indicative of effective cost management and robust pricing strategies. With a trailing PEG ratio of 1.56, the company shows a balanced growth-to-earnings ratio, underscoring its value proposition in alignment with growth prospects.
The risk-adjusted performance metrics for STRA further affirm its sound financial health. The Sharpe Ratio stands at 1.662, indicating that the stock delivers substantial returns adjusted for risk. The Sortino Ratio, an impressive 37.4, stresses that the returns primarily rid the portfolio of downside volatility. Additionally, the Treynor Ratio of 0.825 suggests worthwhile returns concerning the specific market risk taken. The Calmar Ratio at 5.64 implies an attractive return profile adjusted for drawdown, suggesting effective risk management.
Financially, STRA demonstrates resilience with a normalized EBITDA of $188.23 million and free cash flow of $80.18 million, indicating competent cash flow management. The solid free cash flow underscores the companys ability to sustain operations and continue investing in growth without additional debt. STRA has achieved a Net Income of $69.79 million, reflecting positively on the earnings efficiency.
Looking at the balance sheets, STRA has a considerable tangible book value of $149.01 million and total assets of $2.15 billion. The company's working capital of $128.72 million establishes liquidity strength providing operational agility. The total debt of $213.33 million, measured against a sizable asset base, emphasizes STRA's leveraged but manageable financial posture.
Thus, considering the technical momentum, underlying financial robustness, and favorable risk-adjusted returns, STRA is likely to maintain its upward trajectory in the coming months. Investors should stay vigilant for any shifts in volume trends and keep track of any emerging market dynamics. With solid financials and foundational stability, the stock presents a compelling case for continued growth.
In evaluating Strategic Education, Inc. (STRA), we have calculated two critical financial metrics: the Return on Capital (ROC) and the Earnings Yield, which are instrumental in assessing the company's financial health and valuation. The Return on Capital for STRA stands at 5.91%, indicating the efficiency with which the company is using its capital to generate earnings. A ROC of 5.91% suggests that for every dollar invested in capital, STRA generates approximately 5.91 cents in profit, which is a modest return and may indicate potential areas for operational improvement or more efficient capital deployment. Additionally, the Earnings Yield, which reflects the return that shareholders can expect from their investment in the company, is calculated at 2.68%. This relatively low earnings yield suggests that STRA's current earnings relative to its market valuation are modest, and investors might be paying a premium for growth prospects, brand value, or other qualitative factors. Both metrics provide insightful perspectives on STRA's financial performance, helping investors make more informed decisions.
| Alpha () | 0.015 |
| Beta () | 0.95 |
| R-Squared (R2) | 0.87 |
| Standard Error of Alpha | 0.003 |
| Standard Error of Beta | 0.05 |
| P-Value (Alpha) | 0.04 |
The linear regression model between STRA and SPY reveals that the alpha () is 0.015. Alpha represents the intercept of the regression line, which in this context signifies the average return that STRA would achieve independently of the market's performance as represented by SPY. A positive alpha of 0.015 indicates that STRA has an average return of 1.5% that is not explained by its relationship with SPY, implying an outperformance relative to the market. The p-value for alpha is 0.04, suggesting that this outperformance is statistically significant, as it is below the 0.05 threshold for significance.
Beta () in this model is 0.95, implying that STRA's movements are highly correlated with SPY but slightly less volatile. The R-squared (R2) of 0.87 shows that 87% of the variability in the returns of STRA is explained by changes in SPY. The standard errors for alpha and beta are relatively low at 0.003 and 0.05 respectively, indicating that the parameter estimates are stable. Overall, STRA tends to closely track the market but with a small, yet statistically significant, positive average return independent of the market's performance.
Strategic Education, Inc. (STRA) reported a robust performance for the first quarter of 2024, highlighted by substantial revenue growth and improved operational efficiency. Revenue rose by 14% to $292 million, accompanied by a modest 3% increase in operating expenses, aligning with the company's projections. The company also experienced a remarkable rise in operating income, which surged more than fourfold to $36 million, translating to a significant 910 basis points boost in operating margin. This was partly influenced by the strategic timing of planned investments set for the second half of the year aimed at fostering growth initiatives for 2025. Earnings per share impressively leaped over 350% to $1.11.
In the U.S. Higher Education segment, performance gains were primarily driven by employer-affiliated enrollment. Total enrollment increased by 10%, with employer-affiliated enrollment shooting up by 22% year-over-year, reinforcing the efficacy of Strategic Education's corporate partnerships. The segments revenue grew by 11%, while its operating income skyrocketed by 192%. Student retention held steady at 87%, further underscoring the stability of their U.S. Higher Education operations. Additionally, employer-affiliated students now account for 29% of total U.S. Higher Education enrollment, highlighting the growing importance of these corporate affiliations.
The Education, Technology & Services (ETS) segment also reported notable gains, with a 30% increase in revenue and a 74% rise in operating income from the previous year. Sophia Learning, a direct-to-consumer educational platform, saw substantial growth in both subscribers and financial metrics, with average total paid subscribers rising by 42% to over 39,000. Workforce Edge continued to expand its market presence, accumulating 68 corporate partners who employ about 1.5 million individuals and achieving a 62% increase in enrollments into Strayer or Capella University programs.
Internationally, the Australia and New Zealand (ANZ) segment marked a turnaround with a 5% year-over-year increase in total enrollment, driven mostly by domestic transfers and retention of international students already in the country. Revenue for the segment, on a constant currency basis, grew by 19%, thanks to higher enrollment and an increased course load, which contributed to a 14% rise in revenue per student. Despite the operational losses narrowing significantly, the segment remains somewhat hampered by ongoing regulatory delays affecting new Visa applications.
Overall, Strategic Education showcased a strong start to 2024, backed by solid growth across multiple segments and favorable macroeconomic conditions. The company remains optimistic about maintaining this momentum as it prepares for future strategic investments and continues to leverage its strong corporate partnerships to drive enrollment and revenue.
On April 12, 2024, Strategic Education, Inc. (STRA) filed its SEC 10-Q for the quarterly period ended March 31, 2024. The filing reflects STRAs diverse educational services across three primary segments: U.S. Higher Education (USHE), Education Technology Services, and Australia/New Zealand (ANZ). USHE includes both Capella University and Strayer University, which provide flexible and affordable degree programs to working adults. Enrollment in USHE increased by 9.8% over the comparable period in 2023, totaling 87,731 students. The Education Technology Services segment focuses on building employer education benefits programs and includes platforms like Workforce Edge and Sophia Learning. For the first quarter of 2024, employer-affiliated enrollment represented 29.2% of USHEs enrollment, an increase from 26.3% in the same period in 2023. Enrollment for the ANZ segment also grew by 4.8%, reaching 20,197 students.
The company's financial health reflects a strong balance sheet with total assets of $2.155 billion as of March 31, 2024, up from $2.125 billion at the end of 2023. Cash and cash equivalents increased significantly, from $168.5 million to $222.1 million. Marketable securities decreased marginally, influenced by sales and altered investment balances in tax-exempt municipal securities and corporate debt securities. Tuition receivable, net, also trended upward from $76.1 million to $83.1 million, indicating strong accounts receivable from its expanding student base.
Revenue for the first quarter of 2024 was $290.3 million, up from $256.6 million in the first quarter of 2023, with USHE contributing the lions share at $219.2 million compared to $196.9 million in the same quarter last year. The ANZ and Education Technology Services segments also reported revenue increases, reaching $47.4 million and $23.6 million, respectively, from $41.5 million and $18.2 million in the prior years quarter. The rise in these segments signifies a successful penetration into international markets and enhanced employer relationship programs.
Operating income saw a substantial positive shift, from a loss of $1.3 million in Q1 2023 to a gain of $41.4 million in Q1 2024. This improvement was impacted by effective cost management and significant decreases in restructuring and merger costs. Restructuring benefits amounted to $5.5 million in the first quarter of 2024 compared to expenses of $5.6 million in the same period in 2023. Net income for the quarter leaped to $29.7 million from a net loss of $2 million in the previous years quarter, bolstered by these operational efficiencies and rising revenues.
The strategic focus on affordability is evidenced by the persistent reduction in government-provided grants and loans per credit earned within USHE by 7.4% for the trailing four quarters, reflective of enhanced employer-sponsored tuition and alternative credit pathways like Sophia Learning. Commitment to quality and innovation, combined with efficient cost structures, position STRA favorably in the dynamic educational services market. Despite foreign currency translation losses impacting comprehensive income, overall performance indicates robust growth driven by strong financial management and expanding educational engagements.
Strategic Education, Inc. (NASDAQ:STRA) has exhibited substantial growth and performance dynamics, as illustrated by its financial and operational metrics over the past few years. As of June 6, 2024, an analysis by Simply Wall St highlights an impressive share price increase of approximately 53% over the last three years. This performance significantly exceeds the broader market return of 14% during the same period, signaling considerable investor confidence in the company's future. Such growth is mirrored in the company's Earnings Per Share (EPS), which have risen at an average annual rate of 17%, in parallel with the 15% average annual increase in share price. This correlation suggests that investors are reacting positively to the fundamental strength of the company.
Total Shareholder Return (TSR) provides an even more comprehensive view by including dividends and other distributions. Over the past three years, STRAs TSR has reached 68%, markedly higher than the share price return alone. This underscores the value added through the company's consistent dividend payments, thereby enhancing returns for shareholders. In the past year alone, Strategic Education posted a TSR of 50%, reinforcing the short-term attractiveness of the stock.
Insider buying has also contributed to the positive sentiment surrounding the company. Significant purchase activities by those within the organization are often taken as a robust endorsement of future prospects, adding another layer of confidence for external investors.
Despite the promising short-term gains, it's important to place them in a broader context. Over the last five years, the company has experienced an average annual loss of about 5%. This suggests a level of volatility and advises a balanced evaluation of its long-term performance, combining cautious optimism with due diligence.
For those keen on deeper insights into Strategic Education's financial performance, Simply Wall St provides interactive graphs that delve into earnings, revenue growth, and cash flows. These tools are invaluable for stakeholders looking to fully understand the companys financial health and sustainable growth potential.
The company has positioned itself as a leader in higher education services and is focused on fostering economic mobility through education. Catering primarily to working adult students, Strategic Education operates under three main pillars: U.S. Higher Education, Education Technology Services, and Australian/New Zealand education offerings.
Within the U.S. Higher Education space, Capella University and Strayer University form the crux of operations, offering a range of degree programs from associate to doctoral levels. They also provide niche, non-degree programs like the web and mobile application development courses from Strayer's Hackbright Academy and Devmountain.
Education Technology Services are a cornerstone in Strategic Education's strategy, emphasizing collaborations with employers to provide education benefits programs. Workforce Edge, an education benefits administration solution, and Sophia Learning, which offers affordable general education courses for college credit, are vital components of this segment.
The company's Australian/New Zealand segment includes Torrens University, Think Education, and Media Design School. These institutions deliver a diverse portfolio of certificate and degree programs attuned to the educational needs of students in these regions. This global presence underscores the company's commitment to innovative, high-quality educational offerings aimed at preparing students for successful careers.
Strategic Education plans to elucidate its strategic direction during a conference call on July 31, 2024, to discuss its second-quarter results. The call, scheduled for 10:00 a.m. ET, is accessible via a webcast on the companys website, offering public insight into recent financial performance and future strategic directions.
From a valuation perspective, Simply Wall St reported on July 11, 2024, that the company appears undervalued by about 68% based on its intrinsic value. The Discounted Cash Flow (DCF) model suggests a fair value of $182 per share compared to its current price of $108. This model incorporates a two-stage growth process, starting with higher growth rates that moderate over time, and uses a discount rate of 6.4% to project the present value of future cash flows. This analysis translates into an equity value of approximately $4.4 billion, highlighting significant potential upside.
A thorough SWOT analysis reveals Strategic Educations strengths, including impressive earnings growth and solid dividend payouts, albeit with a lower yield than the top quartile in its sector. Opportunities are bolstered by faster-than-market earnings growth projections and significant insider buying, while potential threats include slower revenue growth compared to the market.
In sum, while DCF analysis indicates a substantial undervaluation, investment decisions should consider broader market conditions and Strategic Education's industry positioning. For further exploration of the companys intrinsic value and investment possibilities, detailed analysis by Simply Wall St can be accessed through this link.
Strategic Education, Inc. (STRA) has shown noticeable fluctuations in its returns over the period from mid-2019 to mid-2024. The ARCH model used indicates that there is a significant level of volatility, with a substantial omega coefficient and a notable alpha coefficient, suggesting past shocks to the returns have a lasting impact. The overall fit of the model is minimal, indicating that many factors may be influencing the asset returns' variability beyond what the model accounts for.
| R-squared | 0.000 |
| Adj. R-squared | 0.001 |
| Log-Likelihood | -2,888.57 |
| AIC | 5,781.14 |
| BIC | 5,791.41 |
| No. Observations | 1,256 |
| Df Residuals | 1,256 |
| Df Model | 0 |
| omega coefficient | 4.5131 |
| alpha[1] coefficient | 0.3649 |
Analyzing the financial risk of a $10,000 investment in Strategic Education, Inc. (STRA) involves understanding both the stock's inherent volatility and its potential future returns. A comprehensive approach employs a combination of volatility modeling and machine learning predictions.
Volatility modeling helps to understand the dynamic nature of STRA's stock fluctuations. This method can capture changing variances over time and quantify the uncertainty or risk associated with the equity's returns. In this context, volatility modeling specifically focuses on assessing how past stock price behaviors can predict future volatility, thereby providing insights into periods of high and low market risk.
On the other hand, machine learning predictions enhance this analysis by incorporating a broader set of variables and learning patterns from historical data to forecast future stock returns. Using machine learning algorithms, such as a tree-based ensemble approach, one can predict the potential returns of STRA's stock by examining various features like past price movements, trading volume, economic indicators, and other relevant predictors.
Combining these methods, the annual Value at Risk (VaR) at a 95% confidence interval has been calculated for the $10,000 investment. VaR measures the maximum expected loss over a given period under normal market conditions. For this investment, the VaR is $308.99, indicating that there is only a 5% chance that the investment will lose more than $308.99 over one year.
This integrative approachleveraging both volatility modeling and machine learning predictionsoffers a nuanced view of the potential risks in equity investment, demonstrating how statistical analysis and predictive modeling can work in tandem to enhance the understanding of financial risk.
Long Call Option Strategy
Analyzing the long call options data for Strategic Education, Inc. (STRA), we focus on specific options that showcase potentially high profits given the target stock price is 2% over the current stock price. The Greeks, such as delta, gamma, vega, theta, and rho, play instrumental roles in determining the profitability and risk of these options.
One of the most profitable options is the one with a strike price of $95.00 and an expiration date of July 19, 2024. This option offers an impressive return on investment (ROI) of 1.1236, or 112.36%, with a profit of $9.775. The delta of approximately 0.9997 suggests that this option will closely follow the stock price movements, making it highly sensitive to changes in the stock price. The negligible gamma and vega, combined with a slight negative theta of -0.0043, imply minimal sensitivity to volatility and time decay, which contributes to its strong potential for profitability. The risk is relatively low given the high delta, but the premium of $8.70 must be considered when assessing initial costs and worst-case scenarios.
A near-term option with a strike price of $105.00 expiring on July 19, 2024, also shows considerable promise. With an ROI of 0.8833, or 88.33%, and a profit of $3.975, this option benefits from a delta of 0.6767 and a manageable gamma of 0.0213, indicating moderate price responsiveness. The vega of 4.6738 means this option is moderately sensitive to changes in volatility, while the theta of -0.6085 accounts for time decay as the expiration date approaches. This option carries a higher risk than the $95 strike price option but offers substantial upside potential for investors seeking shorter-term opportunities.
For investors considering a slightly longer horizon, an option with a strike price of $100.00 and an expiration date of October 18, 2024, stands out. This option presents an ROI of 0.6138, or 61.38%, and a profit of $5.125. The delta of 0.6833 indicates good sensitivity to stock price movements, while the gamma of 0.0086 and vega of 20.0912 highlight moderate exposure to changes in stock price and volatility. The theta of -0.0769 represents low daily time decay, making this a balanced choice for those willing to wait out some price fluctuations.
Another option with a strike price of $100.00 but a longer expiration date of November 15, 2024, offers a more conservative return. It has an ROI of 0.3611, or 36.11%, with a profit of $3.575. Despite a delta of 0.6805, which ensures good price sensitivity, the lower ROI suggests it might not be the highest yielding in the short term. However, with vega at 22.8506 and theta at -0.0652, this option provides some insulation against volatility changes and time decay. This could be suitable for longer-term strategies, offering a safer and steady appreciation potential.
Lastly, a high-risk, high-reward option is one with a strike price of $110.00 and the same short expiration date of July 19, 2024, as the previous options. Despite the lower ROI of 0.4787, or 47.87%, and the profit of $1.125, this option carries a delta of 0.6340, showing good price sensitivity. Its gamma of 0.0949 and vega of 4.8964 highlight its responsiveness to price changes and volatility. The theta of -0.1526 adds some risk due to higher time decay. This option is suitable for those looking to capitalize quickly on short-term stock movements with a smaller premium investment of $2.35.
In summary, while the option with a strike price of $95.00 expiring on July 19, 2024, offers the highest ROI and significant profits, the options with different expiration dates and varying strike prices give investors diversified opportunities based on their risk tolerance and investment horizon. Each option presents a balance between potential rewards and inherent risks.
Short Call Option Strategy
When analyzing the most profitable short call options for Strategic Education, Inc. (STRA), it's crucial to look at the Greeks' values, strike prices, expiration dates, and current premiums. Given the constraint to minimize the risk of having the shares assigned, focusing on options that are out of the money (OTM) or farther OTM would be prudent. Below, I will analyze five near to long-term options based on the expiration date and strike price. My analysis includes evaluating the risk and reward aspects reflected in the delta, gamma, vega, theta, and rho values along with the premium and potential profits.
Near-Term Option
Expiration Date: 2024-07-19 | Strike Price: $135
This option has a delta of 0.015, gamma of 0.0039, vega of 0.4941, theta of -0.0370, and rho of 0.0002. With a premium of $1.25 and 5 days to expiration, the low delta suggests a low probability of expiring in the money, hence minimizing the risk of having the shares assigned. The theta value indicates time decay would benefit the seller, especially in the last few days. With an ROI of 100% and potential profit of $1.25, this option is attractive for a quick turnaround with minimal assignment risk.
Mid-Term Option
Expiration Date: 2024-08-16 | Strike Price: $110
This option has a delta of 0.565, gamma of 0.0278, vega of 13.1345, theta of -0.0866, and rho of 0.0511. The premium is $4.3, and it has 33 days to expiration. While the delta is relatively high, indicating a greater risk of assignment, the significant vega suggests that volatility might play a considerable role in the premium. The premium yield is substantial, but the higher delta means careful monitoring is required as the expiration approaches. Profit can be sizable at $4.3, but the assignment risk is moderate to high.
Longer-Term Option
Expiration Date: 2024-10-18 | Strike Price: $135
This option has a delta of 0.1346, gamma of 0.0122, vega of 12.3417, theta of -0.0207, and rho of 0.0364. With a premium of $3.4 and 96 days to expiration, the option's delta suggests a low to moderate risk of assignment. The high vega indicates sensitivity to volatility changes, which can affect the premium positively. Theta's impact is relatively mild given the longer time frame. The ROI and potential profit of $3.4 make it a viable choice with a manageable assignment risk.
Extra Long-Term Option
Expiration Date: 2025-01-17 | Strike Price: $135
This option has a delta of 0.2121, gamma of 0.0127, vega of 22.9751, theta of -0.0186, and rho of 0.1080. Carrying a premium of $3.0 with 187 days to expiration, the delta indicates a cautious approach to assignment. Given the lengthy time until expiration, both vega and theta play critical roles; vega being substantial can drive premium changes, while theta decay benefits the seller. The ROI and profit potential of $3.0 remain appealing, and the assignment risk is lower compared to more/near ATM options.
Ultra Long-Term Option
Expiration Date: 2025-01-17 | Strike Price: $175
This option has a delta of 0.0302, gamma of 0.0028, vega of 5.4329, theta of -0.0047, and rho of 0.0158. The premium is $0.5, with 187 days to expiration. Extremely low delta signifies a very low probability of being in the money, thus virtually eliminating assignment risk. The low vega and theta indicate that premium changes due to volatility and passage of time will be minimal. This option provides a safe if relatively modest profit of $0.5, ideal for highly risk-averse strategies but needs monitoring the market sentiment closely.
Conclusion
Based on the analysis, the five chosen options provide a balance between profitability and risk management:
- 2024-07-19 | $135 Strike: Low delta, quick profit of $1.25, minimal assignment risk.
- 2024-08-16 | $110 Strike: Higher premium of $4.3, moderate assignment risk.
- 2024-10-18 | $135 Strike: Moderate premium of $3.4 with manageable risk.
- 2025-01-17 | $135 Strike: Low delta and a longer time span with a $3 profit.
- 2025-01-17 | $175 Strike: Ultra-low delta with minimal assignment risk and a reasonable $0.5 profit.
Overall, these selections offer a range of expiration dates from near-term to long-term, balancing potential profits and minimizing the risk of assignment.
Long Put Option Strategy
It looks like the table for long put options on Strategic Education, Inc. (STRA) is not included in your query. However, I can provide a general analysis using hypothetical data along with an understanding of "the Greeks" to guide the evaluation process of long put options.
Long Put Options Analysis for Strategic Education, Inc. (STRA)
To determine the most profitable long put options, let's consider various scenarios with different expiration dates and strike prices. For a stock price that is currently at $100, targeting a price 2% higher ($102), we need to assess options with respect to Delta, Gamma, Theta, Vega, and Rho.
Near-Term Options (30 days to expiration)
- Expiration Date: 30 Days, Strike Price: $105
- Delta: -0.40
- Theta: -0.03
- Vega: 0.10
- Gamma: 0.012
- Rho: -0.02
This option has a moderate Delta indicating that for every $1 move in the stock, the option's price will move by $0.40. The Theta is relatively high, implying significant time decay, which can erode the option's value within a short timeframe. Vega indicates decent sensitivity to volatility; a volatility spike could enhance this option's value. Given the time decay, this option is suitable for short-term traders anticipating a quick decline in STRA stock.
Medium Term Options (90 days to expiration)
- Expiration Date: 90 Days, Strike Price: $100
- Delta: -0.55
- Theta: -0.02
- Vega: 0.15
- Gamma: 0.008
- Rho: -0.04
With a higher Delta, this option provides a more significant payoff if STRA drops in price, making it more sensitive to stock price movements. A relatively lower Theta here means time decay is less of a concern. The high Vega suggests that an increase in volatility will greatly benefit this option. This balance of moderate time decay and high sensitivity to price and volatility makes this option profitable for medium-term investment strategies.
Long Term Options (6 months to a year)
- Expiration Date: 180 Days, Strike Price: $95
- Delta: -0.70
- Theta: -0.01
- Vega: 0.25
- Gamma: 0.005
- Rho: -0.05
With a high Delta, this option stands to gain significantly from a decline in STRA's stock price. The very low Theta indicates minimal time decay, making it ideal for long-term investors. High Vega enhances its attractiveness if market volatility rises. This option is beneficial for those who expect STRA to drop or experience significant market volatility over the coming months.
- Expiration Date: 360 Days, Strike Price: $110
- Delta: -0.35
- Theta: -0.005
- Vega: 0.30
- Gamma: 0.003
- Rho: -0.08
This longer-dated option has a lower Delta but exceptionally low Theta, meaning minimal time decay. With the highest Vega among our selections, it is extremely sensitive to changes in volatility. This option is a good hedge against long-term market downturns and volatility spikes while preserving value with minimal time decay.
LEAPS (Long Term Equity Anticipation Securities, over 1 year)
- Expiration Date: 720 Days, Strike Price: $90
- Delta: -0.80
- Theta: -0.001
- Vega: 0.40
- Gamma: 0.001
- Rho: -0.10
LEAPS options have the highest Delta, implying the most significant sensitivity to stock price movements. The Theta is extremely low, even less impactful than the long-term options. With the highest Vega, this option stands to benefit substantially from increased volatility. This makes LEAPS ideal for investors with a long-term bearish view on STRA while seeking protection against potential long-dated market instability.
Conclusion
These diverse options allow an investor to hedge against or capitalize on anticipated declines in STRA stock over various timelines, balancing factors such as Delta, Theta, Vega, Gamma, and Rho. By understanding and selecting options based on these Greeks, you can align your investments with your risk tolerance, investment horizon, and expectations of stock price movements and market volatility.
Remember, the risk in each of these positions lies in the possibility of the stock price not moving as expected, leading to losses primarily through time decay (Theta) for near-term options and market risk for long-term options. Properly managing these risks through diversification and prudent selection can help in maximizing potential rewards.
Short Put Option Strategy
In analyzing the short put options available for Strategic Education, Inc. (STRA), we need to identify the most profitable options while minimizing the risk of having shares assigned, particularly given that we are targeting a stock price which is 2% lower than the current price. Here, we focus not only on the premiums but also on "the Greeks" such as delta for assessing the risk of assignment, and other factors such as time decay and volatility.
Near-Term Expiration (5 days to expire, July 19, 2024)
- Strike Price $85
- Premium: $2.10
- Delta: -0.0086
- Profit: $2.1
- ROI: 100.0%
This option presents a high ROI with a relatively low delta, which suggests a minimal risk of the stock price falling below the strike price and the option being exercised. The gamma and theta values indicate significant sensitivity to movements in the underlying stock price and time decay, respectively. However, due to the near-term expiry, the time decay could work in favor of retaining most of the premium.
- Strike Price $100
- Premium: $0.25
- Delta: -0.0392
- Profit: $0.25
- ROI: 100.0%
Although the premium is lower, the delta is still low, indicating a manageable risk of assignment. The high gamma and theta values suggest notable sensitivity to price movements and time decay, but the short time to expiration means there is less time for adverse movements in the stock price.
Intermediate-Term Expiration (96 days to expire, October 18, 2024)
- Strike Price $95
- Premium: $6.10
- Delta: -0.2540
- Profit: $6.1
- ROI: 100.0%
This option presents a higher premium and potential profit. The delta indicates a moderate probability of assignment if the stock price approaches the strike price. The high vega suggests that this option is quite sensitive to changes in volatility, which could affect the premium more significantly over the longer-term horizon compared to near-term options.
- Strike Price $85
- Premium: $0.68
- Delta: -0.0534
- Profit: $0.68
- ROI: 100.0%
This option offers a respectable premium with a lower delta, implying a lesser likelihood of the shares being assigned. The higher gamma and vega values reflect higher sensitivity to price movements and volatility. The theta's influence suggests a slower erosion of time value compared to the near-term options.
Long-Term Expiration (124 days to expire, November 15, 2024)
- Strike Price $100
- Premium: $9.00
- Delta: -0.3081
- Profit: $9.0
- ROI: 100.0%
This option generates the highest premium and potential profit among the analyzed options. The delta shows a higher risk of the stock price reaching the strike price, leading to potential assignment. Additionally, with high vega and gamma, this option is more sensitive to changes in market conditions and volatility, representing both an opportunity and a risk.
Risk and Reward Analysis
When selecting a short put option, it's crucial to consider both the immediate return (premium) and the risk of assignment. The delta value helps quantify this risk, where a lower delta signifies a lower risk of shares being assigned. Concurrently, the option premium indicates the immediate reward one can lock in. The vega, gamma, and theta values combined give insights into how the option's price might fluctuate with volatility and time decay.
For short-term options expiring in five days, the lower delta and high ROI of the $85 and $100 strike price options make them attractive choices with manageable risk. For intermediate-term options, the $95 strike price offers a high premium and profit potential but with a higher delta and thus a slightly increased risk of assignment. The $85 strike price option here offers a balance of lower delta and reasonable premium, making it a safer bet with good returns. Lastly, the long-term option with a $100 strike price stands out for its high premium and profit, albeit at the cost of a higher delta, indicating greater risk.
Overall, balancing the risk of assignment with potential returns, the top choices include:
- Strike Price $85: Expiration July 19, 2024
- Strike Price $100: Expiration July 19, 2024
- Strike Price $95: Expiration October 18, 2024
- Strike Price $85: Expiration October 18, 2024
- Strike Price $100: Expiration November 15, 2024
These selections provide a comprehensive outlook from near-term to long-term options, emphasizing profitability while keeping the assignment risk within acceptable levels.
Vertical Bear Put Spread Option Strategy
To identify the most profitable vertical bear put spread options strategy for Strategic Education, Inc. (STRA), we'll thoroughly analyze the options chain data provided for both short and long-term put options. We'll focus on minimizing the risk of shares being assigned in the money while targeting a stock price that is roughly 2% over or under the current stock price.
Strategy Explanation
A vertical bear put spread involves buying a put option at a higher strike price (in-the-money or slightly out-of-the-money) and simultaneously selling a put option at a lower strike price (out-of-the-money). The goal is to capitalize on a decline in the underlying stocks price while minimizing risk by offsetting premium costs with the sold put option. Loss is limited to the net premium paid, and profit is capped at the difference in strike prices minus the net premium.
Criteria for Selection
- Greek Values: The deltas, gammas, vegas, thetas, and rhos indicate the sensitivity of option prices to various factors.
- Days to Expiry: Balancing between potential profit and minimization of assignment risk.
- Potential Profit: Calculated based on RoI and premium.
Most Profitable Scenarios
Here are the top five vertical bear put spreads ranked from near term to long term, emphasizing the most profitable strategies:
- Near-Term Option (Expiration: July 19, 2024)
- Strategy: Buy a put with a strike price of $115 and sell a put with a strike price of $110.
- Greek Values: Delta (-0.8236 for $115 and -0.3322 for $110), Narrow delta spread minimizes risk of assignment until reached.
- Net Premium: $6.2 (sold $115) - $2.2 (buy $110) = $4.0
- Max Profit: (Strike difference of $5) - Net premium ($4.0) = $1.0 per share.
- Risk/Reward: The initial investment is the net premium paid, with a capped profit potential.
-
Potential Loss: Limited to $4.0 per share (net debit).
-
Mid-Term Option (Expiration: October 18, 2024)
- Strategy: Buy a put with a strike price of $115 and sell a put with a strike price of $105.
- Greek Values: Delta considerations reduce assignment risk, with significant premium differential.
- Net Premium: $9.1 (sold $115) - $0.45 (buy $105) = $8.65
- Max Profit: (Strike difference of $10) - Net premium ($8.65) = $1.35 per share.
- Risk/Reward: This represents a higher upfront cost but a higher capped profit.
-
Potential Loss: Limited to $8.65 per share (net debit).
-
Long-Term Option (Expiration: November 15, 2024)
- Strategy: Buy a put with a strike price of $125 and sell a put with a strike price of $115.
- Greek Values: Lower gamma and higher theta on the $125 strike, reducing time decay impact.
- Net Premium: $22.5 (sold $125) - $9.0 (buy $115) = $13.5
- Max Profit: (Strike difference of $10) - Net premium ($13.5) = -$3.5 per share. This option is not favorable.
- Risk/Reward: This option requires high premium with negative net potential.
- Potential Loss: This strategy does not fit profit criteria.
It is clear that the different options carry varying degrees of risk and potential for profit. Near-term options offer a rapid realization of gains but may be too risky due to their close expiration. Mid-term options typically balance this better, offering a blend of safety and potential for profit, while long-term strategies necessitate larger initial investments with limited profit maximization.
Given this, the most favorable options to consider would be options expiring within the next quarter (July or October) with strike prices around $115 and $110 or equivalent spreading. These balances between premium costs and profit potential maximize returns while minimizing risks.
Conclusion
A vertical bear put spread with a mix of strategic near-term and mid-term options, focusing on strike prices around $110 to $115, would be the most suitable and define a profitable strategy for STRA. Balancing premium costs, maximum profit potential, and the risk of assignment helps create a robust approach aligned with your trading goals.
Vertical Bull Put Spread Option Strategy
To evaluate the most profitable vertical bull put spread options strategy for Strategic Education, Inc. (STRA), we need to examine the short put options data provided, with an emphasis on balancing profit potential with risk exposure. In a bull put spread, a trader sells one put option to collect premium while buying another put option with the same expiration date but a lower strike price to limit potential losses. This trade profits when the stock price remains above the higher strike price, or at least remains above the lower strike price at expiration. Here's an in-depth analysis that considers the given criteria, including the desire to minimize the risk of having shares assigned:
1. Near Term Option (2024-07-19 Expiration)
Strategy 1: Short Put at $95 Long Put at $90 - Short Put (95 Strike): - Expiration: 2024-07-19 - Premium: $0.4 - Delta: -0.017 - Gamma: 0.005 - Vega: 0.56 - Theta: -0.036 - Implied Profit if not assigned: $0.4 - ROI: 100%
- Long Put (90 Strike): (Assume a minimal cost to hedge risk)
- Expiration: 2024-07-19
- Premium: $0.2 (approx.)
Net Premium Received: $0.4 (short) - $0.2 (long) = $0.2
Potential Profit and Loss Scenario: - Max Profit: $20 per contract if STRA closes above $95 at expiration. - Max Loss: Limited to $4.80 per contract (difference in strikes minus net premium received). - Breakeven Point: $94.80
2. Intermediate Term Option (2024-10-18 Expiration)
Strategy 2: Short Put at $100 Long Put at $95 - Short Put (100 Strike): - Expiration: 2024-10-18 - Premium: $9.0 - Delta: -0.308 - Gamma: 0.0087 - Vega: 22.72 - Theta: -0.053 - Implied Profit if not assigned: $9.0 - ROI: 100%
- Long Put (95 Strike):
- Expiration: 2024-10-18
- Premium: $6.1
Net Premium Received: $9.0 (short) - $6.1 (long) = $2.9
Potential Profit and Loss Scenario: - Max Profit: $290 per contract if STRA closes above $100 at expiration. - Max Loss: Limited to $2,10 per contract. - Breakeven Point: $97.10
3. Long Term Option (2024-11-15 Expiration)
Strategy 3: Short Put at $100 Long Put at $90 - Short Put (100 Strike): - Expiration: 2024-11-15 - Premium: $9.0 - Delta: -0.308 - Gamma: 0.0087 - Vega: 22.72 - Theta: -0.053 - Implied Profit if not assigned: $9.0 - ROI: 100%
- Long Put (90 Strike):
- Expiration: 2024-11-15
- Premium: $1.3
Net Premium Received: $9.0 (short) - $1.3 (long) = $7.7
Potential Profit and Loss Scenario: - Max Profit: $770 per contract if STRA closes above $100 at expiration. - Max Loss: Limited to $230 per contract. - Breakeven Point: $92.30
4. Another Near Term Option (2024-07-19 Expiration)
Strategy 4: Short Put at $105 Long Put at $100 - Short Put (105 Strike): - Expiration: 2024-07-19 - Premium: $0.45 - Delta: -0.065 - Gamma: 0.029 - Vega: 1.66 - Theta: -0.054 - Implied Profit if not assigned: $0.45 - ROI: 100%
- Long Put (100 Strike):
- Expiration: 2024-07-19
- Premium: $0.25
Net Premium Received: $0.45 (short) - $0.25 (long) = $0.20
Potential Profit and Loss Scenario: - Max Profit: $20 per contract if STRA closes above $105 at expiration. - Max Loss: Limited to $4.80 per contract. - Breakeven Point: $104.80
5. Alternative Intermediate Term Option (2024-11-15 Expiration)
Strategy 5: Short Put at $90 Long Put at $85 - Short Put (90 Strike): - Expiration: 2024-11-15 - Premium: $1.3 - Delta: -0.141 - Gamma: 0.0087 - Vega: 14.51 - Theta: -0.021 - Implied Profit if not assigned: $1.3 - ROI: 100%
- Long Put (85 Strike):
- Expiration: 2024-11-15
- Premium: $0.83
Net Premium Received: $1.3 (short) - $0.83 (long) = $0.47
Potential Profit and Loss Scenario: - Max Profit: $47 per contract if STRA closes above $90 at expiration. - Max Loss: Limited to $4.53 per contract. - Breakeven Point: $89.53
Conclusion
Overall, the vertical bull put spread strategies involve selling put options with higher strike prices and buying put options with lower strike prices, at the same expiration date. This approach yields a net credit (premium received) and limits maximum loss. While the potential profit is the net credit received, maximum loss is capped at the spread minus the net credit. By selecting strike prices closer to or above the target, you can manage risk more effectively. Notably, expiration dates ranging from near term to long term provide varying risk-reward profiles, from conservative to aggressive.
Using the criteria of minimizing assignment risk while ensuring substantial returns, Strategy 2 and Strategy 3, involving the 100 and 95 strikes with intermediate and long-term expirations, respectively, exhibit balanced risk with notable returns, making them potentially the most profitable vertical bull put spreads.
Vertical Bear Call Spread Option Strategy
Analysis for Vertical Bear Call Spread Options Strategy on Strategic Education, Inc. (STRA)
In a vertical bear call spread, two call options with different strike prices but the same expiration date are utilized. We sell a call option with a lower strike price (close to the money) and buy a call option with a higher strike price (out of the money). The aim is to benefit from the stock's price either declining or staying relatively unchanged. Given that we want to minimize the risk of having shares assigned, we will focus on options that balance risk and reward suitably.
Our target stock price is 2% over or under the current stock price, implying that we expect minimal price movement. Below, we discuss five different choices based on various expiration dates, considering profitability and minimizing assignment risk.
Choice 1: Short Term 5 Days to Expire (2024-07-19)
- Short Call: Strike $110.0, Premium: $2.35, Delta: 0.634
- Long Call: Strike $125.0, Premium: $0.15, Delta: 0.0385
Risk and Reward: - Premium Collected: $2.35 - $0.15 = $2.20 - Max Profit: $2.20 (Received premium) - Max Loss: $125 - $110 = $15 - $2.20 = $12.80 - Break-Even Point: $110 + $2.20 = $112.20
This option set captures high premium upfront but has the greatest risk of assignment due to a high delta on the short call. However, significant premium collection promises substantial profitability in the case of minor to no stock price increase.
Choice 2: Intermediate Term 33 Days to Expire (2024-08-16)
- Short Call: Strike $115.0, Premium: $2.85, Delta: 0.4219
- Long Call: Strike $130.0, Premium: $0.23, Delta: 0.0154
Risk and Reward: - Premium Collected: $2.85 - $0.23 = $2.62 - Max Profit: $2.62 (Received premium) - Max Loss: $130 - $115 = $15 - $2.62 = $12.38 - Break-Even Point: $115 + $2.62 = $117.62
This strategy offers a balanced risk-reward profile with a medium term expiration. The delta on the short call moderately reduces the risk of assignment.
Choice 3: Medium Term 96 Days to Expire (2024-10-18)
- Short Call: Strike $130.0, Premium: $1.55, Delta: 0.1859
- Long Call: Strike $145.0, Premium: $0.30, Delta: 0.0526
Risk and Reward: - Premium Collected: $1.55 - $0.30 = $1.25 - Max Profit: $1.25 (Received premium) - Max Loss: $145 - $130 = $15 - $1.25 = $13.75 - Break-Even Point: $130 + $1.25 = $131.25
This trade provides moderate premium collection with slightly longer time for reaching the break-even point, offering more buffer against the stock's upward movement.
Choice 4: Medium-Long Term 124 Days to Expire (2024-11-15)
- Short Call: Strike $140.0, Premium: $4.50, Delta: 0.1996
- Long Call: Strike $150.0, Premium: $2.10, Delta: 0.1066
Risk and Reward: - Premium Collected: $4.50 - $2.10 = $2.40 - Max Profit: $2.40 (Received premium) - Max Loss: $150 - $140 = $10 - $2.40 = $7.60 - Break-Even Point: $140 + $2.40 = $142.40
This selection is ideal due to a comfortable margin before the break-even point coupled with reasonably lower risk of assignment.
Choice 5: Long Term 187 Days to Expire (2025-01-17)
- Short Call: Strike $135.0, Premium: $3.00, Delta: 0.2120
- Long Call: Strike $175.0, Premium: $0.50, Delta: 0.0302
Risk and Reward: - Premium Collected: $3.00 - $0.50 = $2.50 - Max Profit: $2.50 (Received premium) - Max Loss: $175 - $135 = $40 - $2.50 = $37.50 - Break-Even Point: $135 + $2.50 = $137.50
This choice grants a significant time horizon and a large differential in strike prices, minimizing the assignment risk substantially while still being profitable.
Conclusion: Among these strategies, the intermediate and medium-term choices (Choice 2 and Choice 3) offer a sweet spot of balancing profitability and risk. They afford enough time for the trade to work without running into immediate risk of assignment, unlike the near-term options which carry higher delta and assignment risk. Meanwhile, the long-term strategy (Choice 5) can potentially achieve stability and profit over an extended horizon despite the higher notional maximum loss due to significant strike price differences. Careful assessment based on individual risk tolerance and volatil.plugins can further refine these choices.
Vertical Bull Call Spread Option Strategy
A vertical bull call spread involves purchasing a call option at a lower strike price and selling another call option at a higher strike price, both with the same expiration date. This strategy profits when the stock price is near or above the higher strike price at expiration while limiting potential loss to the net premium paid.
Near-Term Options (Expiration: 2024-07-19)
1. Strike Prices: 100 & 105
-
Long Call (100 strike):
Delta: 0.7339421424
Premium: $23.66
Theta: -0.7480250368
Vega: 4.2704842516 -
Short Call (105 strike):
Delta: 0.6766809156
Premium: $4.50
Theta: -0.6084742958
Vega: 4.6738236804
For the near-term expiration, we purchase the 100 strike call and sell the 105 strike call. The net premium paid is $19.16 ($23.66 - $4.50). The maximum profit potential is $5.84 per spread, derived from the difference between strikes ($5) minus the net premium paid. The delta indicates a high likelihood of these options finishing in the money, but the gamma high near the target price suggests high sensitivity to the underlying's movements, providing rapid adjustment. Given the near-term expiry, the risk of assignment is relatively high, but manageable by closing the short position before expiration.
Mid-Term Options (Expiration: 2024-08-16)
2. Strike Prices: 110 & 115
-
Long Call (110 strike):
Delta: 0.5652187123
Premium: $4.3
Theta: -0.0866058553
Vega: 13.1345407245 -
Short Call (115 strike):
Delta: 0.4218661138
Premium: $2.85
Theta: -0.0826721566
Vega: 13.0681539466
Purchasing the 110 strike call and selling the 115 strike call costs a net premium of $1.45 ($4.3 - $2.85). The maximum profit is $3.55 per spread ($5 strike difference - $1.45 net premium). This spread benefits from lower theta decay and high vega, indicating sensitivity to volatility changes. The delta values are moderate, providing a balanced risk-reward scenario. Such a spread is suitable if expecting a moderate stock price increase without undue concern of assignment risk, given the more relaxed time frame before expiration.
Intermediate-Term Options (Expiration: 2024-10-18)
3. Strike Prices: 110 & 120
-
Long Call (110 strike):
Delta: 0.5692499423
Premium: $7.42
Theta: -0.0414158414
Vega: 22.257777408 -
Short Call (120 strike):
Delta: 0.3610459773
Premium: $3.90
Theta: -0.0370048315
Vega: 21.2865147556
With an expiration in October, this spread consists of a 110 strike long call and selling a 120 strike call for a net premium of $3.52 ($7.42 - $3.90). The maximum potential profit would be $6.48 ($10 strike difference - $3.52 net premium). The higher delta of the long call vs. the short call suggests a favorable risk/reward as the intermediate time horizon allows more room for the stock price to increase. The theta value indicates low time decay, and the high vega points to potential gains from increased volatility.
Longer-Term Options (Expiration: 2024-11-15)
4. Strike Prices: 115 & 120
-
Long Call (115 strike):
Delta: 0.5130838271
Premium: $13.00
Theta: -0.0507963317
Vega: 25.6566183204 -
Short Call (120 strike):
Delta: 0.3644036718
Premium: $5.7
Theta: -0.0291721586
Vega: 24.240847527
In the near end of the year, opting for the 115 strike long call and selling the 120 strike call costs a net premium of $7.3 ($13.00 - $5.7). This spread's maximum potential profit is $2.70 ($5 strike difference - $7.3 net premium). This longer-term spread capitalizes on the stock's anticipated increase further out, with moderate delta and low theta favoring long positions in a trending environment. The large vega reinforces benefits from volatility uplift.
Long-Term Options (Expiration: 2025-01-17)
5. Strike Prices: 120 & 130
-
Long Call (120 strike):
Delta: 0.2504179203
Premium: $4.8
Theta: -0.0287724499
Vega: 18.0981250895 -
Short Call (130 strike):
Delta: 0.1859222764
Premium: $1.55
Theta: -0.0250454744
Vega: 15.2435885113
For the farthest expiration, buying the 120 strike and selling 130 strike costs a net premium of $3.25 ($4.8 - $1.55). This spread allows for a maximum profit of $6.75 ($10 difference in strike - $3.25 premium). The relatively low delta and theta for these options indicate minimal price sensitivity and time decay, emphasizing a potential for gradual price appreciation without immediate concerns of assignment. The significant vega provides benefits from market volatility.
Conclusion
In summary, the most profitable vertical bull call spread for Strategic Education, Inc. (STRA) changes depending on the desired time frame and risk tolerance. From short to long-term strategies, the spreads presented offer a balance of risk and reward, with the intermediate and long-term strategies benefiting from elevated implied volatilities (vega) and manageable time decay (theta). The delta values across these spreads indicate sensitivity at different strike prices, underscoring the importance of stock price trends within the respective times. Each recommendation aims to maximize stable trading opportunities while mitigating the risk of assignment.
Spread Option Strategy
Analyzing the given data for Strategic Education, Inc. (STRA) and considering a calendar spread options strategy, we aim to maximize profitability while minimizing the risk of having shares assigned. This strategy involves buying a call option and selling a put option with the same strike price but different expiration dates. Considering the target stock price is 2% above or below the current stock price, we need to be mindful of the market trends and volatility represented by the Greeks.
- Near-Term Option Strategy (Short Term Call and Put):
- Long Call Option:
- Strike Price: $110.0
- Expiration Date: 2024-07-19
- Greeks:
- Delta: 0.6340
- Gamma: 0.0949
- Vega: 4.8964
- Theta: -0.1526
- Rho: 0.0093
- Premium: $2.35
- ROI: 0.4787
- Profit: $1.125
- Short Put Option:
- Strike Price: $110.0
- Expiration Date: 2024-07-19
- Greeks:
- Delta: -0.3322
- Gamma: 0.1183
- Vega: 4.7270
- Theta: -0.1092
- Rho: -0.0051
- Premium: $2.2
- ROI: 55.6818
- Profit: $1.225
-
Analysis: This near-term strategy, with symmetrical strike prices but short expiration dates, leverages high gamma and vega, resulting in significant ROI for both legs. The matched expiration dates minimize time decay mismatches (
Theta). -
Mid-Term Option Strategy (Moderate Term Call and Put):
- Long Call Option:
- Strike Price: $105.0
- Expiration Date: 2024-07-19
- Greeks:
- Delta: 0.6767
- Gamma: 0.0213
- Vega: 4.6738
- Theta: -0.6085
- Rho: 0.0089
- Premium: $4.5
- ROI: 0.8833
- Profit: $3.975
- Short Put Option:
- Strike Price: $95.0
- Expiration Date: 2024-07-19
- Greeks:
- Delta: -0.1018
- Gamma: 0.0089
- Vega: 2.3151
- Theta: -0.3547
- Rho: -0.0017
- Premium: $2.1
- ROI: 100.0
- Profit: $2.1
-
Analysis: This strategy combines mid-level delta and high vega, creating potential high profits while spreading the risk across different strike prices, aiding hedge.
-
Intermediate-Term Option Strategy (Long Call and Medium Term Put):
- Long Call Option:
- Strike Price: $100.0
- Expiration Date: 2024-10-18
- Greeks:
- Delta: 0.6834
- Gamma: 0.0086
- Vega: 20.0912
- Theta: -0.0769
- Rho: 0.1425
- Premium: $8.35
- ROI: 0.6137
- Profit: $5.125
- Short Put Option:
- Strike Price: $85.0
- Expiration Date: 2024-10-18
- Greeks:
- Delta: -0.0535
- Gamma: 0.0054
- Vega: 6.1982
- Theta: -0.0109
- Rho: -0.0169
- Premium: $0.68
- ROI: 100.0
- Profit: $0.68
-
Analysis: By choosing a slightly longer-term call and a short-term put with higher ROI, we balance between time value decomposition and ensure adequate protection with a more distant expiration horizon for the call.
-
Long-Term Option Strategy (Extended Call and Put):
- Long Call Option:
- Strike Price: $100.0
- Expiration Date: 2024-11-15
- Greeks:
- Delta: 0.6805
- Gamma: 0.0079
- Vega: 22.8506
- Theta: -0.0652
- Rho: 0.1782
- Premium: $9.9
- ROI: 0.3611
- Profit: $3.575
- Short Put Option:
- Strike Price: $100.0
- Expiration Date: 2024-11-15
- Greeks:
- Delta: -0.3082
- Gamma: 0.0087
- Vega: 22.7232
- Theta: -0.0538550706
- Rho: -0.1497811767
- Premium: $9.0
- ROI: 100.0
- Profit: $9.0
-
Analysis: The longer period decreases the pressure from Theta decay while allowing the accumulation of delta-driven gains, shared between both call and put options, thus stabilizing the portfolio.
-
Far-Term Strategy (Full-term Call and Ultra-long Put):
- Long Call Option:
- Strike Price: $105.0
- Expiration Date: 2024-07-19
- Greeks:
- Delta: 0.6767
- Gamma: 0.0213
- Vega: 4.6738
- Theta: -0.6085
- Rho: 0.008923076
- Premium: $4.5
- ROI: 0.8833
- Profit: $3.975
- Short Put Option:
- Strike Price: $100.0
- Expiration Date: 2024-11-15
- Greeks:
- Delta: -0.0258
- Gamma: 0.0021
- Vega: 3.8881
- Theta: -0.0068
- Rho: -0.0108
- Premium: $0.25
- ROI: 100.0
- Profit: $0.25
- Analysis: Employing a diversified expiration calendar spreads risk across different market conditions and vega sensitivity. The delta in the far term put enhances stability, and low gamma implies steady moderate returns.
Undeniably, these tailored approaches ensure high returns whilst mitigating risks emanating from in-the-money pressures to assign unwanted shares. Balancing different expiration horizons with strategic Greek values is key.
Calendar Spread Option Strategy #1
To ascertain the most profitable calendar spread options strategy for Strategic Education, Inc. (STRA), we must employ a structured approach when analyzing the Greeks and other relevant metrics. The Greeks, such as delta, gamma, vega, theta, and rho, will guide us in understanding the potential outcomes and underlying risks associated with different strike prices and expiration dates. Given the lack of long put options data, our focus will solely be on short call options data.
Criteria for Selection
- Expiry Gap: Selecting call and put options with varying expiration dates to maximize the time decay benefit of a calendar spread.
- Strike Price Proximity: Ensuring the strike prices for both legs are as close as possible to mitigate assignment risk.
- Greek Analysis:
- Delta: Lower delta calls are preferred, indicating a lower risk of being in-the-money (ITM).
- Theta: A higher negative theta value indicates substantial time decay, thus benefiting our strategy.
- Vega: Higher vega values are also beneficial, especially since we expect implied volatility to rise.
- Gamma: Lower gamma is ideal to minimize risk associated with sudden price movements.
- Profit Potential: Based on premiums collected and possible ROI.
Analyzed Options for the Calendar Spread
Here we outline five choices based on different expiration dates, considering the request for near-term through long-term options:
-
Short Call Option: 2024-07-19, Strike 125.0
- Greeks: delta: 0.0385, gamma: 0.0116, theta: -0.0603, vega: 1.088
- Premium: 0.15
- Profit Potential: $0.15
- Risk Analysis: With a low delta (0.0385), there's minimal risk of this option being ITM. The theta is significantly negative, indicating favorable decay for our strategy.
-
Short Call Option: 2024-08-16, Strike 115.0
- Greeks: delta: 0.4219, gamma: 0.0287, theta: -0.0827, vega: 13.068
- Premium: 2.85
- Profit Potential: $2.85
- Risk Analysis: The delta (0.4219) is moderate; some risk of assignment exists. However, a high negative theta signifies rapid premium decay, an advantage for the calendar spread. The substantial vega (13.068) suggests high sensitivity to changes in volatility, which is favorable if volatility rises.
-
Short Call Option: 2024-10-18, Strike 110.0
- Greeks: delta: 0.5692, gamma: 0.0204, theta: -0.0414, vega: 22.258
- Premium: 7.42
- Profit Potential: $7.42
- Risk Analysis: A higher delta (0.5692) implies a significant risk of being ITM. However, the calendar spread strategy could benefit from the erosion of the premium and possibly increasing implied volatility (suggested by high vega).
-
Short Call Option: 2024-11-15, Strike 120.0
- Greeks: delta: 0.3644, gamma: 0.0206, theta: -0.0292, vega: 24.241
- Premium: 5.7
- Profit Potential: $5.7
- Risk Analysis: Moderate delta (0.3644) balances the risk of becoming ITM with premium decay. The high vega values (24.241) indicate an edge if implied volatility spikes.
-
Short Call Option: 2025-01-17, Strike 110.0
- Greeks: delta: 0.5770, gamma: 0.0143, theta: -0.0301, vega: 30.728
- Premium: 10.35
- Profit Potential: $10.35
- Risk Analysis: High delta (0.5770) carries significant assignment risk, though significant theta decay and extremely high vega (30.728) provide potential upside in scenarios of increased volatility.
Comprehensive Risk and Reward Summary
- Strike 125.0 (2024-07-19):
- Reward: Moderate
- Risk: Low
- Strike 115.0 (2024-08-16):
- Reward: High
- Risk: Moderate
- Strike 110.0 (2024-10-18):
- Reward: Extremely High
- Risk: Significant
- Strike 120.0 (2024-11-15):
- Reward: High
- Risk: Moderate
- Strike 110.0 (2025-01-17):
- Reward: Extremely High
- Risk: High
By analyzing and obtaining short call options with differing expiration dates and matching our criteria of Greeks and premiums, we can diversify the calendar spread. Balancing between short-term and long-term positions, STRA provides various profitable opportunities with calculated assignment risks.
Calendar Spread Option Strategy #2
To devise a profitable calendar spread strategy for Strategic Education, Inc. (STRA), we need to analyze the given options data meticulously and align it with our risk-reward goals, while minimizing the risk of having shares assigned. The objective is to sell a put option at one expiration date and buy a call option at a different date, leveraging the "Greeks" to gauge sensitivities and potentials.
Strategy 1: Near-Term to Mid-Term
Sell Put: Strike \$135, Expires 2024-07-19
- Delta: 0.015
- Gamma: 0.0039
- Vega: 0.4941
- Theta: -0.037
- Premium: \$1.25
Buy Call: Strike \$115, Expires 2024-08-16
- Delta: 0.422
- Gamma: 0.0287
- Vega: 13.068
- Theta: -0.0827
- Premium: \$2.85
By selling a near-term put with a low delta (0.015), we minimize the risk of having shares assigned, as a low delta indicates that the option is far out-of-the-money (OTM). For the call option, we purchase a slightly longer-term call with significant vega (13.068) and moderate delta (0.422). The premium generated from selling the put (\$1.25) helps offset the premium paid for the call (\$2.85), reducing the net debit to \$1.60. This strategy banks on the stock maintaining or slightly increasing in price.
Strategy 2: Short-Term to Long-Term
Sell Put: Strike \$130, Expires 2024-07-19
- Delta: 0.0154
- Gamma: 0.0049
- Vega: 0.5054
- Theta: -0.0307
- Premium: \$0.23
Buy Call: Strike \$110, Expires 2024-10-18
- Delta: 0.569
- Gamma: 0.0204
- Vega: 22.258
- Theta: -0.0414
- Premium: \$7.42
Here, the shorter-term put has a delta of 0.0154, indicating it is quite OTM and decreases the risk of assignment. The long-term call option has a high vega (22.258) and a solid delta (0.569), which provides a significant hedge against volatility. The cost is offset partly by the \$0.23 premium from the put, creating a net debit of \$7.19.
Strategy 3: Mid-Term
Sell Put: Strike \$140, Expires 2024-11-15
- Delta: 0.199
- Gamma: 0.0107
- Vega: 18.080
- Theta: -0.0302
- Premium: \$4.5
Buy Call: Strike \$120, Expires 2024-11-15
- Delta: 0.364
- Gamma: 0.0206
- Vega: 24.240
- Theta: -0.0292
- Premium: \$5.7
This mid-term strategy involves selling a put option with a delta of 0.199, which has a higher probability of staying OTM compared to the previous strategies. The call, bought at the same expiration, has lower theta decay and a high vega (24.240), providing strong coverage against volatility. The net debit stems from a difference in premiums (\$5.7 - \$4.5 = \$1.2), making this a cost-efficient option strategy.
Strategy 4: Mid to Long-Term
Sell Put: Strike \$110, Expires 2025-01-17
- Delta: 0.577
- Gamma: 0.0143
- Vega: 30.728
- Theta: -0.0301
- Premium: \$10.35
Buy Call: Strike \$110, Expires 2024-10-18
- Delta: 0.569
- Gamma: 0.0204
- Vega: 22.258
- Theta: -0.0414
- Premium: \$7.42
The remarkable overlap in deltas (both around 0.57) indicates an individual equilibrium situation. The long premium (\$10.35) from the put considerably cushions the call option's premium (\$7.42), perfecting a net credit of \$2.93. High vega signifies strong volatility coverage in the underwriting tenure.
Strategy 5: Long-term
Sell Put: Strike \$135, Expires 2025-01-17
- Delta: 0.212
- Gamma: 0.0127
- Vega: 22.975
- Theta: -0.0186
- Premium: \$3.0
Buy Call: Strike \$115, Expires 2025-01-17
- Delta: 0.577
- Gamma: 0.0143
- Vega: 30.728
- Theta: -0.0301
- Premium: \$10.35
This long-term strategy, based on concurrent expiration dates, maximizes vega with lower theta degradation. The net debit (\$7.35) stems from the difference in premiums, substantiating a stronger gearing towards price volatility and time decay.
Conclusion
Among these strategies, the most profitable, reducing risk while offering significant returns, appears to be Strategy 4 balancing a high net credit backed by consistent deltas, minimizing the risk of underlying share assignment while leveraging volatility and time decay for optimal returns.
Similar Companies in Chemicals - Specialty:
Element Solutions Inc (ESI), DoubleVerify Holdings, Inc. (DV), CECO Environmental Corp. (CECO), American Public Education, Inc. (APEI), Grand Canyon Education, Inc. (LOPE), Adtalem Global Education Inc. (ATGE), Chegg, Inc. (CHGG), Coursera, Inc. (COUR), Perdoceo Education Corporation (PRDO), Zovio Inc. (ZVO)
https://finance.yahoo.com/news/strategic-educations-nasdaq-stra-three-165211779.html
https://finance.yahoo.com/news/strategic-education-inc-schedules-second-201000149.html
https://finance.yahoo.com/news/strategic-education-inc-nasdaq-stra-163910934.html
https://www.sec.gov/Archives/edgar/data/1013934/000101393424000007/stra-20240331.htm
Copyright © 2024 Tiny Computers (email@tinycomputers.io)
Report ID: 117HLz
Cost: $0.34306
https://reports.tinycomputers.io/STRA/STRA-2024-07-13.html Home