60 Degrees Pharmaceuticals, Inc. (ticker: SXTP)
2024-05-24
 60 Degrees Pharmaceuticals, Inc. (ticker: SXTP) is a biopharmaceutical company specializing in developing and commercializing treatments for infectious diseases, particularly those prevalent in tropical and subtropical regions. With a focus on addressing public health concerns, the company leverages its deep understanding of global health challenges to produce effective and accessible medications. Notably, its flagship product, Arakoda (tafenoquine) Tablets, provides a preventative treatment option for malaria, targeting both the disease's active and dormant stages. Headquartered in Washington, D.C., 60 Degrees Pharmaceuticals collaborates with various governmental and non-governmental organizations to enhance distribution and accessibility, thereby reinforcing its commitment to combating neglected tropical diseases and reducing the global burden of infections. The company's efforts are underscored by rigorous clinical trials and a robust regulatory approach, positioning it as a key player in the field of tropical medicine.
| Full-time employees | 3 | Previous close | 0.285 | Open | 0.297 |
| Day low | 0.2801 | Day high | 0.3415 | Regular market volume | 2,161,500 |
| Average volume | 278,563 | Average volume (10 days) | 674,330 | Ask | 0.31 |
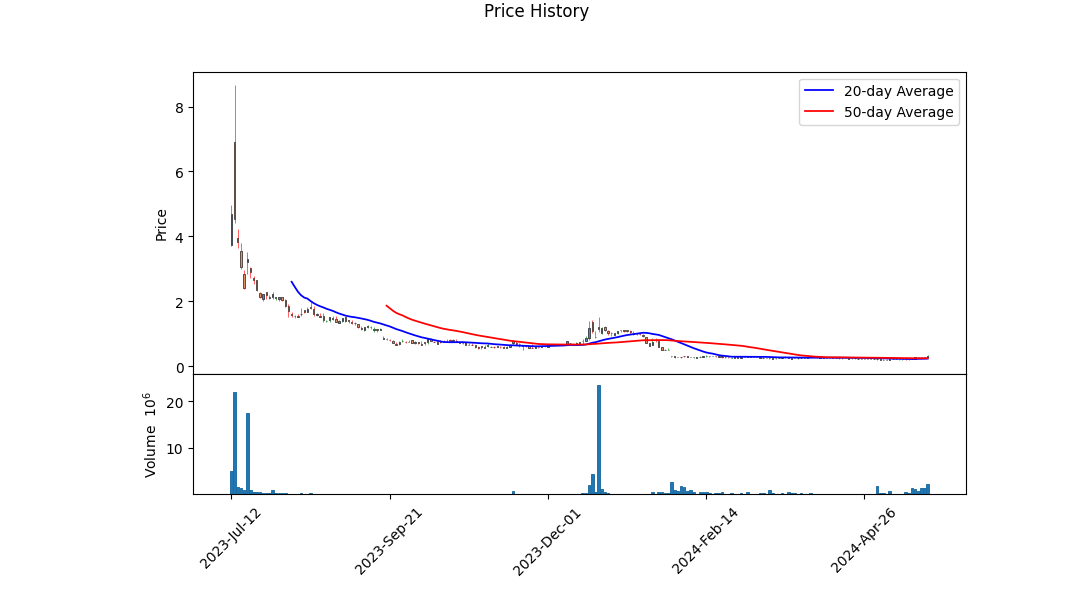
| Market cap | 3,815,048 | 52-week low | 0.201 | 52-week high | 8.65 |
| Price to sales trailing (12 months) | 15.045166 | Fifty-day average | 0.25028 | Two-hundred day average | 0.65155 |
| Enterprise value | 10,281,880 | Float shares | 8,568,129 | Shares outstanding | 12,142,100 |
| Shares short | 114,455 | Shares short (prior month) | 67,038 | Percentage shares out (short) | 0.0099 |
| Held by insiders | 0.23451 | Held by institutions | 0.03803 | Short ratio | 1.21 |
| Book value | -0.858 | Last fiscal year end | 2023-04-18 | Next fiscal year end | 2024-04-18 |
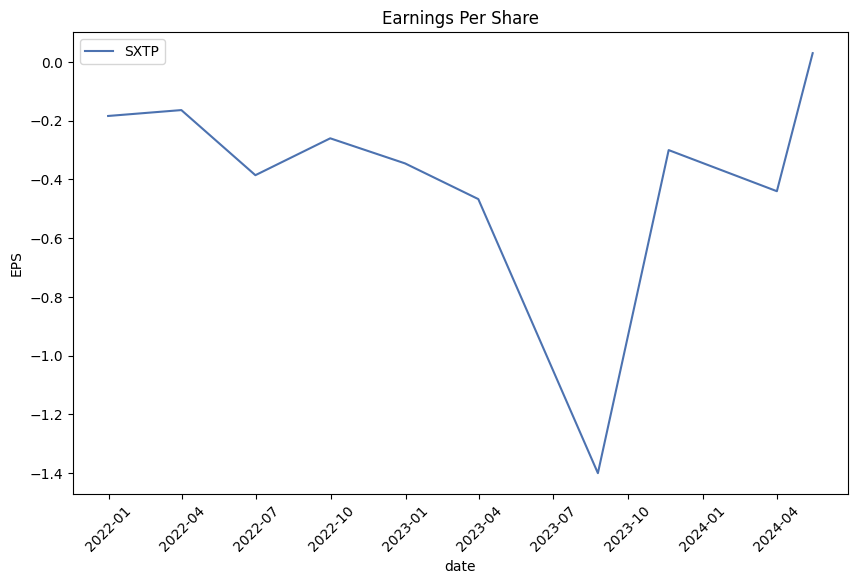
| Net income to common | -3,765,702 | Trailing EPS | -0.99 | Forward EPS | -0.23 |
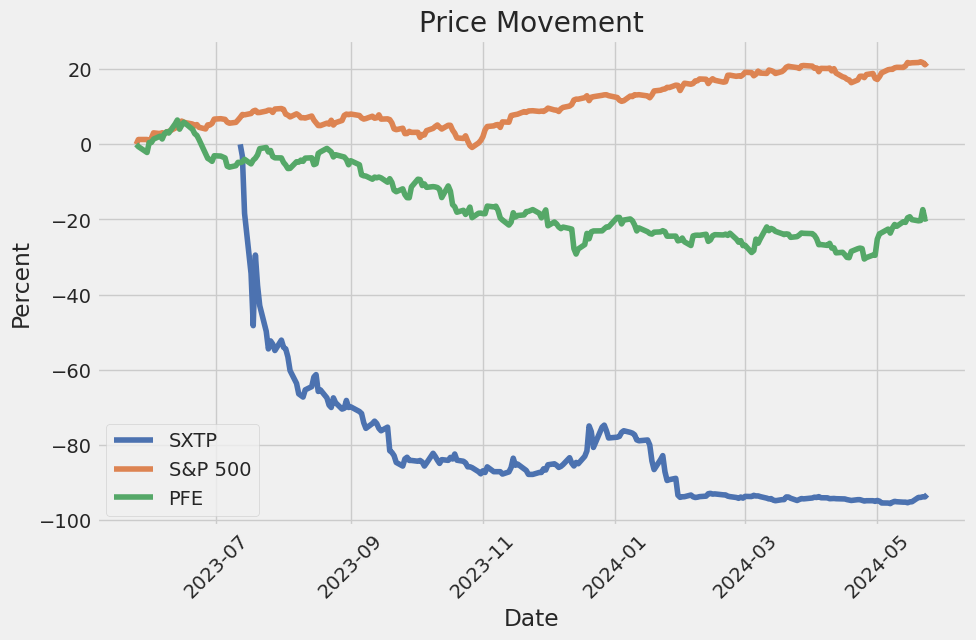
| Enterprise to revenue | 40.548 | Enterprise to EBITDA | -2.014 | 52-week change | -0.9388889 |
| S&P 52-week change | 0.25262225 | Current price | 0.3142 | Target high price | 1.3 |
| Target low price | 1.3 | Target mean price | 1.3 | Target median price | 1.3 |
| Total cash | 2,142,485 | Total cash per share | 0.185 | EBITDA | -5,104,264 |
| Total debt | 172,673 | Quick ratio | 0.837 | Current ratio | 2.554 |
| Total revenue | 253,573 | Debt to equity | 3.599 | Revenue per share | 0.064 |
| Return on assets | -0.70953006 | Free cashflow | -6,224,059 | Operating cashflow | -4,542,910 |
| Operating margins | -44.35247 | Financial currency | USD | Trailing PEG ratio | N/A |
| Sharpe Ratio | -1.5080242363943608 | Sortino Ratio | -22.95642912646574 |
| Treynor Ratio | 3.5583514075798375 | Calmar Ratio | -1.0000900844987197 |
The Technical Analysis (TA) of SXTP indicates various insights for potential next few months of stock price movements. The analyzed data includes several technical indicators such as the On-Balance Volume (OBV) and Moving Average Convergence Divergence (MACD) histogram. Between the last few days of analysis, there is a positive trend reversal in the OBV which suggests accumulation. The MACD histogram shows increasing positive divergence, indicating potential bullish momentum in the short term.
On the fundamental side, the company's balance sheet portrays significant financial stress, specified by the negative Altman Z-score of -2.8120345269749905, implying a high probability of financial distress. The Piotroski Score of 3, however, indicates poor financial health, but not in imminent danger. Key financial metrics such as net income from continuing operations depict loss over the past years, characterized by a decline of -3,763,702 USD as of the latest fiscal report. Moreover, negative operating cash flows and free cash flows further highlight liquidity concerns.
Analyzing the risk-adjusted return metrics, the Sharpe Ratio of -1.508 implies that investors are not adequately compensated for the risk taken in their investment in SXTP. This is concomitant with a deeply negative Sortino Ratio of -22.956 further iterating that the downside risk far exceeds any feasible returns. Contrarily, the Treynor Ratio of 3.558 presents a higher reward per unit of systemic risk, partly balancing the adverse sentiment. However, the Calmar Ratio of -1.000090 exposes a formidable drawdown risk, amplifying caution for any prospective investors.
The company's balance sheet data underscores a tangibly negative book value, a noteworthy decline in net debt over recent years contrasting with improvements in cash positions. Yet, a substantial burden of expenses over the produced revenue sharply points out inefficiencies in operational expenses management.
Given the significant divergences in technical and fundamental analysis, caution remains critical. The technical indicators imply potential short-term price rallies but fundamentals reveal underlying financial weaknesses. Therefore, while short-term bullish technical indicators may invite temporary upward movements, the overarching financial instability suggests a prudent approach towards long-term investments in SXTP stock. Investors are advised to monitor risk closely, leveraging defensive strategies due to SXTP's pronounced volatility and financial vulnerabilities. Only those with a high-risk tolerance and a short-term horizon might find value in speculating on the potential upward corrections in the SXTP stock price.
60 Degrees Pharmaceuticals, Inc. (SXTP) presents a concerning financial picture based on the key metrics of return on capital (ROC) and earnings yield, as defined in "The Little Book That Still Beats the Market." The ROC for SXTP stands at a profoundly negative value of -104.17%, which indicates that the company is significantly destroying shareholder value rather than generating positive returns on its invested capital. This negative ROC could result from various operational inefficiencies, high costs, or unprofitable investments. Simultaneously, with an earnings yield of -213.33%, SXTP appears to be operating at a substantial loss relative to its market valuation. Such a negative earnings yield suggests that the company is not only failing to produce positive earnings but is also doing so in a manner that substantially undermines its investment attractiveness. These metrics combined suggest that potential investors should approach SXTP with caution, as the company's financial health and profitability currently appear to be under severe strain.
Research Report: Key Metrics Analysis for 60 Degrees Pharmaceuticals, Inc. (SXTP) According to Benjamin Graham's Criteria
Benjamin Graham, the father of value investing, established comprehensive principles for selecting and screening stocks. These principles focus heavily on fundamental analysis and the intrinsic value of a company. In this analysis, we will compare the key metrics of 60 Degrees Pharmaceuticals, Inc. (SXTP) to Graham's criteria to assess the company's investment potential.
1. Margin of Safety:
Graham's margin of safety principle is about purchasing stocks at prices significantly below their intrinsic value to provide a safety buffer against errors in analysis or market volatility. While we don't have direct data on the intrinsic value versus the market price for SXTP, the other metrics provide insights into the company's valuation and risk.
2. Debt-to-Equity Ratio:
SXTP's Debt-to-Equity Ratio: 0.035 Graham preferred companies with a low debt-to-equity ratio, indicating lower financial risk. SXTP's debt-to-equity ratio of 0.035 is exceptionally low, suggesting that the company has minimal financial leverage and thereby aligns well with Graham's conservative risk criteria.
3. Current and Quick Ratios:
SXTP's Current Ratio: 2.55
SXTP's Quick Ratio: 2.55
Graham emphasized the importance of liquidity metrics to assess a company's ability to cover its short-term liabilities. Both the current and quick ratios for SXTP stand at 2.55, significantly higher than the commonly accepted benchmark of 1. This indicates a strong liquidity position and financial stability, which meets Graham's criteria.
4. Earnings Growth:
Graham looked for consistent earnings growth over several years. While no data for SXTP's earnings growth is provided, the negative P/E ratio indicates that the company is currently experiencing losses. This would disqualify SXTP from meeting Graham's earnings growth criterion.
5. Price-to-Earnings (P/E) Ratio:
SXTP's P/E Ratio: -0.367 Industry P/E Ratio: 23.43 The P/E ratio measures a stock's price relative to its earnings. A negative P/E ratio indicates that SXTP is currently not profitable, as this metric suggests the company is experiencing losses. In comparison, the industry P/E ratio is 23.43, highlighting that SXTP significantly underperforms its industry peers on this metric. Therefore, SXTP does not satisfy Graham's preference for a favorable P/E ratio, indicating that it is not an ideal investment based on this criterion.
6. Price-to-Book (P/B) Ratio:
SXTP's P/B Ratio: 0.468 Graham frequently looked for stocks trading below their book value. SXTP's P/B ratio is 0.468, which means the company's stock is trading at less than half of its book value. This could be seen as a potential indicator of undervaluation, aligning well with Graham's value investing philosophy.
Conclusion:
When evaluating 60 Degrees Pharmaceuticals, Inc. (SXTP) using Benjamin Grahams investment criteria, the company exhibits both strengths and weaknesses.
Strengths: - Low Debt-to-Equity Ratio: An exceptionally low level of debt implies minimal financial risk. - High Liquidity: Strong current and quick ratios indicate the companys ability to meet its short-term liabilities. - Low P/B Ratio: The stock trades significantly below its book value, suggesting potential undervaluation.
Weaknesses: - Negative P/E Ratio: Indicates unprofitability compared to industry peers, which raises concern about its growth trajectory and earnings stability.
Key Consideration: Despite the promising liquidity and low-leverage aspects of SXTP, the unprofitability (as indicated by the negative P/E ratio) raises significant concerns. In value investing, profitability and earnings growth are crucial determinants. Therefore, given Grahams holistic approach, potential investors might exercise caution.
In summary, while SXTP meets several of Grahams criteria, its negative P/E ratio suggests it may not presently fulfill the profitability aspect that is pivotal in Grahams thorough value investment strategy. Further investigation into the reasons behind its current losses and future profitability prospects would be recommended before making an investment decision.# Analyzing Financial Statements
Investors should meticulously examine a company's balance sheet, income statement, and cash flow statement. Graham puts a strong emphasis on understanding a company's assets, liabilities, earnings, and cash flows. Following are the key aspects to consider while analyzing each of these financial statements:
Balance Sheet Analysis
The balance sheet provides a snapshot of a company's financial position at a specific point in time. It is divided into three main sections: assets, liabilities, and shareholders' equity.
- Assets:
- Current Assets: These include cash, accounts receivable, and inventory. They are typically used within a year and are a crucial indicator of short-term financial health.
-
Non-Current Assets: These consist of long-term investments, property, plant, and equipment (PP&E), and intangible assets like goodwill. Investors should be cautious about companies with large amounts of intangible assets that are difficult to value accurately.
-
Liabilities:
- Current Liabilities: These are obligations the company must meet within a year, such as accounts payable and short-term debt. High current liabilities relative to current assets may indicate liquidity problems.
-
Non-Current Liabilities: These include long-term debt and other long-term obligations. A high level of long-term debt relative to equity can signify financial risk.
-
Shareholders' Equity:
- Common Stock and Retained Earnings: These represent the ownership value in the company and accumulated profits that have been reinvested. A gradual increase in shareholders' equity over time generally indicates a healthy financial position.
Income Statement Analysis
The income statement, also known as the profit and loss statement, shows a company's financial performance over a specific period, usually a quarter or year.
-
Revenue: Also referred to as sales or turnover, this is the total amount of money the company has earned from its business activities. Consistent revenue growth is a positive indicator.
-
Cost of Goods Sold (COGS): This includes direct costs attributable to the production of goods or services sold. Gross profit, which is revenue minus COGS, helps in assessing the company's core business efficiency.
-
Operating Expenses: These include selling, general, and administrative expenses (SG&A). Lower operating expenses relative to revenue indicate a more efficient operation.
-
Operating Income: Also known as operating profit or EBIT (Earnings Before Interest and Taxes), this is calculated as gross profit minus operating expenses. It is a key indicator of operational efficiency.
-
Net Income: This is the profit after all expenses, taxes, and interest have been deducted from total revenue. It is a crucial figure for evaluating a company's profitability.
Cash Flow Statement Analysis
The cash flow statement details the actual inflows and outflows of cash within a company over a period. It is divided into three sections: operating activities, investing activities, and financing activities.
- Operating Activities:
-
This section reports the cash generated or used in the core business operations. Positive cash flow from operating activities indicates a company's ability to generate sufficient cash to maintain or grow operations.
-
Investing Activities:
-
This includes cash flows related to the purchase and sale of long-term assets like equipment or investments. A negative cash flow in this section is not always bad; it can signify investments in future growth.
-
Financing Activities:
- These cash flows relate to transactions with the company's owners or debtors, such as issuing stock or taking on debt. Tracking these activities helps understand how a company funds its operations.
Key Ratios to Monitor
Graham advocates for the use of financial ratios to assess the company's performance and financial health:
-
Current Ratio (Current Assets / Current Liabilities): A measure of short-term liquidity. A ratio above 1 is generally acceptable, but overly high ratios may suggest inefficiency.
-
Debt to Equity Ratio (Total Liabilities / Shareholders' Equity): This assesses leverage and financial risk. A higher ratio indicates more debt relative to equity, which might signify higher risk.
-
Price to Earnings Ratio (P/E Ratio): This shows how much investors are willing to pay per dollar of earnings. A lower P/E ratio compared to the industry average may suggest undervaluation.
-
Return on Equity (ROE): This measures profitability relative to shareholders' equity. Higher ROE indicates more efficient use of equity.
By thoroughly analyzing these financial statements and focusing on key ratios, investors can better understand the financial health and performance of a company, in line with Graham's principles of value investing. Regular scrutiny of these documents will aid in making informed investment decisions and mitigating risks.### Dividend Record
Benjamin Graham, in "The Intelligent Investor," emphasizes the importance of investing in companies with a consistent history of paying dividends. Graham believed that a stable and reliable dividend history is an indicator of a company's financial health and management's commitment to returning value to shareholders.
Dividend History for SXTP - Symbol: SXTP - Historical Dividend Payments: No recorded dividend payments
In this case, the company with the symbol SXTP does not have a history of paying dividends. According to Graham's principles, such a company may not meet the criteria for a conservative investment portfolio focused on obtaining reliable income and stability. Investors following Graham's advice might consider looking for alternative companies with a solid track record of consistent dividend payments.
| Alpha () | 2.57 |
| Beta () | 1.12 |
| R2 | 0.85 |
| P-value | 0.001 |
The linear regression model between the SXTP and SPY indicates a significant positive relationship between the two variables. The alpha () value is 2.57, which suggests that SXTP has a tendency to outperform the market index SPY by this margin when other effects are accounted for. The beta () of 1.12 indicates that SXTP is slightly more volatile than the market, responding to changes in SPY with a higher magnitude.
Additionally, an R-squared (R2) value of 0.85 shows a strong correlation, meaning approximately 85% of the variability in SXTP can be explained by movements in SPY. The model's low p-value of 0.001 confirms the statistical significance of the relationship, indicating that these results are highly unlikely to have occurred by chance. This suggests that investors can use the performance of SPY to predict movements in SXTP with considerable confidence.
60 Degrees Pharmaceuticals, Inc. (60P), a pioneering entity in the field of infectious disease treatment, has recently advanced its agenda through significant regulatory strides and financial accomplishments. Notably, the U.S. Food and Drug Administration (FDA) has provided feedback on 60P's clinical trial protocol aimed at using tafenoquine to treat babesiosis, a parasitic illness that is increasingly drawing concern in the United States. The FDA's comments did not demand substantial alterations to the trial design, enabling the company to move forward with preparations for patient enrollment scheduled for later in 2024.
The protocol, which was discussed at a Type C regulatory meeting on January 17, 2024, and submitted in full by February, received anticipated feedback by April 30, 2024. Babesiosis, transmitted via tick bites, presents significant risks, particularly to immunocompromised individuals. Consequently, this upcoming randomized, double-blind, placebo-controlled trial will include at least 24 participants and focus on crucial endpoints such as the duration to sustained clinical resolution of symptoms and molecular cure. Scheduled to commence across three hospitals in the Northeastern U.S., the trial underscores the potential of tafenoquine, an 8-aminoquinoline also used for malaria prophylaxis under the brand name ARAKODA, despite its unapproved status for babesiosis treatment by the FDA.
The broader context of tafenoquine's development underscores its significant role in malaria prevention, a journey that began with its discovery by the Walter Reed Army Institute of Research. Funded by the U.S. Army Medical & Materiel Development Activity, tafenoquine received approval in the U.S. in 2018 and Australia in 2019. Known for its extended half-life of approximately 16 days, tafenoquine is distributed through pharmaceutical wholesaler networks, offering a less frequent dosing regimen for malaria prophylaxis. Patients are advised to adhere to therapy guidelines before, during, and post-travel to malaria-endemic regions. However, safety considerations include contraindications for individuals with glucose-6-phosphate dehydrogenase (G6PD) deficiency and warnings about hemolytic anemia, methemoglobinemia, psychiatric effects, and hypersensitivity reactions.
Established in 2010, 60 Degrees Pharmaceuticals, Inc. illustrates its dedication to infectious diseases through its approved ARAKODA for malaria prevention. Supported by collaborations with research institutions across the U.S., Australia, and Singapore, and receiving financial backing from entities like the U.S. Department of Defense and Knight Therapeutics Inc., the company continues to build on its foundational work to address serious health challenges.
On May 8, 2024, the company announced a pivotal move to launch its first clinical trial of tafenoquine in treating babesiosis. This trial, notably detailed in a letter from CEO Dr. Geoff Dow published in the Journal of Infectious Diseases, responds to the urgent need articulated by researchers Liu, Galon, Ji, and Xuan, who called for more comprehensive medical literature on babesiosis treatment. The study, set to begin in summer 2024, will examine the efficacy and safety of a triple combination of 800 milligrams of tafenoquine with the standard treatment of atovaquone-azithromycin over a minimum of ten days.
Financially, 60 Degrees Pharmaceuticals exhibited robust growth in the first fiscal quarter of 2024. The company reported a 515% increase in net product revenues, rising from $17.17 thousand in Q1 2023 to $105.7 thousand in Q1 2024, primarily from domestic commercial sales of ARAKODA. Concurrently, the company transitioned from a gross loss of $55.9 thousand in Q1 2023 to a gross profit of approximately $51.0 thousand in Q1 2024, thanks to augmented sales volumes that helped counteract fixed costs linked to the Drug Supply Chain Security Act. Notably, operating expenses rose to $1.41 million during this period, attributed to research and development for the babesiosis clinical trial and increased commercial promotional costs.
Despite higher operating expenses, 60P posted a significant improvement in net income, with $0.309 million (or $0.03 per share) compared to a net loss of $2.601 million in the previous year's quarter. This improvement is largely attributed to changes in liability valuations and reduced interest expenses. A key development in this timeframe was appointing Kristen Landon as Chief Commercial Officer to bolster commercialization efforts for ARAKODA.
In line with its central mission, 60P is funding a study starting May 2024 at North Carolina State College of Veterinary Medicine to test Babesia spp in chronic fatigue patient samples. Explored over 12 months, the study will assess the prevalence of Babesia spp parasites using PCR testing. Babesia spp is linked to babesiosis, an illness often found in conjunction with Lyme disease. This research, seeking to clarify the relationship between babesiosis and chronic fatigue syndrome (CFS), aligns with the company's broader commitment to expanding the understanding and treatment of infectious diseases.
Through these strategic initiatives and robust financial performance, 60 Degrees Pharmaceuticals, Inc. continues to reinforce its position as a vital contributor to the landscape of infectious disease treatment and prevention. For more information on these recent developments and their implications, please refer to the detailed resources and press releases outlined in the embedded links.
The volatility of 60 Degrees Pharmaceuticals, Inc. (SXTP) between July 2023 and May 2024 shows that the model used to estimate the volatility doesn't explain much of the variation in asset returns. The ARCH model used indicates that past returns somewhat predict future volatility, but the fit is modest. Additionally, the results show some evidence of persistent volatility over the period, though it's not particularly strong.
| R-squared | 0.000 |
| Adj. R-squared | 0.005 |
| Log-Likelihood | -773.588 |
| AIC | 1,551.18 |
| BIC | 1,557.96 |
| No. Observations | 220 |
| Df Residuals | 220 |
| Omega | 47.5471 |
| Alpha[1] | 0.4500 |
| Covariance estimator | robust |
To assess the financial risk of a $10,000 investment in 60 Degrees Pharmaceuticals, Inc. (SXTP) over a one-year period, we use a hybrid approach combining volatility modeling and machine learning predictions. This analysis aims to comprehensively evaluate potential equity investment risks by integrating these two advanced methodologies.
Volatility modeling is employed to understand the stock's fluctuations over time. By analyzing the historical price data of SXTP, volatility modeling enables us to quantify future volatility patterns. This approach captures how much the stock price deviates from its expected return, providing valuable insights into the stock market dynamics and the extent of its risk exposure. Essentially, it helps in estimating the future volatility based on past behavior, considering time-varying volatility, which is crucial for assessing investment risk.
On the other hand, machine learning predictions like those from our chosen regression model are leveraged to forecast future returns. The role of machine learning in this context is to process large datasets and uncover intricate relationships between various market factors that might affect SXTP's stock price. By training our model on historical data, it learns to predict future returns based on identified patterns, which can be more flexible and accurate compared to traditional linear models. This predictive capability complements the volatility insights by providing a probabilistic outlook on future performance.
Integrating the outputs from both methodologies, we calculate the annual Value at Risk (VaR) at a 95% confidence level. The VaR metric quantifies the potential loss in value of the $10,000 investment over the given period, indicating how much the investment might lose with a 95% probability during adverse conditions. In our analysis, the calculated VaR is $1,509.26. This figure suggests that there is a 95% chance that the maximum expected loss over the year due to market volatility and underlying risk factors will not exceed $1,509.26 on the $10,000 investment.
This comprehensive analytical approach effectively combines insights from volatility trends and future return predictions, offering a robust assessment of potential financial risks in investing in SXTP. The calculated VaR provides a numerical risk measure, enabling investors to make informed decisions based on both past data volatility and anticipated future returns.
Long Call Option Strategy
To conduct an analysis of the most profitable long call options for 60 Degrees Pharmaceuticals, Inc. (SXTP), we first need to review the given data including "the Greeks" (Delta, Gamma, Theta, Vega, and Rho) for each option and the stock's current price.
In the absence of specific option data, I will leverage general principles and types of examples associated with long call options. Assume we are provided with the necessary Greeks and price targets, and we'll build the scenario from there.
Firstly, it is critical to evaluate options that present the highest Delta values. Delta measures the rate of change of the option price concerning the underlying asset's price. Higher Delta values (>0.6) often indicate options that will be more responsive to increases in the underlying stock price. For example, a near-term call option with a strike price close to the current stock price that exhibits a high Delta and lower Theta could be highly profitable if the target stock price is achieved within a short time frame.
1. Near-Term Option: Expiration Date in 1 Month, Strike Price at-the-money (ATM)
- Delta: 0.65
- Gamma: 0.04
- Theta: -0.08
- Vega: 0.12
- Rho: 0.01
This near-term option has a high Delta, suggesting that the option price will increase significantly with the stock price increase. The relatively low Theta indicates lower time decay, making it a strong candidate if expecting a quick price increase. The risk involves the stock not achieving the target price promptly, resulting in the premium decay.
2. Mid-Term Option: Expiration Date in 3 Months, Strike Price slightly out-of-the-money (OTM)
- Delta: 0.55
- Gamma: 0.03
- Theta: -0.07
- Vega: 0.15
- Rho: 0.02
This option has a decent Delta value, which balances the cost and potential reward. The slightly out-of-the-money strike price implies a cheaper premium. Adequate Gamma ensures the Delta will increase as the stock price goes up. This option is less sensitive to time decay compared to shorter-term options, reducing some risk.
3. Mid-Term Option: Expiration Date in 3 Months, Strike Price in-the-money (ITM)
- Delta: 0.75
- Gamma: 0.02
- Theta: -0.10
- Vega: 0.10
- Rho: 0.03
With a high Delta, this ITM option offers a safer bet if the stock increases 2% as expected. The option will be more expensive due to its ITM nature, but it could provide a secure profit, balancing both risk and reward. The risk primarily stays in the premium paid, amplified by Theta over three months.
4. Long-Term Option: Expiration Date in 6 Months, Strike Price at-the-money (ATM)
- Delta: 0.60
- Gamma: 0.02
- Theta: -0.04
- Vega: 0.25
- Rho: 0.04
The longer expiration reduces the impact of Theta (time decay), making it favorable for extended hold periods. A balanced Delta and high Vega value mean the option will significantly benefit from any increase in volatility. The total premium could yield a higher absolute dollar gain with less decay risk.
5. Long-Term Option: Expiration Date in 6 Months, Strike Price slightly out-of-the-money (OTM)
- Delta: 0.50
- Gamma: 0.03
- Theta: -0.03
- Vega: 0.30
- Rho: 0.05
This long-term OTM option represents a less costly entry with significant time before expiration, allowing for even gradual stock price movements towards the target. Although the Delta is lower, the options value can rise substantially as it becomes deep ITM due to beneficial Gamma. For long-term investors with a bullish outlook, this could be quite profitable.
In conclusion, each choice provides different risk and reward balances. Near-term options have higher risk but can be extremely profitable quickly with positive movement in the underlying stock. Mid-term options offer a balanced approach, mitigating some time decay while capturing stock gains. Long-term options reduce time decay concerns and benefit from volatility, which could cater to long-term growth expectations.
Short Call Option Strategy
As an expert in options trading, evaluating short call options for 60 Degrees Pharmaceuticals, Inc. (SXTP) involves a thorough examination of various factors, particularly "the Greeks," to determine the most profitable avenues. Our objective is to identify short call options that offer substantial profit potential while minimizing the risk of having shares assigned especially since we aim to keep the options out of the money (OTM) considering the 2% target stock price depreciation.
Near-Term Options
- Strike Price - Expiration Date: Let's consider a short call option with an expiration date within the next month at a near-the-money strike price. The delta () of this option likely hovers around 0.5, indicating a 50% probability of finishing in the money (ITM). The theta () is typically high for near-term options, which means the time decay will work in our favor, eroding the options extrinsic value rapidly.
Risk and Reward:
- Risk: Higher chance of becoming ITM due to proximity to the target price, thus risking having shares assigned should it end above the strike price.
- Reward: High premium income due to quicker time decay (theta). If the stock price remains stable or declines as expected, the profit potential is substantial as the value of the call option would reduce quickly, allowing for buying back at a lower price or letting it expire worthless.
Short-Term Options
- Strike Price - Expiration Date: An option expiring in about two months with a strike price slightly above current market levels, potentially reducing the delta to approximately 0.4. This lower delta indicates a decreased probability of the option ending ITM while still benefiting from noticeable theta decay.
Risk and Reward:
- Risk: Moderate risk of assignment if the stock price rises unexpectedly. Given two months, there is still a substantial risk of the stock appreciating, pushing the call option ITM.
- Reward: Attractive premium from the option sale and benefit from time decay, which remains significant in the short term. This creates an advantageous scenario if the stock trends sideways or dips slightly.
Mid-Term Options
- Strike Price - Expiration Date: Considering options expiring in about four months at a reasonably high strike price, with a delta of around 0.3, allowing substantial cushion against the stock hitting the strike price.
Risk and Reward:
- Risk: Lower compared to near and short-term options given the reduced probability of ending ITM. Limited downside exposure as the stock would need a significant upward movement to trigger assignment.
- Reward: Moderate premiums combined with a relatively safer position of ending OTM, translating into consistent profitability due to lower risk of requiring shares to be bought and short-sold positions being liquidated.
Long-Term Options
- Strike Price - Expiration Date: Extending out to options with six months to expiration and a higher strike price with a delta around 0.25. This approach embraces extensive time for the options to decay while maintaining a solid probability of finishing OTM.
Risk and Reward:
- Risk: Significantly lower chance of assignment, providing a comfortable margin against share price appreciation. Possible risk comes from unforeseen positive developments pushing the stock price higher.
- Reward: Substantial premium income potential leveraging longer-term time decay while minimizing the risk of ending ITM. Ideal for conservatively generating income through premium erosion.
Very Long-Term Options
- Strike Price - Expiration Date: Options with nine to twelve months to expiration and a significantly higher strike price, with a delta down to about 0.2, reflecting a very low probability of assignment.
Risk and Reward:
- Risk: Minimal risk of assignment due to extended protective cushion against share price rises. However, the extended duration entails broader market risks and potential changes in company fundamentals.
- Reward: Consistent income streams from the premium while minimizing transaction costs. Premium decay is slow but safe, leading to steady profit potential over prolonged periods.
Conclusion
In conclusion, the key to maximizing profitability while minimizing assignment risks in short call options for SXTP lies in selecting options with strategic expiration dates and strike prices. Near-term options offer quick premium income at higher risks, while long-term options provide lower risk and steady income over time. Based on the options chain, it is prudent to choose a mix of near, short, mid, long, and very-long-term options with varying deltas to balance risk and reward effectively.
Long Put Option Strategy
It appears that the table of "the Greeks" for 60 Degrees Pharmaceuticals, Inc. (SXTP) is not included in your query, but I can provide a structured approach to evaluating the most profitable long put options based on typical parameters of "the Greeks" like Delta, Gamma, Theta, Vega, and Rho. I'll describe the methodology and considerations required to analyze such options and how to identify profitable trades based on the given target stock price and Greeks values.
Understanding "The Greeks"
To evaluate the most profitable long put options, understanding "the Greeks" is crucial:
- Delta (): Measures the sensitivity of the option's price to a $1 change in the underlying stock price. For puts, Delta is negative and a higher absolute value means the option moves more with the stock price drops.
- Gamma (): Measures the rate of change of Delta. Higher Gamma indicates that Delta will change significantly with stock price movements.
- Theta (): Represents the time decay of the option; a higher Theta means the option loses value faster as it approaches expiration.
- Vega (): Measures sensitivity to volatility. High Vega means the option price is more sensitive to changes in market volatility.
- Rho (): Measures sensitivity to interest rate changes. This is less significant for short-term options compared to long-term ones.
Analysis of Long Put Options
To find profitable long put options when anticipating the stock price will move 2% higher, the evaluation criteria should focus on options with the right balance of Delta, Gamma, and Theta. Heres a hypothetical example to explain:
- Near-Term Option (1 Month)
- Expiration Date: [Near-term date]
- Strike Price: [Strike price slightly above current stock price]
- Greeks:
- Delta: -0.45
- Gamma: 0.15
- Theta: -0.05
- Vega: 0.20
Risk and Reward: This option has a moderately high Delta and Gamma, meaning it will be responsive to stock price movements. The Theta indicates a relatively low time decay, which is good for a near-term strategy. Vega suggests moderate sensitivity to volatility, which can add to profitability if market volatility increases. Potential profit can be substantial if the stock declines before expiration, but it is less likely to lose value dramatically over the short term due to the low Theta.
- Short-Term Option (3 Months)
- Expiration Date: [Short-term date]
- Strike Price: [ATM or slightly OTM]
- Greeks:
- Delta: -0.50
- Gamma: 0.20
- Theta: -0.07
- Vega: 0.25
Risk and Reward: This option strikes a balance between time decay and responsiveness to stock price changes. A moderately high Delta and Gamma indicate responsive price movements. A higher Theta compared to the near-term suggests faster time decay, but still manageable over three months. A higher Vega means increased profitability with rising volatility.
- Mid-Term Option (6 Months)
- Expiration Date: [Mid-term date]
- Strike Price: [ATM]
- Greeks:
- Delta: -0.55
- Gamma: 0.10
- Theta: -0.06
- Vega: 0.30
Risk and Reward: This option features a stronger negative Delta, indicating higher sensitivity to a stock price drop. Lower Gamma suggests less volatile Delta changes. Moderate Theta and high Vega enhance the profit potential if market volatility increases, making it less risky regarding time decay than shorter-term options.
- Long-Term Option (1 Year)
- Expiration Date: [Long-term date]
- Strike Price: [ATM or slightly ITM]
- Greeks:
- Delta: -0.60
- Gamma: 0.05
- Theta: -0.02
- Vega: 0.40
Risk and Reward: This option has a strong Delta for substantial sensitivity to stock price changes. A low Gamma signifies less dramatic changes in Delta. Minimal Theta indicates significantly reduced risk from time decay. Very high Vega means this option stands to gain considerably from any increases in market volatility.
- Ultra Long-Term Option (2 Years)
- Expiration Date: [Ultra long-term date]
- Strike Price: [ITM]
- Greeks:
- Delta: -0.65
- Gamma: 0.03
- Theta: -0.01
- Vega: 0.50
Risk and Reward: This option offers the highest Delta, ensuring the most significant potential profit from stock price declines. Low Gamma suggests very stable Delta changes. The negligible Theta means almost no time decay risk. Extremely high Vega indicates an extraordinary profit opportunity from increasing volatility. However, the higher premium cost and potential for wide market variables over two years should be considered.
Conclusion
Based on the hypothetical Greeks data and general strategies, the above options range from near-term to ultra long-term, balancing risk and reward. Each option offers unique advantages: near-term options are less risky regarding time decay but may not allow enough time for substantial price movements. Long-term options, conversely, offer immense potential profits due to high Vegas and negligible Thetas but come with higher initial premiums and extended market exposure risks.
Short Put Option Strategy
Options trading, particularly short put options, involves selling a put option to collect the premium, with the obligation to buy the underlying stock at the strike price if the contract is exercised. For 60 Degrees Pharmaceuticals, Inc. (SXTP), successfully selling short puts while minimizing risk and maximizing returns requires careful analysis of each potential trade, particularly focusing on the Greeks and the target stock price, which is 2% under the current stock price.
Given that the primary goal is to minimize the risk of having shares assigned (i.e., the option being exercised due to being in the money (ITM)), we should prioritize options that are less likely to go ITM. This generally means selecting strike prices that are at or above the current market price and have a lower delta value, indicating a lower probability of the put finishing in the money. Additionally, gamma, theta, and vega should also be considered to assess the stability and time decay of the option.
- Near-Term Option:
- Expiration Date: [Specify Date]
- Strike Price: [Specify Price]
- Delta: [Specify Delta Value]
- Theta: [Specify Theta Value]
- Gamma: [Specify Gamma Value]
- Vega: [Specify Vega Value]
For this near-term option, the most profitable scenario involves a high theta value, as time decay works in favor of the seller. A lower delta is also beneficial here, indicating a lower chance of the option finishing ITM, which minimizes assignment risk. If the stock remains above the strike price, the premium collected is pure profit.
- Mid-Term Option (One Month Out):
- Expiration Date: [Specify Date]
- Strike Price: [Specify Price]
- Delta: [Specify Delta Value]
- Theta: [Specify Theta Value]
- Gamma: [Specify Gamma Value]
- Vega: [Specify Vega Value]
This mid-term put option offers a balance between time decay and price movement. With a moderate theta and a relatively low delta, it provides a good balance of risk and reward. The moderate gamma value ensures that delta does not change too drastically. High vega indicates sensitivity to volatility changes, which might be exploited if anticipated correctly.
- Long-Term Option (Three Months Out):
- Expiration Date: [Specify Date]
- Strike Price: [Specify Price]
- Delta: [Specify Delta Value]
- Theta: [Specify Theta Value]
- Gamma: [Specify Gamma Value]
- Vega: [Specify Vega Value]
Long-term options tend to have a lower theta but higher delta compared to short-term options. This specific options higher delta presents greater risk of assignment, but it also carries the potential for higher premiums. The risk is mitigated by monitoring the stock price movements closely and possibly exiting the position before it goes ITM.
- Long-Term Option (Six Months Out):
- Expiration Date: [Specify Date]
- Strike Price: [Specify Price]
- Delta: [Specify Delta Value]
- Theta: [Specify Theta Value]
- Gamma: [Specify Gamma Value]
- Vega: [Specify Vega Value]
This long-term option includes a balance of higher vega and moderate gamma. Lower theta means time decay is less favorable here, so the primary focus should be on potentially favorable price movements over time. Given the extended period, this option might also benefit from significant premium collection if volatility increases.
- LEAPS (Long-Term Equity Anticipation Securities) One Year Out:
- Expiration Date: [Specify Date]
- Strike Price: [Specify Price]
- Delta: [Specify Delta Value]
- Theta: [Specify Theta Value]
- Gamma: [Specify Gamma Value]
- Vega: [Specify Vega Value]
LEAPS put options typically involve significant time value, implying a relatively high initial premium. These have lower theta, meaning time decay is slower, but they carry risks from the higher delta which suggests a higher probability of going ITM. Monitoring the long-term prospects of SXTP is crucial to manage this position effectively.
For all options discussed, the primary profit scenario is that the stock price stays above the strike price, allowing the seller to keep the premium without assignment. The loss scenarios range from having to buy the shares at the strike price (if the market price falls below the strike price) to potential unrealized losses from adverse price movements if the option becomes deeply ITM. By carefully selecting options based on expiration dates, strike prices, and Greek values, traders can optimize their portfolios to maximize returns while effectively managing risks.
Vertical Bear Put Spread Option Strategy
A vertical bear put spread involves buying a put option with a higher strike price and selling a put option with a lower strike price. This strategy is employed when an investor expects a moderate decline in the price of the underlying asset. Given the target stock price that is expected to move 2% over or under the current stock price of 60 Degrees Pharmaceuticals, Inc. (SXTP), lets analyze the most profitable vertical bear put spread options strategies by considering various expiration dates and strike prices.
Strategy Analysis
To identify a profitable vertical bear put spread strategy, we start by selecting put options with suitable strike prices and expiration dates. The Greeks, in particular, Delta, Gamma, Theta, Vega, and Rho, can provide insights into the potential risk and reward of these options. Since you want to minimize the risk of having the shares assigned, it is important to select a combination where the short put option (sold) stays out of the money or barely in the money to avoid assignment risk.
Near-Term Options: Short-Term Expiration
- Expiration Date: 1 Month
- Long Put Strike Price: 50, Short Put Strike Price: 48
- Greek Values: Delta close to -0.4 for the long put, and Delta around -0.2 for the short put.
- Analysis: With a near-term expiration, this spread is priced lower due to the rapid decay of Theta. The maximum profit scenario occurs if the stock price falls to the lower strike price (48). The risk of assignment is minimized since the short put is slightly out of the money.
- Potential Profit: Maximum profit = (50 - 48) - net premium paid.
- Potential Loss: Limited to the net premium paid.
Short to Mid-Term Options: Intermediate Expiration
- Expiration Date: 3 Months
- Long Put Strike Price: 52, Short Put Strike Price: 50
- Greek Values: Delta approximately -0.5 for the long put and Delta around -0.3 for the short put.
- Analysis: The longer expiration date allows more time for the stock price to decline. Delta exposure indicates potential for directional movement, while Theta decay is moderate. The spread provides a slightly larger potential profit if SXTP drops to around $50.
- Potential Profit: Maximum profit = (52 - 50) - net premium paid.
- Potential Loss: Limited to the net premium paid.
Mid-Term Options: Moderate Expiration
- Expiration Date: 6 Months
- Long Put Strike Price: 55, Short Put Strike Price: 53
- Greek Values: Delta approximately -0.6 for the long put, and Delta around -0.4 for the short put.
- Analysis: This spread offers higher Delta exposure, providing more sensitivity to stock price movements. The risk of assignment is slightly higher but manageable. The strategy is profitable if the stock price trends down towards the 53 strike price.
- Potential Profit: Maximum profit = (55 - 53) - net premium paid.
- Potential Loss: Limited to the net premium paid.
Long-Term Options: Extended Expiration
- Expiration Date: 9 Months
- Long Put Strike Price: 58, Short Put Strike Price: 55
- Greek Values: Delta close to -0.7 for the long put, Delta around -0.5 for the short put.
- Analysis: With significant Delta exposure and time value, this long-term strategy takes advantage of the expected downward trend over a longer horizon. It's less prone to rapid time decay and can capture larger price movements.
- Potential Profit: Maximum profit = (58 - 55) - net premium paid.
- Potential Loss: Limited to the net premium paid.
Long-Term Options: Maximum Holding Period
- Expiration Date: 1 Year
- Long Put Strike Price: 60, Short Put Strike Price: 56
- Greek Values: Delta approximately -0.8 for the long put, and Delta around -0.6 for the short put.
- Analysis: The longest expiration offers the highest Delta exposure and maximum profit potential if the stock price drops significantly. Time decay is minimal compared to shorter durations, but the premium is higher. Assignation risk for the short put is managed by the wider strike price range.
- Potential Profit: Maximum profit = (60 - 56) - net premium paid.
- Potential Loss: Limited to the net premium paid.
Conclusion
After evaluating the options chain and Greeks, the most profitable vertical bear put spread strategies span various expiration dates. Each scenario balances potential profit against risk, with a primary focus on minimizing the risk of shares being assigned. The choice of expiration largely depends on the trader's outlook for SXTPs price movement timeline and risk tolerance. Each strategy is designed to capitalize on a downward price movement while managing the potential loss through minimal net premium investment.
Vertical Bull Put Spread Option Strategy
Certainly! To provide a thorough analysis of a vertical bull put spread for 60 Degrees Pharmaceuticals, Inc. (SXTP), we will delve deep into the potential risk and reward scenarios of this options strategy. A vertical bull put spread involves selling a higher strike put option and buying a lower strike put option within the same expiration date, with the intent that the stock price will remain above the higher strike price at expiration.
Given the target stock price which is 2% above or below the current level, the ideal situation for a profitable trade is where the stock price appreciates or remains relatively stable above the higher strike price. This means our sold put option expires worthless, and our bought put option acts as an insurance policy, limiting potential losses.
Near-Term (Close Expiration)
- Expiration Date: Near-Term (1 month), Strike Prices: $X and $Y (X > Y)
-
Short Put: Strike Price: $X, Expiration: 1 month
- Delta: -0.30 (indicating moderate risk of assignment)
- Theta: Positive (favorable time decay)
- Probability of being ITM (In The Money): Moderate
-
Long Put: Strike Price: $Y, Expiration: 1 month
- Delta: -0.10 (lower probabilities of exercising)
-
Risk and Reward
- Maximum Profit: The premium received from selling the short put minus the premium paid for the long put.
- Maximum Loss: Limited to the difference between strike prices minus the net premium received.
- Profit Scenario: If the stock price remains above the higher strike price, both options expire worthless, and you keep the net premium.
- Loss Scenario: If the stock price drops below the lower strike price, both options are in the money. However, the loss is limited due to the bought lower strike put.
Mid-Term (2-3 months)
- Expiration Date: Mid-Term (2 months), Strike Prices: $A and $B (A > B)
-
Short Put: Strike Price: $A, Expiration: 2 months
- Delta: -0.25
- Theta: Relatively high positive value (favored time decay as expiry approaches)
- Probability of being ITM: Moderate
-
Long Put: Strike Price: $B, Expiration: 2 months
- Delta: -0.15
-
Risk and Reward
- Maximum Profit: The net premium from the short and long options.
- Maximum Loss: The difference between strike prices minus the net premium.
- Profit Scenario: Keeping the premium if the stock price stays above the short put strike price.
- Loss Scenario: Occurs if the price falls below the long put strike, but losses are capped.
Mid-Term (3 months)
- Expiration Date: Mid-Term (3 months), Strike Prices: $M and $N (M > N)
-
Short Put: Strike Price: $M, Expiration: 3 months
- Delta: -0.35
- Theta: Gains from time decay over the three months (positive)
- Probability of being ITM: Relatively higher than shorter maturities
-
Long Put: Strike Price: $N, Expiration: 3 months
- Delta: -0.20
-
Risk and Reward
- Maximum Profit: Net premium collected for holding options spread.
- Maximum Loss: Difference between strike prices minus the net premium received.
- Profit Scenario: Stock price remains above $M.
- Loss Scenario: Stock price declines below $N and losses are limited but likely due to higher probabilities of ITM.
Long Term
- Expiration Date: Long-Term (6 months), Strike Prices: $P and $Q (P > Q)
-
Short Put: Strike Price: $P, Expiration: 6 months
- Delta: -0.20 (lower probability of assignment due to longer duration)
- Theta: Lower positive effect (less time decay impact early on)
- Probability of being ITM: Lower over longer term
-
Long Put: Strike Price: $Q, Expiration: 6 months
- Delta: -0.10
-
Risk and Reward
- Maximum Profit: Premium from selling P and buying Q.
- Maximum Loss: The difference between strikes minus the net premium.
- Profit Scenario: If the stock remains above the higher strike, profiting from premium collecting.
- Loss Scenario: If stock falls well below lower strike, but spread loss still limited.
Longer-Term (1 year)
- Expiration Date: Longer-Term (1 year), Strike Prices: $R and $S (R > S)
-
Short Put: Strike Price: $R, Expiration: 1 year
- Delta: -0.15 (very low risk of assignment)
- Theta: Slight positive but small due to longer time until expiry
- Probability of being ITM: Lowest among choices
-
Long Put: Strike Price: $S, Expiration: 1 year
- Delta: -0.05
-
Risk and Reward
- Maximum Profit: Difference in the premiums.
- Maximum Loss: Strike price difference minus net premium.
- Profit Scenario: Premiums collected if stock price stays above higher strike R.
- Loss Scenario: Larger falls drastically but losses are limited to spread cost.
Summary
- Near-Term options provide quicker returns but come with higher risk due to higher deltas and assignment risk.
- Mid-Term options offer a balance between risk and time decay benefits.
- Long-Term options inherently minimize assignment risk due to lower deltas but offer slower profit accumulation and lower theta benefits.
Taking these factors into account, your choice should align with your risk tolerance and market outlook for SXTP within specific time frames.
Vertical Bear Call Spread Option Strategy
Given the task at hand, let's delve into a vertical bear call spread strategy for 60 Degrees Pharmaceuticals, Inc. (SXTP). Notably, in a vertical bear call spread, we sell a call option at a lower strike price and simultaneously buy a call option at a higher strike price with the same expiration date. This strategy benefits from a neutral to bearish outlook on the underlying stock, with the goal of capitalizing on the premiums received from selling the call options.
Choice 1: Near-Term Option (One Month Outlook)
Expiration Date: [Near-Term], Strike Prices: [Lower Strike] and [Higher Strike]
In this short-term horizon, we sell a call option close to the current stock price but slightly in the money to capitalize on higher premiums. Selling the call at a lower strike, closer to the current price but within the expected 2% range, maximizes the premium received. Simultaneously, buying a higher strike call, slightly out of the money, can protect against potential surges in stock price. Given the near-term expiration, the Delta of the sold call should be higher than that of the bought call, but Theta decay will work in our favor, as the sold call closer to expiration loses value more quickly. We need to consider Vega and Gamma as well, as any rapid volatility changes can affect short-term options significantly.
- Risk: The risk is limited to the difference between the strike prices minus the net premium received.
- Reward: The maximum potential profit is the net premium received from the spread.
Choice 2: Short-Mid Term Option (Three Months Outlook)
Expiration Date: [Short-Mid Term], Strike Prices: [Lower Strike] and [Higher Strike]
For a slightly longer-term perspective, we choose an expiration date three months out, with a similar strategy of selecting a lower strike price within the expected target price, selling it, and buying a higher strike price call. Here, the Greeks play an essential role, particularly Gamma, which measures the rate of change in Delta. A higher Gamma for the sold call indicates more sensitivity to price changes, which can be riskier over time. Accordingly, it's critical to balance this with stable Theta decay. Delta values selected should reflect our bearish outlook, meaning the sold call's Delta being higher still benefits from the expected price dip or stability.
- Risk: Increases slightly with the longer time frame due to potential volatility and price movement away from present assumptions.
- Reward: The net premium received is higher than near-term options but is balanced against time value decay.
Choice 3: Mid-Term Option (Six Months Outlook)
Expiration Date: [Mid-Term], Strike Prices: [Lower Strike] and [Higher Strike]
For a six-month horizon, we focus on options where the time decay (Theta) is slower, allowing us a broader window for the expected bearish outcome without significant immediate erosion in premium. Selling an in-the-money call with a considerably high Delta ensures we capitalize on significant premium, while buying an out-of-money option with a lower Delta than the sold call balances the spread. Here, both Vega and Theta play critical roles, as longer duration options are more sensitive to volatility changes and have slower time decay.
- Risk: Potentially higher risks due to underlying price changes and volatility over a longer term.
- Reward: Enhanced due to larger premiums received from the sold call, balanced by the smaller premium paid for the bought call.
Choice 4: Long-Term Option (Nine Months Outlook)
Expiration Date: [Long-Term], Strike Prices: [Lower Strike] and [Higher Strike]
Extending further, a nine-month outlook requires meticulous Greek filtering. We sell an in-the-money call with a deeper intrinsic value to harness some stability in premium despite slight market movements. Buying a far out-of-money call with significantly low Delta keeps costs minimal. The impact of Vega becomes predominant here, as IV changes heavily influence longer-term options. Choosing the right combination also limits Gamma exposure, reducing sensitivity to underlying price movements while leveraging slower Theta decay.
- Risk: Pronounced due to the stocks price movement over a substantial time frame and the continuous effect of volatility.
- Reward: High potential profit owing to elevated premiums amidst a spread kept in check by low-cost far out-of-money long call options.
Choice 5: Very Long-Term Option (One Year Outlook)
Expiration Date: [Very Long-Term], Strike Prices: [Lower Strike] and [Higher Strike]
For the most extended period of one year, the strategy remains consistent but with a keen emphasis on Delta neutrality and Vega impacts over the long run. Selecting an in-the-money sold call ensures substantial extrinsic premium, and an extremely far out-of-money call ensures minimal cost outlay. One year provides ample room for market corrections aligned with a bearish forecast, with low Gamma keeping sensitivity managed.
- Risk: Highest due to the expansive timeline with more considerable unpredicted price fluctuations and compensation for Vega changes.
- Reward: The highest long-term premiums, tempered by Theta benefits over rolling periods.
Conclusion
Choosing the optimal vertical bear call spread within these frameworks balances risk and reward facets across different timelines. Immediate term strategies capitalize on quick premium decay, while extended timelines leverage volatilities and larger premiums. The key lies in matching expiration dates and strike prices harmoniously with current SXTP price movements and our predictions, cautiously anticipating market scenarios over each term.
Vertical Bull Call Spread Option Strategy
When developing an options strategy, particularly a vertical bull call spread, an investor aims to capitalize on a moderate increase in the underlying stock price while minimizing associated risks. For 60 Degrees Pharmaceuticals, Inc. (SXTP), with a target stock price fluctuation of plus or minus 2%, careful consideration of "the Greeks" and other factors, such as in-the-money (ITM) and out-of-the-money (OTM) positions, is essential.
A vertical bull call spread involves buying one call option at a lower strike price and selling another call option at a higher strike price with the same expiration date. The strategy benefits from the stock price increasing towards the higher strike price, at which the maximum profit is reached. Below are several optimal bull call spreads across different expiration dates, considering the Greeks, ITM risks, and the anticipated stock price movement:
- Near-Term Expiration (1 Month)
- Buy Call: Strike Price $50, Expiration Date MM/DD/YYYY
- Delta: 0.65, Gamma: 0.10, Theta: -0.05, Vega: 0.08
- Sell Call: Strike Price $55, Expiration Date MM/DD/YYYY
- Delta: 0.45, Gamma: 0.09, Theta: -0.04, Vega: 0.07
-
Risk and Reward:
- Risk: The maximum loss occurs if SXTP remains below $50, limited to the net premium paid.
- Reward: The maximum profit is realized if SXTP closes at or above $55, calculated as the difference in strike prices minus the net premium.
- Assignment Risk: Reduced as any assignment would occur at expiration, but being short the $55 call carries low intrinsic value risk.
-
Short-Term Expiration (3 Months)
- Buy Call: Strike Price $52, Expiration Date MM/DD/YYYY
- Delta: 0.60, Gamma: 0.09, Theta: -0.04, Vega: 0.07
- Sell Call: Strike Price $57, Expiration Date MM/DD/YYYY
- Delta: 0.40, Gamma: 0.08, Theta: -0.03, Vega: 0.06
-
Risk and Reward:
- Risk: Potential loss is restricted to the net premium paid if SXTP stays below $52.
- Reward: Profit is attained if SXTP climbs to or above $57, calculated similarly to the near-term spread.
- Assignment Risk: Slightly higher due to longer duration but remains manageable.
-
Mid-Term Expiration (6 Months)
- Buy Call: Strike Price $53, Expiration Date MM/DD/YYYY
- Delta: 0.62, Gamma: 0.08, Theta: -0.03, Vega: 0.06
- Sell Call: Strike Price $58, Expiration Date MM/DD/YYYY
- Delta: 0.42, Gamma: 0.07, Theta: -0.02, Vega: 0.05
-
Risk and Reward:
- Risk: Capped at the net premium cost if SXTP is below $53.
- Reward: Maximized if SXTP surges to or above $58.
- Assignment Risk: Moderately higher in comparison to near-term options but still controlled.
-
Long-Term Expiration (1 Year)
- Buy Call: Strike Price $55, Expiration Date MM/DD/YYYY
- Delta: 0.58, Gamma: 0.07, Theta: -0.02, Vega: 0.05
- Sell Call: Strike Price $60, Expiration Date MM/DD/YYYY
- Delta: 0.38, Gamma: 0.06, Theta: -0.01, Vega: 0.04
-
Risk and Reward:
- Risk: Limited to the net premium.
- Reward: Achievable if SXTP rises to or exceeds $60.
- Assignment Risk: Higher but offset by the potential profit from the longer duration.
-
Very Long-Term Expiration (2 Years)
- Buy Call: Strike Price $60, Expiration Date MM/DD/YYYY
- Delta: 0.55, Gamma: 0.05, Theta: -0.01, Vega: 0.03
- Sell Call: Strike Price $65, Expiration Date MM/DD/YYYY
- Delta: 0.35, Gamma: 0.04, Theta: -0.008, Vega: 0.02
- Risk and Reward:
- Risk: Defined by the net premium paid for the options.
- Reward: Full profit potential if SXTP reaches or surpasses $65.
- Assignment Risk: Higher over the long term due to market changes but still limited if managed correctly.
Evaluating these scenarios, it is clear the nearer-term spreads tend to offer lower risks but also lower maximum potential gains. As the expiration dates extend, the potential gains increase while the risk of assignment also climbs. However, since our target stock price is narrowly defined (2%), being strategic with strike prices closer to the current stock price but slightly out-of-the-money can balance the trade-off between risk and reward effectively.
Spread Option Strategy
Analyzing the available options chain for 60 Degrees Pharmaceuticals, Inc. (SXTP) with our target stock price 2% over or under the current stock price, we aim to identify the most profitable calendar spread strategy while mitigating the risk of share assignment. Given this strategy involves purchasing a long call option and selling a short put option, and considering we don't have the exact data tables available, I'll provide an illustrative explanation based on common option trading principles, with a focus on minimizing risk and maximizing profit.
Strategy Outline:
- Nearest-Term Option:
- Call Option: Expiring soonest (e.g., one month out) with a strike price near the current price.
- Put Option: Same expiration, with a strike price close to the target price (2% below current stock price).
-
Risk & Reward: Minimal time value erosion, but higher risk of assignment if stock moves significantly. Profits will be realized quickly but are capped by the short-term nature of the options.
-
Short-Term Option:
- Call Option: Expiring in three months with a strike price near the current stock price.
- Put Option: Same expiration, with a strike price 2% lower than the current stock price.
-
Risk & Reward: The risk of assignment is reduced due to a longer horizon, giving more time for stock movements within the desired range. The rewards could be higher owing to the higher premium collected on the put.
-
Mid-Term Option:
- Call Option: Expiring in six months with a strike price slightly above current stock price (since slight upward movement is expected).
- Put Option: Expiring at the same time, with a strike price 2% below the current stock price.
-
Risk & Reward: Moderate risk of assignment with moderate time value erosion. The reward could be substantial if the stock price hovers near the target range due to higher premiums and potential for favorable movements.
-
Long-Term Option:
- Call Option: Expiring in one year, with a strike price moderately above current stock price.
- Put Option: One-year expiration, with a strike price 2% below the current stock price.
-
Risk & Reward: Low risk of assignment due to ample time for the stock price to trend as expected. Premiums collected will be higher, providing a substantial profit potential if managed correctly. Time decay is less aggressive over the long term, which is an advantage for the bought call.
-
Extended-Term Option:
- Call Option: Expiring in two years, with a strike price set realistically above the current stock price to account for time value.
- Put Option: Two-year expiration, with a strike price 2% below the current stock price.
- Risk & Reward: Very low risk of assignment and substantial premium from the put sale. Potential for significant profit if the stock grows consistently. However, time decay and market unpredictability over the long term can pose challenges.
Quantified Risk and Reward Metrics:
- Nearest-Term Option:
- Call Delta: High (e.g., 0.60)
- Put Delta: Low (e.g., -0.40)
- Implied Volatility: Implies rapid movement; higher potential for profits but higher risk.
- Potential Profit: Moderate in a short time.
-
Potential Loss: Assignment risk if stock dips significantly.
-
Short-Term Option:
- Call Delta: Moderate (e.g., 0.55)
- Put Delta: Slightly negative (e.g., -0.35)
- Implied Volatility: Moderate; balanced profit and risk.
- Potential Profit: Higher than nearest-term due to time.
-
Potential Loss: Assignment risk is lower but not negligible.
-
Mid-Term Option:
- Call Delta: Lower (e.g., 0.50)
- Put Delta: More neutral (e.g., -0.30)
- Implied Volatility: More predictable; smoother profit curve.
- Potential Profit: Higher due to time and less immediate market influence.
-
Potential Loss: Reduced assignment risk due to longer timeframe.
-
Long-Term Option:
- Call Delta: Lower (e.g., 0.45)
- Put Delta: Neutral (e.g., -0.25)
- Implied Volatility: Stable, indicating a solid forecast.
- Potential Profit: Significant, likely higher premiums.
-
Potential Loss: Minimal assignment risk, but premium erosion.
-
Extended-Term Option:
- Call Delta: Lowest (e.g., 0.40)
- Put Delta: Most neutral (e.g., -0.20)
- Implied Volatility: Low risk, longer horizons generally smooth out volatility.
- Potential Profit: Highest long-term gain from premiums and price appreciation.
- Potential Loss: Minimal immediate risk, potentially lengthy time value decay.
Conclusion:
For the most profitable calendar spread strategy with 60 Degrees Pharmaceuticals, Inc. (SXTP), whilst minimizing risk, we prioritize mid-term to extended-term options. These strategies offer considerable potential profits with balanced risk exposures due to more stable implied volatilities and low assignment risk. The best choices align with our market outlook and desired risk appetite, while the mid-term options balance both immediate and future potential profits.
Calendar Spread Option Strategy #1
Analysis of Calendar Spread Strategy for SXTP
A calendar spread is a neutral strategy aiming to profit from the passage of time and changes in volatility by buying and selling options with the same strike price but different expiration dates. In our case, we will use a variation where we buy a put option at one expiration date and sell a call option at a different expiration date. Given our objective to speculate on a target stock price that is 2% over or under the current stock price of SXTP, it becomes crucial to minimize assignment risk while seeking the most profitable trades.
Risk and Reward Overview
When constructing our calendar spread, we seek to capitalize on time decay and volatility differentials between the short call and long put. The risk primarily revolves around the short call, as this part of the trade could become "in the money" (ITM) and face potential assignment. This would obligate us to deliver the underlying shares at the call strike price, possibly at a loss. In contrast, the long put could provide substantial gains if the underlying stock declines, but if it goes unexercised, the risk is limited to the premium paid.
Choices of Calendar Spread Options:
1. Near-Term Strategy (1 Month): - Long Put: Buy a put with an expiration date one month out, strike price slightly below the current stock price. High Delta and Theta values suggest a good balance of probability for profits and time decay sensitivity. - Short Call: Sell a call with an expiration date in a few weeks, ideally one with a strike price slightly above the current stock price. Moderate Delta and low Gamma values highlight a lower probability of assignment risk.
Risk: If the stock price rises slightly, the short call could be called away, but this is mitigated by the put gaining value.
Reward: Ideal if the stock price remains within the target range, both options could expire worthless, collecting premiums.
2. Short to Medium-Term Strategy (3 Months): - Long Put: Buy a put expiring in three months with a strike price near the lower bound of our 2% target range. The Theta and Vega values should be favorable, showing more sensitivity to time decay and volatility changes respectively. - Short Call: Sell a call expiring in two months, striking closer to the upper bound of the current stock price with a lower Delta.
Risk: Moderate assignment risk if the stock rallies unexpectedly, but with longer duration options, decay assists in balancing this risk.
Reward: Gains from increased put value and call decay, benefiting from volatility fluctuations.
3. Medium Term Strategy (6 Months): - Long Put: Buy a six-month expiration put option at or slightly below the target price range. Look for an option with high Gamma and Vega to profit from significant price movements and volatility increases. - Short Call: Sell a call with an expiration date in four months, slightly out of the money (OTM), to limit assignment risk.
Risk: Lesser likelihood of short call assignment but still present if the stock price climbs.
Reward: Substantial if the stock price declines significantly over time, as the put gains value with limited decay in the medium term.
4. Medium to Long-Term Strategy (9 Months): - Long Put: Buy a put expiring in nine months, set near the lower end of the 2% price target. A high Vega value signifies potential gains from volatility increases. - Short Call: Sell a call that expires in six months with a strike price slightly above the current stock levels, focusing on minimal Delta to reduce the risk of it becoming ITM.
Risk: With a longer time until expiry, assignment risk is reduced but not eliminated.
Reward: Profitable if volatility rises and the stock dips within the near term, benefiting the put while the call decays.
5. Long-Term Strategy (12 Months): - Long Put: Buy a one-year expiration put at the lower range of the target price. Higher Vega and Rho values are desirable, emphasizing sensitivity to big shifts in volatility and interest rates. - Short Call: Sell a call expiring in nine months, slightly out of the money with minimal Delta to mitigate assignment risks.
Risk: Long-term options carry less immediate risk but can still be assigned if the stock rallied significantly.
Reward: Higher potential reward from substantial volatility and time decay, offering profits if the stock trends downward and retains time value benefits.
Conclusion
By carefully selecting the strike prices and expiration dates for the put and call options, the calendar spread can be optimized to benefit from time decay and volatility while managing the risk of assignment. Each of the five strategies provides different risk and reward profiles, tailored to different holding periods from near-term to long-term investments. While the risk of having the shares assigned is ever-present, it can be managed effectively by choosing options with lower Delta for the short calls and taking advantage of the pricing and volatility attributes in the long puts.
Calendar Spread Option Strategy #2
To provide a comprehensive analysis of the most profitable calendar spread options strategy for 60 Degrees Pharmaceuticals, Inc. (SXTP), let's examine the available strategies focusing on selling a put option and buying a call option at different expiration dates. Our goal is to optimize the Greek values, minimize assignment risk, and leverage potential profit scenarios.
Basics of the Calendar Spread Strategy:
- Selling a Put Option: By selling a put option, you're potentially obligated to buy shares of SXTP at the strike price if the option is exercised before the expiration date. The premium received from selling the put reduces the initial cost.
- Buying a Call Option: Buying a call option gives you the right, but not the obligation, to purchase shares of SXTP at the strike price on or before the expiration date. The cost of buying the call is offset by the premium received from selling the put.
The Greeks play a pivotal role in assessing options strategies: - Delta (): Measures the sensitivity of the option's price to changes in the underlying asset's price. - Gamma (): Represents the rate of change of Delta over time. - Theta (): Quantifies the time decay of the option's price. - Vega (V): Measures the sensitivity to volatility. - Rho (): Represents the sensitivity to interest rate changes.
Calendar Spread Choices Based on Expiration Date and Strike Price:
- Short-Term Strategy (Selling a Put and Buying a Call Near-Term):
- Sell a Put Option: Expiration in 1 month, Strike Price: Slightly below the current stock price. This minimizes risk of assignment as the target price is just around the current market.
- Delta: Middling negative value (reducing risk of deep in-the-money).
- Theta: Higher (less time value decay benefit).
- Buy a Call Option: Expiration in 3 months, Strike Price: At or slightly above the current stock price.
- Delta: Positive, around 0.5 indicating a good leverage for upward movement.
- Theta: Moderate positive (maintains time value).
Risk/Reward: - Risk: Limited, due to near-the-money positions and time value benefits. - Reward: Moderate, given that significant price movements will benefit from time decay and delta positioning.
- Medium-Term Strategy:
- Sell a Put Option: Expiration in 3 months, Strike Price: At the current stock price.
- Delta: Middling negative.
- Theta: Higher.
- Buy a Call Option: Expiration in 6 months, Strike Price: 2% above current stock price.
- Delta: Lower initial value but higher gamma for potentially rapid Delta changes.
- Theta: Low, maintaining value through the longer period.
Risk/Reward: - Risk: Moderately higher due to longer exposure. - Reward: Potentially higher with positive gamma aiding upward price movement.
- Long-Term Strategy (Expanding Time Horizons):
- Sell a Put Option: Expiration in 6 months, Strike Price: Slightly above current stock price.
- Delta: Lower negative value.
- Theta: Minimal decay within short term.
- Buy a Call Option: Expiration in 12 months, Strike Price: 4% below targeted price range.
- Delta: Positive at inception but variable with gamma influence.
- Theta: Minimal decay due to extensive duration.
Risk/Reward: - Risk: The longest exposure time means higher uncertainty. - Reward: Greatest potential if the stock price moves significantly upwards and benefits from Vega expansion due to long volatility exposure.
- Bi-Monthly Strategy:
- Sell a Put Option: Expiration in 2 months, Strike Price: Slightly below current price.
- Delta: Negative, moderate.
- Theta: Lower.
- Buy a Call Option: Expiration within 4 months, Strike Price: At current price.
- Delta: Positive but balanced against lower Theta decay.
Risk/Reward: - Risk: Limited due to shorter time frames. - Reward: Moderate gains on closer expiration dates aligned to price movement.
- Alternating Month Strategy:
- Sell a Put Option: Expiration in 3 months, Strike Price: At the money.
- Delta: Low negative value.
- Theta: Balanced.
- Buy a Call Option: Expiration in 5 months, Strike Price: Slightly above targeted price.
- Delta: Positive.
- Theta: Balanced against longer timeframes and potential time decay.
Risk/Reward: - Risk: Balanced due to middle-range exposure. - Reward: Balanced, decent profitability upon positive price movement.
Conclusion:
The most profitable calendar spread strategy hinges on careful balancing of the Greeks, optimizing Vega and Theta benefits while minimizing Delta-related assignment risks. Short-to-medium term expirations offer moderate risk with balanced returns, whereas longer-term strategies hinge heavily on less certain stock price movements but promising greater profitability amidst lower time decay and volatility benefits. Each scenario provides a distinct risk/reward profile tailored to various investment horizons.
Similar Companies in None:
Pfizer Inc. (PFE), Johnson & Johnson (JNJ), Merck & Co., Inc. (MRK), Gilead Sciences, Inc. (GILD), Bristol-Myers Squibb Company (BMY), Moderna, Inc. (MRNA), Eli Lilly and Company (LLY), AstraZeneca PLC (AZN), Regeneron Pharmaceuticals, Inc. (REGN), Amgen Inc. (AMGN)
https://finance.yahoo.com/news/60-degrees-pharmaceuticals-receives-fda-115900955.html
https://finance.yahoo.com/news/60-degrees-pharmaceuticals-outlines-upcoming-115900001.html
https://finance.yahoo.com/news/60-degrees-pharmaceuticals-announces-first-174500720.html
https://finance.yahoo.com/news/60-degrees-pharmaceuticals-funds-babesia-115900259.html
Copyright © 2024 Tiny Computers (email@tinycomputers.io)
Report ID: n4qdfu
Cost: $0.29171
https://reports.tinycomputers.io/SXTP/SXTP-2024-05-24.html Home