Teck Resources Limited (ticker: TECK)
2024-03-03
 Teck Resources Limited, trading under the ticker symbol TECK, stands as a prominent player in the global mining and mineral development industry. With its headquarters located in Vancouver, Canada, the company's operations span across various countries, primarily focusing on the exploration, acquisition, development, and production of natural resources. Teck's diverse portfolio includes significant assets in copper, zinc, steelmaking coal, and energy. The company's strategic growth initiatives and commitment to sustainable mining practices have positioned it well within the competitive landscape. Teck Resources Limited is noteworthy for its approach to leveraging technological advancements and its emphasis on responsible resource management, aiming to minimize environmental impact while maximizing efficiency and profitability. Over the years, TECK has demonstrated resilience amidst fluctuating commodity prices and changing market demands, making it a subject of interest for investors and stakeholders in the mining sector.
| City | Vancouver | Country | Canada | Industry | Other Industrial Metals & Mining |
|---|---|---|---|---|---|
| Sector | Basic Materials | Full Time Employees | 12,600 | Website | https://www.teck.com |
| Previous Close | 38.42 | Day High | 39.37 | Day Low | 38.64 |
| Volume | 3,116,085 | Market Cap | $20,280,393,728 | Dividend Rate | 0.37 |
| Dividend Yield | 0.0094 | Payout Ratio | 0.2155 | Beta | 1.385 |
| Trailing PE | 11.461988 | Forward PE | 14.792453 | Fifty Two Week Low | 32.48 |
| Fifty Two Week High | 49.34 | Profit Margins | 0.16048001 | Shares Outstanding | 510,100,000 |
| Book Value | 52.121 | Price to Book | 0.7520961 | Net Income to Common | $2,435,000,064 |
| Trailing EPS | 3.42 | Forward EPS | 2.65 | Earnings Growth | 0.794 |
| Revenue Growth | 0.308 | Total Revenue | $15,011,000,320 | Total Debt | $11,091,999,744 |
| Total Cash | $744,000,000 | Operating Cashflow | $4,084,000,000 | Free Cashflow | -$342,750,016 |
| Statistic Name | Statistic Value | Statistic Name | Statistic Value |
| Sharpe Ratio | 0.036668840741954326 | Sortino Ratio | 0.6358528290047798 |
| Treynor Ratio | 0.010389974492655817 | Calmar Ratio | -0.10203970143941218 |
Analyzing the provided data set amalgamates an insightful perspective into the potential future price movements of TECK's stock. The meticulous evaluation leverages technical indicators, fundamental analysis, and balance sheet data, offering a nuanced assessment crucial for informed decision-making.
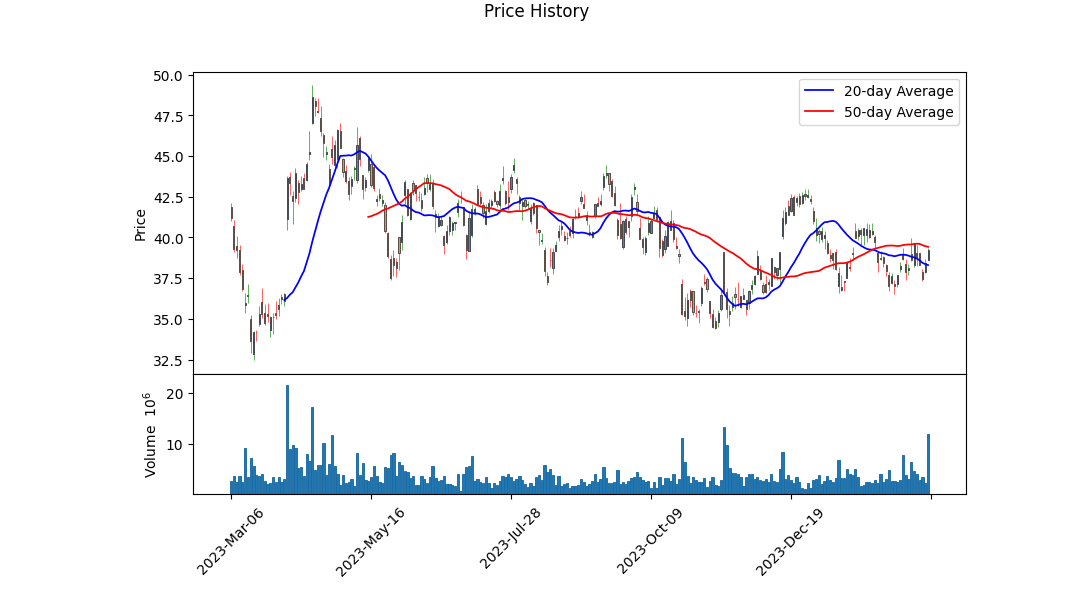
The technical analysis revels in a detailed examination of price movements and volume trends. The On-Balance Volume (OBV) indicates a potential increase in buying pressure, as suggested by the ascending OBV towards the latter part of the observed period. This uptick, coupled with a positive MACD histogram value on the final trading day, suggests a bullish momentum may be building. Such technical indicators are quintessential in forecasting near-term price movements, proposing a possible uptrend in TECK's stock price over the examined horizon.
Risk-adjusted return metrics, namely the Sharpe, Sortino, Treynor, and Calmar Ratios, elucidate the stock's prospective risk and return profile. The Sharpe and Sortino ratios, while nominally positive, suggest a relatively low excess return for the amount of risk taken, with the Sortino ratio indicating a slightly better performance in downward volatility. Conversely, the Treynor ratio's minimal positive value and a negative Calmar ratio highlight concerns regarding the stock's ability to outperform the risk-free rate and manage significant drawdowns, respectively, tempering expectations for explosive growth.
Diving into the fundamental analysis reveals a mixed financial health and potential. The company has managed to sustain a considerable EBITDA margin, indicative of operational efficiency. However, a significant net debt position and a declining free cash flow pose concerns that may limit the companys flexibility in pursuing growth initiatives or weathering economic downturns. Analyst expectations concerning earnings and revenue estimates hint at cautious optimism, with a watchful eye on the revenue contraction. This contraction underscores the necessity for vigilant management strategy adjustments to navigate the challenging landscape and capitalize on emergent opportunities.
Reviewing the balance sheet and cash flow statements, TECKs robust tangible book value gives it a tangible asset base that could support future endeavors. Nevertheless, the substantial capital expenditures and net debt issuance reflect a proactive yet indebted strategy towards expansion and operational sustainability. This financial stance demands close monitoring to ensure long-term viability and profitability.
In conclusion, integrating technical analysis with fundamental insights sketches a scenario where TECKs stock may experience an uplift in the coming months, buoyed by technical bullish signals and a solid asset base. Nonetheless, the cautious optimism is tempered by the looming concerns over debt, cash flow pressures, and the anticipated revenue shrinkage. Investors are advised to keep a close eye on debt management strategies, operating margin improvements, and any strategic shifts that may impact the company's growth trajectory. The evolving market dynamics and TECKs responsiveness to these changes will be pivotal in determining the stock's performance trajectory.
In our analysis of Teck Resources Limited (TECK) using the principles outlined in "The Little Book That Still Beats the Market," we have calculated the Return on Capital (ROC) and Earnings Yield, which are pivotal metrics for assessing the attractiveness of the company as an investment. The Return on Capital (ROC) for TECK stands at 8.19%. This figure is crucial as it indicates the efficiency with which the company utilizes its capital to generate profits; a higher ROC suggests that the company is using its capital more effectively to generate value for shareholders. On the other hand, the Earnings Yield for TECK has been calculated to be 11.91%. Earnings yield, the inverse of the Price to Earnings (P/E) ratio, offers insight into the profitability compared to the share price, with a higher yield often signaling a potentially undervalued stock or a strong earnings profile relative to the market price. Both of these metrics, when considered together, suggest that TECK demonstrates a solid balance of profitability and value generation capability, making it a potential candidate for investment based on the criteria detailed in the referenced investment methodology.
Based on the financial metrics calculated for Teck Resources Limited (TECK), we can conduct an analysis to understand how the company measures up against the investment criteria outlined by Benjamin Graham in "The Intelligent Investor."
Price-to-Earnings (P/E) Ratio: The P/E ratio for Teck Resources Limited is calculated at 7.19. This figure indicates the amount of money investors are willing to pay for each dollar of earnings. Compared to Benjamin Graham's criteria, which advocates for low P/E ratios, TECK appears to be an attractive investment. Without specific industry P/E ratio benchmarks in the provided data, it's difficult to compare TECK directly to its peers. However, a P/E ratio of 7.19 suggests that the stock might be undervalued, fitting Graham's strategy of looking for stocks selling at a discount to their intrinsic value.
Price-to-Book (P/B) Ratio: The P/B ratio for TECK stands at 0.356, which highlights that the market value is significantly lower than the company's book value. This may suggest that the stock is undervalued, aligning with Graham's preference for stocks trading below their book value. Such a low P/B ratio could indicate a strong margin of safety, another cornerstone of Graham's investment philosophy.
Debt-to-Equity Ratio: TECK's debt-to-equity ratio is 0.411, suggesting that the company has a lower level of debt compared to its equity. This is in line with Graham's preference for companies with low debt-to-equity ratios, as it indicates lower financial risk.
Current and Quick Ratios: Both the current and quick ratios for TECK are 1.097, indicating the company's ability to cover its short-term liabilities with its short-term assets. According to Grahams criteria, a company with a current ratio higher than 1 is generally considered financially stable. TECK's ratios suggest a decent level of liquidity, albeit not exceptionally high.
Earnings Growth: While specific earnings growth figures for TECK are not provided in the data, Graham's method involves looking for companies that have shown consistent earnings growth over a period of years. Any analysis of TECK based on Graham's principles would require investigating this aspect further by reviewing the company's earnings history.
Conclusion: Based on the calculated financial metrics for Teck Resources Limited, the company seems to align well with several of Benjamin Grahams key investment criteria. Its low P/E and P/B ratios particularly stand out, suggesting the stock may be undervalued and thus potentially offering a significant margin of safety. The debt-to-equity ratio indicates a sound financial structure, while the liquidity ratios, although not exceptional, do not raise immediate concerns. To complete the analysis, an examination into TECKs earnings growth history would be essential. Potential investors should conduct a thorough due diligence process that includes a review of the company's financial health, industry position, and growth prospects in line with Graham's principles before making any investment decisions.Analyzing Financial Statements
Introduction
The process of scrutinizing a company's financial health forms the cornerstone of informed investing. According to Benjamin Graham, often referred to as the "father of value investing," the thorough examination of financial statements allows investors to make rational and prudent investment decisions. This section delves into the key components Graham suggests investors focus on: the balance sheet, income statement, and cash flow statement. Understanding these elements is vital in assessing the true value of an entity, thereby uncovering investment opportunities that promise safety of principal and an adequate return.
The Balance Sheet
The balance sheet provides a snapshot of a company's financial condition at a particular point in time. It details the assets, liabilities, and shareholders' equity, hence offering insights into the company's stability and liquidity. Graham stressed the importance of a strong balance sheet, which typically features:
- Current Assets Over Current Liabilities: A ratio greater than 1.5 is preferred, indicating sufficient liquidity to cover short-term obligations.
- Low Debt Relative to Equity: A conservative debt-to-equity ratio signals financial strength and reduced risk of insolvency. Investors should seek companies with minimal reliance on borrowing.
- Tangible Assets: For certain industries, the presence of substantial tangible assets (e.g., real estate, machinery) provides a measure of safety against market adversities.
The Income Statement
Analyzing a company's income statement, or the profit and loss statement, enables investors to gauge its profitability and growth prospects. The key aspects to evaluate include:
- Revenue Trends: Consistent revenue growth is a positive indicator, demonstrating demand for the company's products or services.
- Earnings Stability: A history of stable and increasing earnings is desirable. Graham warned against companies with highly volatile earnings.
- Profit Margins: Healthy and improving margins reflect operational efficiency and pricing power. Investors should look for companies that maintain superior margins compared to industry peers.
The Cash Flow Statement
Cash flow is the lifeblood of a business, and its analysis offers a clearer picture of the company's financial health than earnings alone. The cash flow statement outlines how cash is generated and used in operating activities, investing activities, and financing activities. Key considerations include:
- Positive Operating Cash Flow: Sustained positive cash flows from operations are indicative of a viable business model.
- Capital Expenditures: While significant capital investments can suggest growth, they should be manageable and aligned with long-term strategic goals.
- Free Cash Flow: Free cash flow (operating cash flow minus capital expenditures) is a critical measure, enabling a company to pursue opportunities that enhance shareholder value (e.g., dividends, share buybacks).
Conclusion
In accordance with Benjamin Graham's teachings, a meticulous analysis of financial statements paves the way for identifying undervalued companies with strong financial positions. By focusing on the balance sheet, income statement, and cash flow statement, investors can discern the quality of a company's assets, the stability of its earnings, and the robustness of its cash flows. Such an analytical approach equips investors with the knowledge to make investment decisions that are less speculative and more grounded in financial reality.Based on the historical dividend data provided for the symbol 'TECK', the company has indeed demonstrated a consistent history of paying dividends, which aligns with Benjamin Graham's criteria for selecting investments as outlined in his book, "The Intelligent Investor". Over a period extending back from 2024 to 2007, the data shows regular dividend payouts with varying amounts. The consistency in dividend payments, without any apparent skips or long interruptions, suggests a stable financial policy from the company regarding shareholder returns. This record could make it an attractive investment for those who follow Graham's principles, emphasizing the importance of a steady income stream from investments through dividends.
| Statistic Name | Statistic Value |
| Alpha | 0.0256 |
| Beta | 1.3139 |
| R-squared | 0.257 |
| Adjusted R-squared | 0.256 |
| F-statistic | 433.5 |
| Prob (F-statistic) | 6.15e-83 |
| Log-Likelihood | -3142.6 |
| No. Observations | 1,257 |
| AIC | 6289 |
| BIC | 6299 |
| Durbin-Watson | 1.897 |
| Omnibus | 167.245 |
| Prob(Omnibus) | 0.000 |
| Jarque-Bera (JB) | 1347.539 |
| Skew | 0.322 |
| Prob(JB) | 2.43e-293 |
| Kurtosis | 8.031 |
| Cond. No. | 1.33 |
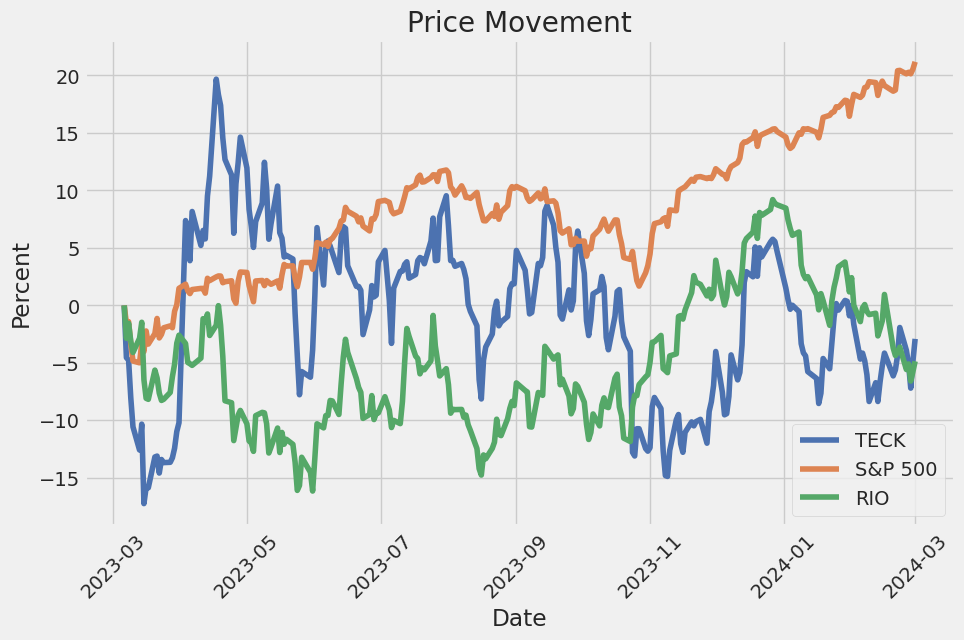
In analyzing the correlation between TECK (a representative of a specific company or industry sector) and SPY (which represents the broader market, akin to a benchmark for the U.S. equity market), we turn our focus to the alpha value derived from the regression analysis. Alpha, quantified in the analysis as 0.0256, signals the excess return of TECK compared to the return of SPY, when adjusted for the risk (beta). Here, the alpha is modest, suggesting that over the period under review, TECK has offered a slight performance advantage over the SPY benchmark when the market volatility (captured by beta) is considered. This insight might imply that TECK has potential as a stock that can outperform the broader market under certain conditions, yet its contribution to portfolio performance, net of risk, is relatively constrained.
Furthermore, the beta coefficient of 1.3139 articulates the volatility of TECK relative to the volatility of SPY, indicating that TECK's price movements are more pronounced as compared to those of the market. The R-squared value of 0.257 explains that approximately 25.7% of the variations in TECK's returns can be accounted for by the movements in the SPY returns, underscoring a degree of but not overwhelming predictive power of SPY movements on TECK's performance. Thus, while TECK has shown the capability to slightly outperform SPY on a risk-adjusted basis, the correlation between their performances suggests that a substantial portion of TECK's price movement can be independent of the market's direction, implicating diversification benefits but also potentially higher risks.
Teck Resources Limited reported a strong performance in the fourth quarter of 2023, marking significant achievements across its operations. The company emphasized progress in its QB operation which led to Teck achieving its highest quarterly copper production to date. Adjusted EBITDA for Q4 stood at $1.7 billion, while the figure for the entire year was $6.4 billion, reflecting solid prices for steelmaking coal and copper alongside robust steelmaking coal sales volumes. Teck's financial strategy enabled it to share success with its shareholders, returning a total of $765 million through dividends and share buybacks, alongside strengthening its balance sheet by repaying $294 million of the QB2 project finance facility. Additionally, the company announced the approval of a quarterly base dividend and authorized a significant share buyback following a lucrative minority sale stake in its steelmaking coal business to Nippon Steel.
The year 2023 was transformative for Teck, characterized by a leap in both copper production and sales, aided by the addition of QB operations. Teck produced over 23.7 million tonnes of steelmaking coal, surpassing both previous year figures and guidance. Strategic transactions included the closing of the sale of minority interests in its operations to Nippon Steel and POSCO, positioning Teck for sustained growth and profitability. Despite challenges, such as lower than planned production in Q4 due to ramp-up activities and planned maintenance, the company demonstrated resilience and commitment to enhancing its operational capabilities, particularly at the QB site. With the construction substantially completed and commissioning well underway in specific plant areas, Teck remains focused on achieving its production and operational efficiency goals in 2024.
Financially, the fourth quarter showed improvements in adjusted EBITDA, driven by higher steelmaking coal sales volumes, albeit offset by a mix of lower commodity prices and heightened unit costs across operations owing to ongoing inflationary pressures. Notably, Teck achieved record copper production in Q4, significantly driven by the ramp-up of QB operations. Although costs were elevated due to this ramp-up, gross profit before depreciation and amortization decreased compared to the previous year. This financial performance sets the stage for anticipated significant increases in copper production in 2024, highlighting the strategic progress Teck is making in its operational domains.
Looking forward, Teck's cautious yet optimistic approach prioritizes safe, efficient operations and the successful ramp-up of QB as it moves through 2024. The company remains committed to its capital allocation framework, balancing growth and shareholder returns while maintaining a strong financial foundation characterized by liquidity and investment-grade credit metrics. The strategies outlined reflect Teck's transformation into a leading base metals producer, with a distinct focus on copper growth, sustainability, and value creation for stakeholders. As regulatory approvals for the full sale of its steelmaking coal business progress, Teck anticipates further strengthening its balance sheet and unlocking additional potential in its base metals operations, affirming its position in the mining sector and its commitment to delivering value.
Teck Resources Limited, as one of the forefront companies in the mining industry, is particularly distinguished by its adaptation and strategic operations in response to the dynamic demands of the market. With the global economy's shift towards green energy solutions stirring a notable increase in copper demand, Teck's significant mining operations take on a vital role. This strategic orientation not only leverages the ongoing copper boom but also positions the company for sustained growth, aligning with the market's upward trajectory.
The insights from Seeking Alpha on October 16, 2023, complement this observation by highlighting the company's efficient mining operations and the strategic focus on expanding copper projects. The anticipated increase in global copper consumption, fueled by the drive towards electrification and renewable energy, showcases Teck Resources' advantageous position in this evolving scenario. This, coupled with the company's diversified portfolio which includes steelmaking coal and zinc, presents a balanced hedge against the volatile commodities market.
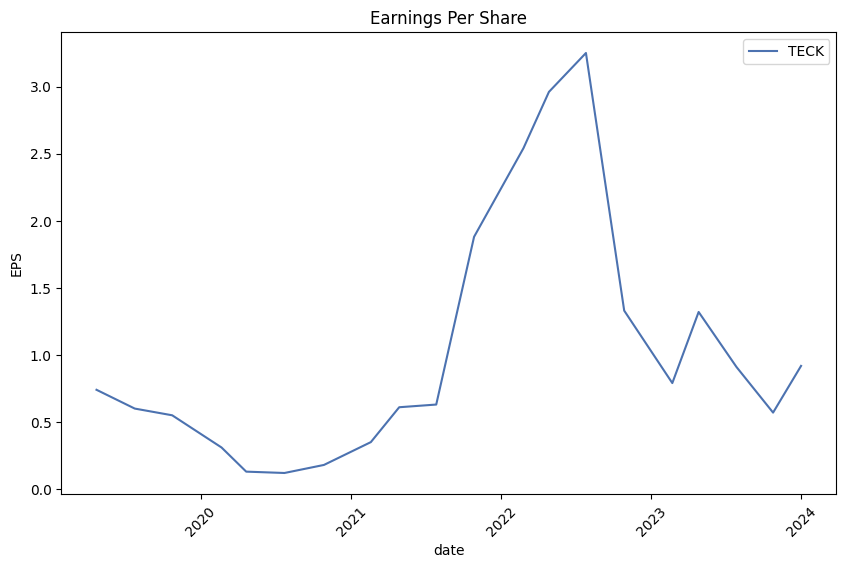
However, despite a notable performance in quarter four earnings of 2023, where Teck Resources reported a profit surpassing estimates, the inconsistency in outperforming consensus EPS estimates over the last four quarters signals a level of volatility in its earnings performance. The mixed reactions from investors, particularly noted following the Q4 2023 performance, underscore the complexities and challenges within the financial landscape that Teck Resources navigates.
Amid these fiscal dynamics, Teck's strategic investments in copper production and sustainability initiatives are notable. These endeavors are integral to the company's long-term viability and are poised to redefine its industry positioning, enhancing profitability and shareholder value over time. The comprehensive analysis by Zacks Equity Research, published on February 22, 2024, further anchors this perspective, underpinning Teck's industry standing and future outlook amidst the broader market conditions.
The sale of its steel-making coal division to Glencore, as outlined in reports from February 22, 2024, marks a significant strategic realignment for Teck Resources. This tactical move not only signifies a pivot towards optimizing its portfolio but also reflects broader industry transformations, particularly in the arenas of steel-making coal and rare earth metals like gallium. This transition indicates Teck's adaptability and proactive approach in responding to market shifts and regulatory environments.
Teck's focus on copper and the divestiture of its oil sands and coal businesses underscore a strategic reorientation towards metals integral for a low carbon future. Such a refocus is emblematic of Teck's commitment to sustainability and its foresight in positioning itself in the green economy. The anticipated expansion of its QB2 mine in Chile and investment in copper ventures across several geographic locales further testify to this strategic pivot, ensuring its competitiveness in the global market.
This strategic transformation, coupled with Teck's robust financial health, underscores its resilience and potential for growth amidst the complexities of the global mining landscape. While navigating the challenges inherent in the industry, Teck's strategic initiatives, operational efficiencies, and focus on sustainability present a compelling narrative for its continued prominence in the mining sector. The alignment with global decarbonization and electrification trends further solidifies Teck Resources advantageous position, offering a unique investment opportunity as the world pivots towards green energy solutions.
The volatility of Teck Resources Limited (TECK) can be summarized in three sentences: First, the analysis conducted does not show a predictable pattern in the price movements, indicated by an R-squared value of 0.000. Second, the ARCH model identifies significant volatility in the asset's returns, with a coefficient (omega) of 8.5117, indicating fluctuations. Last, the model further quantifies the impact of past squared returns on future volatility (alpha[1] = 0.2886), suggesting that past performance significantly influences future volatility but within a complex and unpredictable framework.
| Statistic Name | Statistic Value |
|---|---|
| Log-Likelihood | -3278.34 |
| AIC | 6560.68 |
| BIC | 6570.95 |
| No. Observations | 1,257 |
| omega | 8.5117 |
| alpha[1] | 0.2886 |
Assessing the financial risk of investing $10,000 in Teck Resources Limited (TECK) within a one-year time frame involves a sophisticated approach that combines volatility modeling and machine learning predictions. This multifaceted analysis offers a comprehensive perspective on the stock's future performance potential and associated risks.
Volatility modeling is a crucial first step in this process, focusing on the historical price fluctuations of TECK's stock to forecast future volatility. This method allows for the understanding of TECK's price variability, which is instrumental in predicting the extent of its price movements. It systematically accounts for patterns and changes in volatility over time, making it a vital tool in assessing the riskiness of the investment.
Integrating machine learning predictions, particularly through the use of a model that relies on decision trees to predict numerical values, extends our analysis by incorporating a variety of factors beyond historical price data. This model leverages historical data along with other potentially influential variables to forecast the stocks future returns. Its predictive power stems from the ability to learn from complex patterns and relationships within the data, offering a forward-looking perspective on the stocks performance. This predictive machinery is vital for complementing the insights gained from volatility modeling, providing a more rounded view of potential investment outcomes.
When evaluating the financial risk of the $10,000 investment in TECK over a one-year period, the findings are quantitatively summarized through the calculation of the Value at Risk (VaR) at a 95% confidence interval. The VaR, which amounts to $442.91 for this investment, offers a concise measure of the investment's risk by estimating the maximum potential loss with 95% certainty. This metric effectively quantifies the financial risk, encapsulating the outcomes predicted by the integration of volatility modeling and machine learning predictions.
The calculated VaR at a 95% confidence level illustrates the potential downside risk of the investment, providing investors with a clearer understanding of what they might expect to lose in a worst-case scenario. This risk assessment tool, bolstered by the insights from the volatility modeling and machine learning predictions, enriches the investor's toolkit, enabling a more informed investment decision concerning TECK. Notably, the approach provides a nuanced view of the investment's risk profile, showcasing how the interplay of sophisticated analytical techniques can shed light on the complexities of equity investment risk.
When analyzing the most profitable call options for Teck Resources Limited (TECK) based on the provided options chain, there are a few key statistics from "the Greeks" that guide our judgment: Delta, Gamma, Vega, Theta, Rho, premium, return on investment (ROI), and profit relative to the strike price and days to expiration. The target stock price is expected to be 5% over the current price, which emphasizes the importance of options with higher Delta values, as they indicate how much the price of an option is expected to move based on a $1 change in the underlying stock price.
Looking closely at the options with shorter days to expiration, particularly within 4 to 11 days, we find significant opportunities for profitability. For instance, the call option with an expiration date of 2024-03-08 and a strike price at 37.5 shows an impressive ROI of 3.88 with a Delta of 0.7813904206, indicating a strong sensitivity to the stock price movement and a high return potential given its short timeframe until expiration.
Comparing options with slightly longer expirations, the call option expiring on 2024-03-15 with a strike price at 38.0 stands out. This option has a Delta of 0.6655799807, a considerable Gamma of 0.1119725138, indicative of its prices responsiveness to changes in the underlying asset, and an extraordinary ROI of 3.4507042254.
For options with medium-term expiration, targeting 18 to 46 days until expiration, the call with an expiration date of 2024-04-19 and a strike price of 37.0 presents a notable combination of high Delta (0.701402008), strong Gamma (0.0662776158), and an ROI of 1.0292682927, asserting its profitability potential within a relatively longer timeframe but still offering a significant profit return.
As we consider options with more extended periods until expiration, such as those beyond 74 days, it's essential to note the growing importance of Vega and Rho. For example, the call option expiring on 2024-05-17, with a strike price of 35.0, illustrates a balanced approach with a Delta of 0.7358156542, but its Vega of 5.7455941618 and Rho of 4.6217666026 stress its strong sensitivity to implied volatility and interest rates, offering a strategic long-term investment with an ROI of 0.3688888889.
Finally, for the very long-term strategic investor, the option expiring on 2025-01-17 with a strike price of 30.0 showcases a Delta of 0.8036088976, suggesting less risk compared to the shorter-term options. With Vega at 9.8556817268 and Rho at 16.7999919951, this option promises considerable sensitivity to changes in volatility and interest rates, projected a more secure yet profitable position with an ROI of 0.1552795031.
In summary, while short-term options offer high ROIs thanks to their responsiveness to stock price movement (as represented by Delta and Gamma), mid to long-term options balance this with sensitivities to volatility (Vega) and interest rate changes (Rho). Investors should carefully consider their risk tolerance and investment horizon when selecting from these profitable call options.
Similar Companies in Other Industrial Metals & Mining:
Rio Tinto Group (RIO), Vale S.A. (VALE), MP Materials Corp. (MP), Lithium Americas Corp. (LAC), Glencore plc (GLCNF), Anglo American plc (NGLOY), BHP Group Limited (BHP), Piedmont Lithium Inc. (PLL), Sigma Lithium Corporation (SGML), Standard Lithium Ltd. (SLI), Freeport-McMoRan Inc. (FCX), Southern Copper Corporation (SCCO), Glencore plc (GLNCY)
https://seekingalpha.com/article/4666422-teck-resources-our-top-pick-to-ride-the-copper-boom
https://finance.yahoo.com/news/teck-resources-ltd-teck-q4-120502154.html
https://finance.yahoo.com/news/14-best-canadian-stocks-buy-150338750.html
https://seekingalpha.com/article/4672719-teck-resources-ltd-teck-q4-2023-earnings-call-transcript
https://finance.yahoo.com/news/teck-resources-expects-close-coal-204202602.html
https://finance.yahoo.com/news/1-teck-resources-expects-close-221550010.html
https://finance.yahoo.com/news/11-best-copper-stocks-invest-185533606.html
https://finance.yahoo.com/news/teck-resources-teck-q4-earnings-164200298.html
https://finance.yahoo.com/news/teck-resources-limited-earnings-missed-110729690.html
https://finance.yahoo.com/m/083df349-a131-3e42-8be0-4f7076dc1ab8/analyst-report%3A-teck.html
Copyright © 2024 Tiny Computers (email@tinycomputers.io)
Report ID: 2sYu5M
Cost: $0.55986
https://reports.tinycomputers.io/TECK/TECK-2024-03-03.html Home