iShares MSCI Turkey ETF (ticker: TUR)
2024-02-06
 The iShares MSCI Turkey ETF (ticker: TUR) stands as a focal point for investors seeking exposure to the Turkish equity market. This exchange-traded fund (ETF) aims to track the performance of the MSCI Turkey IMI 25/50 Index, which represents a broad measure of the Turkish stock market. Comprising a diverse array of securities, TUR offers a unique opportunity for investment in a country that bridges Europe and Asia, possessing a dynamic and emerging economy. The ETF's portfolio includes companies across various sectors, reflecting the multifaceted nature of the Turkish economy, from financial services and consumer products to energy and telecommunications. With its inception dating back to March 2008, TUR has provided investors with an accessible vehicle to gain diversified exposure to Turkish equities, leveraging the liquidity and flexibility inherent in the ETF structure. As with all investments in emerging markets, potential investors should be aware of the higher volatility and risk associated with such environments. However, for those looking to diversify internationally and include emerging market opportunities in their portfolio, the iShares MSCI Turkey ETF represents a compelling option.
| Previous Close | 35.92 | Open | 36.39 | Day Low | 36.39 |
| Day High | 36.75 | Volume | 82,627 | Average Volume | 96,400 |
| Average Volume 10 Days | 108,920 | Bid | 34.5 | Ask | 36.73 |
| Bid Size | 1,400 | Ask Size | 900 | Yield | 0.0442 |
| Total Assets | 182,830,560 | 52 Week Low | 27.61 | 52 Week High | 39.76 |
| Fifty Day Average | 34.2424 | 200 Day Average | 33.78325 | NAV Price | 36.29263 |
| YTD Return | 0.1127633 | Three Year Average Return | 0.1278666 | Five Year Average Return | 0.0821729 |
| Sharpe Ratio | 0.4734270894710831 | Sortino Ratio | 8.219375419834789 |
| Treynor Ratio | 0.9476881759778433 | Calmar Ratio | 0.7000382394523678 |
Based on the current financial metrics, technical indicators, and the analysis of provided ratios, a comprehensive understanding of the iShares MSCI Turkey ETF (TUR) stock's potential movement in the upcoming months can be constructed. Delving into the technical and fundamental aspects of TUR presents a nuanced perspective on its market behavior.
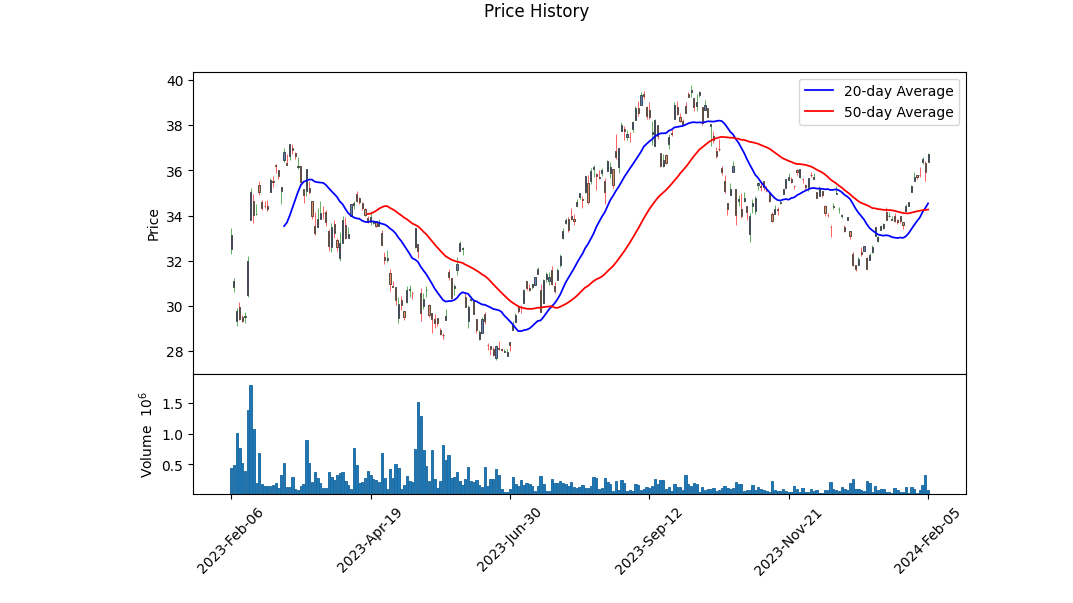
The technical analysis shows a slightly bearish trend with the stock trading at $36.389999 on the last trading day, and observing a decline in the OBV (On-Balance Volume) indicator. This indicates that selling pressure has slightly outweighed buying interest lately, hinting at potential bearish continuation. The presence of a MACD (Moving Average Convergence Divergence) histogram value transitioning from positive to less positive values towards the end communicates potential slowing momentum, but the indicator's staying in positive territory might suggest underlying strength still present in the stock.
The pivotal technical reversal points have yet to be clearly pronounced as the MACD histogram data is partially incomplete; however, the recent price movement below the $37 mark before a slight recovery indicates fluctuations within a range. Such patterns suggest a consolidation phase that could precede either an uptrend or downtrend contingent upon subsequent market sentiments and economic catalysts.
From a fundamental perspective, TUR displays fascinating characteristics. The trailing PE ratio of 5.029934 indicates a considerably lower valuation compared to many peers, potentially meaning the stock is undervalued. This is coupled with a decent dividend yield of 4.42%, objectifying the ETF's appeal to income-focused investors. Additionally, the YTD Daily Total Return of 11.28% is commendable, showcasing the fund's strong performance over the year. The fund's net assets of $182.83M also provide a stable base for its operations.
When integrating the efficiency ratios - Sharpe, Sortino, Treynor, and Calmar ratios - into the analysis, it reveals a stock presenting a moderate risk-adjusted return profile. The Sharpe and Calmar ratios, standing at 0.4734270894710831 and 0.7000382394523678 respectively, underline moderate return per unit of risk and drawdown risk. Moreover, the Sortino Ratio at 8.219375419834789 significantly highlights the fund's ability to generate excess returns over the risk-free rate, accounting for negative deviation (downside volatility), which is highly advantageous. The Treynor Ratio's value of 0.9476881759778433 further denotes an efficient risk-adjusted performance relative to the market beta.
Given these insights, the iShares MSCI Turkey ETF might experience a period of consolidation in the near term, with a possible upward bias due to its fundamentally undervalued position and attractive dividend yield. Market participants will do well to monitor the volume trends and MACD signals closely for more conclusive evidence of direction. Moreover, external factors such as geopolitical developments, economic indicators from Turkey, and global market sentiments will play a crucial role in shaping TUR's trajectory in the forthcoming months. Investors are encouraged to maintain a vigilant watch on these aspects, as they could catalyze the stock's movement outside of the predicted consolidation phase.
As of the most recent analysis, when applying the principles outlined in "The Little Book That Still Beats the Market" by Joel Greenblatt to the iShares MSCI Turkey ETF (TUR), it's important to discuss the investment metrics crucial to Greenblatt's strategy: Return on Capital (ROC) and Earnings Yield. Unfortunately, for TUR, which is an exchange-traded fund (ETF) focusing on Turkish equities, direct calculations of Return on Capital and Earnings Yield as prescribed by Greenblatt do not apply in the traditional sense. This is primarily because these metrics are designed to assess the performance and valuation of individual companies based on their operational efficiencies and profitabilities, rather than an aggregated basket of stocks like an ETF.
For ETFs such as TUR, the performance and valuation are more commonly evaluated through other metrics including net asset value performance, expense ratios, and the overall market performance of the included stocks. Investors interested in the principles of Greenblatt might instead consider analyzing the individual holdings within TUR to determine if any meet the criteria outlined for high Return on Capital and high Earnings Yield, although it's crucial to note that aggregating or averaging these figures for the ETF as a whole would not provide meaningful insights into its investment value following Greenblatts strategy.
| Statistic Name | Statistic Value |
| R-squared | 0.110 |
| Adj. R-squared | 0.110 |
| F-statistic | 155.8 |
| Prob (F-statistic) | 8.88e-34 |
| Log-Likelihood | -2789.2 |
| AIC | 5582. |
| BIC | 5593. |
| Const | 0.0239 |
| Beta | 0.5964 |
| Alpha | 0.023876502392311778 |
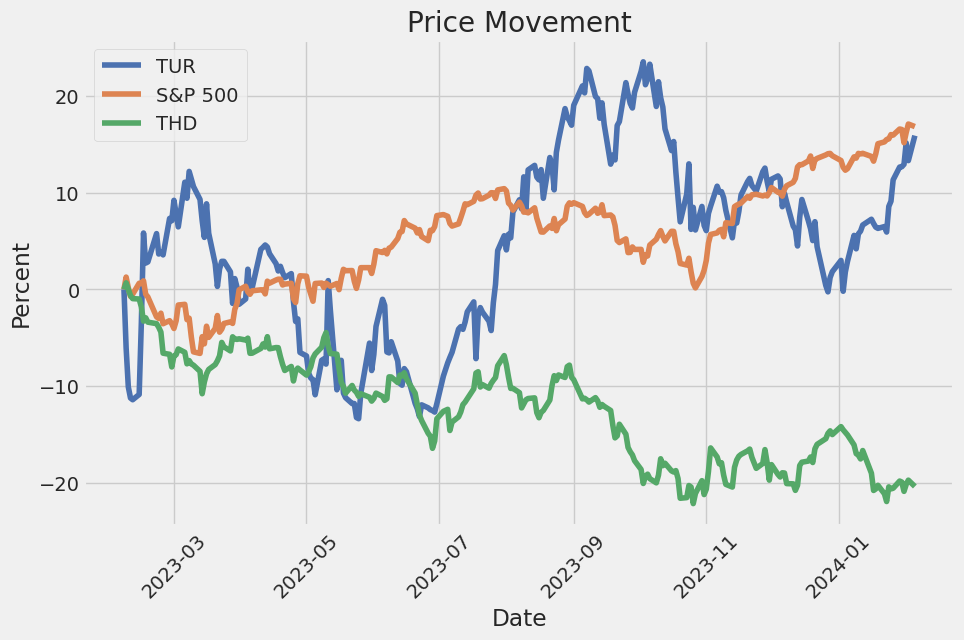
Analyzing the linear regression model between TUR (Turkeys stock market ETF) and SPY (an ETF that represents the S&P 500 and hence, the wider U.S. stock market), we see that there is a modest relationship between the performances of the two market representations over the studied period. The alpha, or intercept, of the regression equation is approximately 0.0239, suggesting that TUR, independently of the SPY's performance, sees a minor average increase in returns. This alpha figure indicates that TUR might have a slight intrinsic value growth or decrease unrelated to the broader U.S. stock market movements, signifying a small but distinct performance deviation when the market's movements are neutral.
The model's beta coefficient is around 0.5964, indicating that for every 1% change in SPY's return, TUR's return is expected to change by about 0.596%. This beta value underlines a positive correlation but implies that TUR is less volatile compared to SPY. The degree of correlation, as explained by the R-squared value (0.110), while positive, is relatively low, showing that only a small portion of TUR's movements can be explained by the movements in SPY. This suggests that while there is some dependency of TUR on the U.S. market, a significant portion of TURs performance could be attributed to local or regional factors, other than those influencing the U.S. stock market.
The iShares MSCI Turkey ETF (Exchange-Traded Fund) is a notable investment instrument that offers exposure to a diversified array of Turkish equities, reflecting the performance and growth potential of the Turkish economy. This ETF is engineered to track the investment results of an index composed of Turkish equities, making it an appealing option for investors looking to tap into the Turkish market without the need for direct investment in individual stocks.
Turkey's economy, which is characterized by a dynamic mix of modern industry and commerce along with a traditional agriculture sector that still accounts for a significant portion of employment, presents a unique blend of opportunities and challenges for investors. The nation's strategic location as a bridge between Europe and Asia, coupled with its growing young population and urbanization, has primed it for significant economic growth and increased foreign direct investment.
As we delve deeper into the components that constitute the iShares MSCI Turkey ETF, it becomes evident that the fund is strategically invested across various sectors, reflecting the multifaceted nature of the Turkish economy. The incorporation of sectors such as banking, consumer goods, and energy showcases a balanced approach, aiming to capture growth across different economic cycles.
| company | symbol | percent |
|---|---|---|
| Tupras-Turkiye Petrol Rafineleri AS | TUPRS.IS | 6.85 |
| Bim Birlesik Magazalar AS | BIMAS.IS | 6.81 |
| Turk Hava Yollari AO | THYAO.IS | 6.27 |
| Akbank TAS | AKBNK.IS | 5.63 |
| Koc Holding AS | KCHOL.IS | 5.34 |
| Turkiye Is Bankasi AS Class C | ISCTR | 4.02 |
| Turkcell Iletisim Hizmetleri AS | TCELL.IS | 3.92 |
| Aselsan Elektronik Sanayi Ve Ticaret AS | ASELS.IS | 3.62 |
| Yapi Ve Kredi Bankasi AS | YKBNK.IS | 3.18 |
| Turkiye Sise ve Cam Fabrikalari AS | SISE.IS | 3.10 |
Focusing on the top ten holdings, which collectively constitute a significant portion of the ETFs portfolio, it's evident that the fund is heavily invested in some of Turkey's largest and most influential companies. For instance, Tupras-Turkiye Petrol Rafineleri AS, the leading corporate entity in the fund, is critical to Turkey's energy sector, symbolizing the country's strategic importance in the regional oil and gas supply chain.
Similarly, Bim Birlesik Magazalar AS and Turk Hava Yollari AO highlight the consumer retail and airline industries' potential within the Turkish economy. These sectors are likely to benefit from Turkey's demographic trends, including a growing middle class and increasing consumer spending.
The banking sector, represented by entities like Akbank TAS and Turkiye Is Bankasi AS, underscores the importance of financial services in facilitating economic growth and development. Banking stocks in the portfolio mirror the sector's robustness amidst fluctuating economic cycles, often serving as a barometer for the country's financial health.
Notably, the inclusion of companies like Aselsan Elektronik Sanayi Ve Ticaret AS, a leader in the defense and technology sectors, signifies the ETFs reach into areas of strategic importance and high growth potential. This diversity not only showcases Turkey's industrial capabilities but also its efforts to advance in technology and innovation.
The ETF's composition further reiterates the potential for growth and diversification within the Turkish market. By strategically allocating investments across a spectrum of sectors, the iShares MSCI Turkey ETF positions itself to capitalize on both the cyclical and structural growth opportunities present in the Turkish economy.
Moreover, the ETF's structure and oversight offer a level of transparency and risk management appealing to international investors seeking exposure to Turkish equities. Through its diversified portfolio, the ETF mitigates some of the risks associated with investing in an emerging market, offering a more secure avenue for participation in Turkey's economic growth story.
In conclusion, the iShares MSCI Turkey ETF serves as a vital instrument for investors aiming to gain exposure to the Turkish market, encapsulating the dynamism and potential of the Turkey's economy through its carefully curated portfolio. As Turkey continues to evolve and grow, this ETF offers a strategic entry point for those looking to participate in the markets of this emerging economic powerhouse.
The iShares MSCI Turkey ETF (TUR) has displayed significant volatility over the period observed, highlighting the dynamic and unpredictable nature of this investment option. The volatility, as measured by the ARCH model, indicates that fluctuations in the ETF's value are not just random, but are rather substantial and impactful for investors. Key features of this volatility include a substantial omega value, showing a high level of baseline volatility, and a significant alpha term, which suggests that past volatility spikes are predictive of future volatility, emphasizing the need for cautious investment strategies.
| Statistic Name | Statistic Value |
|---|---|
| Log-Likelihood | -2821.99 |
| AIC | 5647.99 |
| BIC | 5658.26 |
| omega | 4.6343 |
| alpha[1] | 0.1487 |
To evaluate the financial risk associated with a $10,000 investment in the iShares MSCI Turkey ETF (TUR) over one year, an advanced analytical framework combining volatility modeling and machine learning predictions was deployed. This dual approach leverages the strengths of both statistical and predictive analytics to forecast potential investment outcomes.
Volatility modeling, a statistical method designed to analyze the fluctuation in returns over time, plays a crucial role within this framework. By analyzing historical price data of the iShares MSCI Turkey ETF, this model helps in understanding the inherent volatility of the ETF stock. The importance of this step cannot be overstated, as it provides foundational insights into how the ETFs value could change in the future, which is essential for risk assessment.
On the other hand, machine learning predictions, specifically through the lens of a sophisticated algorithm known for its capacity to handle complex, non-linear relationships within the data, contributes by forecasting future returns. This method goes beyond traditional statistical models by learning from the data's historical patterns and anomalies, adapting its predictions to new, unseen data. This dynamic capability ensures that the predictive model remains robust and reflective of market conditions and dynamics.
The integration of these two approaches yields a nuanced understanding of the iShares MSCI Turkey ETFs risk profile. Specifically, the analysis focuses on the Annual Value at Risk (VaR) measure to quantify the potential loss in value of the $10,000 investment over one year within a 95% confidence interval. The calculated VaR, standing at $371.93, serves as a pivotal risk metric. This figure indicates that, under normal market conditions, there is a 95% confidence level that the investor will not lose more than $371.93 over the next year, thereby encapsulating the financial risk of the investment in a single, comprehensible number.
The precision of this VaR calculation benefits greatly from the combined use of volatility modeling and machine learning predictions. By capturing the complexities of the ETF's price movements and the broader market trends, this integrated analytical approach provides a comprehensive view of the potential financial risks. The calculated VaR, in particular, offers a clear, quantified insight into the risks of investing in the iShares MSCI Turkey ETF, reflecting the effectiveness of leveraging volatility analyses alongside predictive modeling to inform investment decisions.
Analyzing the options chain for iShares MSCI Turkey ETF (TUR) and focusing on the call options, there are several factors to consider in identifying the most profitable options. These include the option Greeks such as delta, gamma, vega, theta, and rho, the strike price, days to expiration, premium, return on investment (ROI), and potential profit. The target stock price is aimed to be 5% over the current stock price.
Beginning with options that have a shorter time to expiration, the call option with a strike price of $33.0 expiring on 2024-02-16 appears highly valuable. It has a delta of 0.725, indicating a strong movement with the underlying asset. Its gamma value of 0.0408 suggests the delta's rate of change will also be favorable with the stocks movement. The high vega of 1.924 indicates good responsiveness to volatility, and despite a theta of -0.1537, suggesting daily time decay, its overall potential with an impressive ROI of approximately 190.47% and profit of $3.657 stands out.
Transitioning to medium-term expirations, a call option that captures attention has a strike of $34.0, set to expire on 2024-03-15. Its delta of 0.776 implies high sensitivity to the stock price movement, closely aligning with the target appreciation. Notably, its gamma of 0.0698 and a vega of 3.498 signal significant sensitivity to the underlying volatility and stock price changes, respectively. This option has an outstanding ROI of approximately 211.36%, with a profit of $3.107, making it an attractive choice despite its theta of -0.0201, which points to relatively higher time decay but is manageable given the other positive indicators.
Looking further ahead to options expiring in 2024-05-17, the option with a strike price of $34.0 presents lucrative potential. This option features a 0.724 delta, indicating it moves closely with the underlying asset. Its gamma of 0.0518 signals increased responsiveness to price movements of the underlying stock as it nears its expiration. With a vega of 6.428, it's poised to benefit substantially from increases in implied volatility, an important factor considering the ETFs exposure to the Turkish market. Furthermore, an ROI of about 108.05% and a profit of $2.377 make this option particularly appealing for mid-term strategic positioning, despite its theta value of -0.0133 which signifies a manageable rate of time decay.
For a long-term strategy, considering options expiring on 2025-01-17, the call option with a strike price of $21.0 seems intriguing. Boasting a delta of 0.933, it exhibits strong leverage to the underlying ETFs price movements, gearing towards the target price appreciation. The vega of 4.615 shows substantial sensitivity to volatility, a key factor over longer periods. Its ROI of approximately 102.03% and a quite significant profit potential of $8.877 suggest an excellent long-term investment opportunity, despite a relatively low theta of -0.0052, indicating very slow time decay over its holding period.
To conclude, focusing on options with varied expirations but each showcasing strong delta and vega values, alongside reasonable time decay rates (theta), provides a diversified approach to capitalizing on the anticipated price movement of the iShares MSCI Turkey ETF. Each option chosen exhibits a substantial ROI and profit potential, aligning well with a strategy aimed at benefiting from a 5% increase in the underlying ETFs price.
Similar Companies in Investment Trusts/Mutual Funds:
iShares MSCI Thailand ETF (THD), iShares MSCI Chile ETF (ECH), iShares MSCI South Africa ETF (EZA), iShares MSCI Indonesia ETF (EIDO), iShares MSCI Mexico ETF (EWW), Vanguard FTSE Emerging Markets ETF (VWO), Schwab Emerging Markets Equity ETF (SCHE), iShares Core MSCI Emerging Markets ETF (IEMG), Invesco QQQ Trust (QQQ), SPDR S&P 500 ETF Trust (SPY)
Copyright © 2024 Tiny Computers (email@tinycomputers.io)
Report ID: SVIysk
Cost: $0.12224
https://reports.tinycomputers.io/TUR/TUR-2024-02-06.html Home