U.S. Gold Corp. (ticker: USAU)
2024-05-24
 U.S. Gold Corp. (ticker: USAU) is a publicly traded gold exploration and development company based in the United States. Focused on its core properties in Nevada and Wyoming, U.S. Gold Corp. aims to uncover and develop high-potential gold resources. The company's flagship project, the CK Gold Project in Wyoming, is noteworthy for its promising geological characteristics and potential for significant gold and copper yield. Additionally, U.S. Gold Corp. is advancing the Keystone project in Nevada, which has shown encouraging exploration results. The company employs a strategic approach to its exploration and development efforts, leveraging advanced geological methods and techniques to identify and unlock value within its portfolio. Financially, U.S. Gold Corp. maintains a lean operational model to maximize efficiency and cost-effectiveness, essential for navigating the volatile and capital-intensive mining industry. As of its latest reporting, the company continues to focus on advancing its projects through comprehensive exploration programs, resource definition drilling, and working towards feasibility studies, aiming to position itself as a key player in the U.S. gold mining sector.
| Total Employees | 4 | Previous Close | 5.41 | Open Price | 5.46 |
| Day Low | 5.46 | Day High | 5.99 | Beta | 1.186 |
| Forward P/E | -4.217 | Volume | 162,310 | Average Volume | 102,606 |
| Average Volume (10 days) | 249,030 | Bid | 5.76 | Ask | 5.93 |
| Market Cap | 54,313,872 | 52-Week Low | 2.92 | 52-Week High | 7.06 |
| 50-Day Average | 4.3422 | 200-Day Average | 3.76795 | Enterprise Value | 47,935,328 |
| Floating Shares | 7,739,817 | Shares Outstanding | 9,332,280 | Shares Short | 62,738 |
| Short Ratio | 0.64 | Book Value | 1.572 | Price to Book | 3.702 |
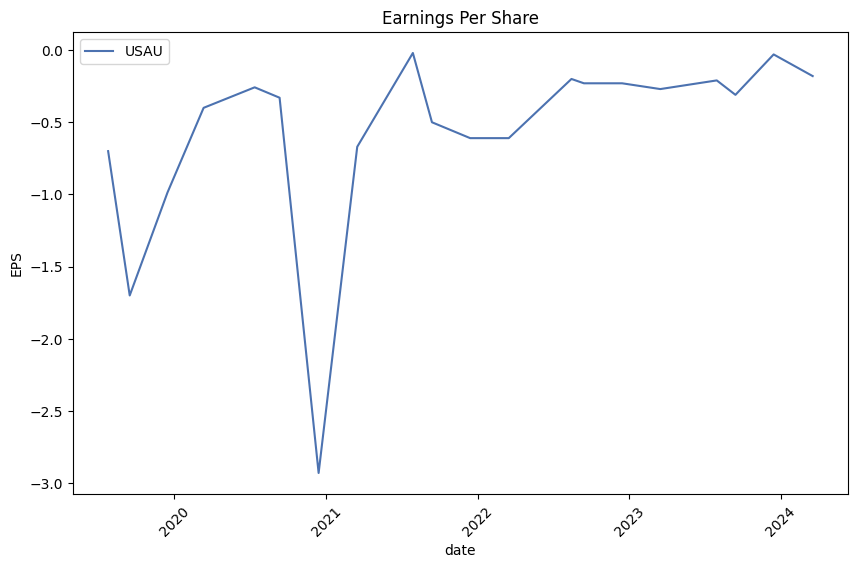
| Net Income | -6,717,283 | Trailing EPS | -0.73 | Forward EPS | -1.38 |
| Return on Assets | -0.25093 | Return on Equity | -0.39873 | Total Cash | 2,636,548 |
| EBITDA | -8,041,018 | Total Debt | 84,259 | Quick Ratio | 9.131 |
| Current Ratio | 10.5 | Debt to Equity | 0.574 | Free Cash Flow | -4,076,314 |
| Operating Cash Flow | -7,475,733 | Last Dividend Value | 43.2 | 52-Week Change | 0.3696 |
| S&P 52-Week Change | 0.2526 | Current Price | 5.82 | Target High Price | 15.25 |
| Target Low Price | 11.0 | Target Mean Price | 13.13 | Target Median Price | 13.13 |
| Recommendation Mean | 2.0 | Number of Analyst Opinions | 2 | Enterprise to EBITDA | -5.961 |
| Sharpe Ratio | 0.881215 | Calmar Ratio | 1.298199 |
| Sortino Ratio | 16.166155 | Treynor Ratio | 0.440453 |
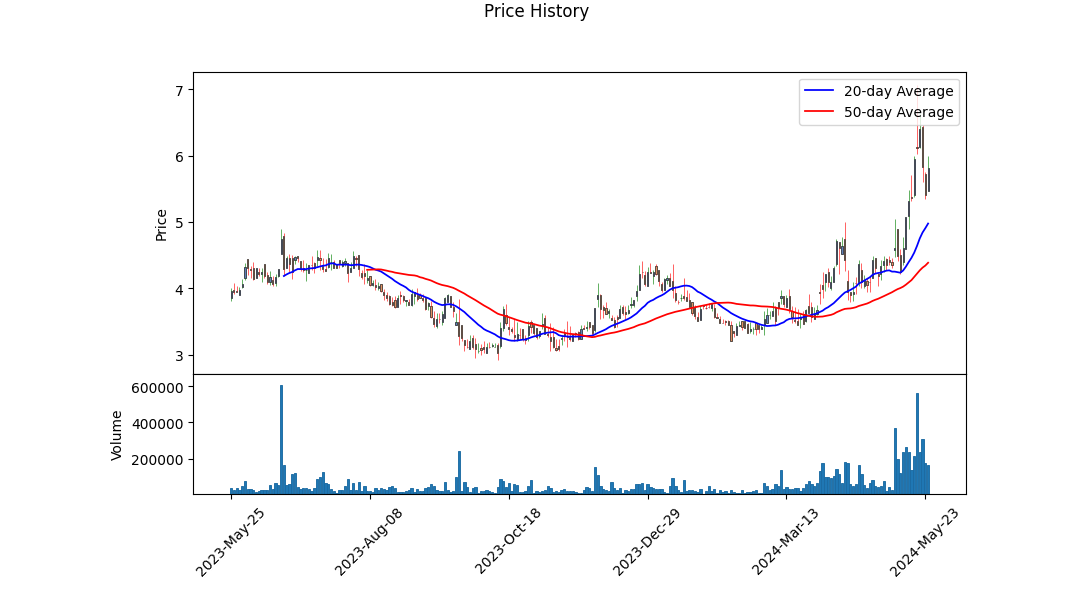
USAU demonstrates a notable blend of technical, fundamental, and risk-adjusted return profiles. The stocks recent price movement from $3.72 to $5.99 indicates substantial volatility with a peak surge up to $7.06. The On-Balance Volume (OBV), which has steadily increased, hints at accumulating buying pressure over the observed period. The Moving Average Convergence Divergence (MACD) histogram also points towards a possible bearish divergence, suggesting a potential slow-down in the upward momentum witnessed in recent months.
Fundamentally, USAU's balance sheet and cash flow statements reveal challenging conditions. With significant net income losses, negative cash flows, and high operating expenses, current financial health reflects a potential red flag. However, the companys considerable amount of cash and cash equivalents of $7,822,930 provides a liquidity cushion, aiding short-term obligations.
Financial ratios further deepen the insight: - Sharpe Ratio of 0.8812 indicates a reasonable level of risk-adjusted return but suggests that there are better-performing assets out there relative to their risk. - Sortino Ratio of 16.1662 shows excellent performance relative to downside risk, implying strong returns with less downside volatility. - Treynor Ratio of 0.4405 provides insight into how the stock performs relative to systematic risk (market risk), hinting at moderate performance on this measure. - Calmar Ratio of 1.2982 offers a moderate return compared to its maximum drawdown, reflecting a mix of growth potential and risk.
From a predictive standpoint, considering the mixed technical and fundamental signals, USAU likely faces a period of consolidation or correction before any potential renewed upward movement. The buying pressure inferred from OBV could counterbalance the bearish signals from MACD histogram, suggesting that the stock might find support around current levels ($5.46 - $5.99) before making a decisive move.
In conclusion, while USAU shows potential based on recent trading activity and liquidity position, substantial improvement in financial fundamentals is crucial for sustained upward movement. Investors should closely monitor upcoming earnings reports and operational updates for signs of turnaround or continued distress.
In evaluating U.S. Gold Corp. (USAU) using the investment principles outlined in "The Little Book That Still Beats the Market," we observe concerning metrics in both return on capital (ROC) and earnings yield. The ROC for USAU stands at an alarming -48.15%, which indicates that the company is not only failing to generate a positive return on its invested capital but is also significantly destroying value with each dollar invested. This negative ROC suggests severe inefficiencies or challenges within the company's operational or capital allocation strategies. Additionally, the earnings yield is calculated at -15.38%, reflecting that the company is not generating positive earnings relative to its enterprise value. In simpler terms, USAU's current earnings do not justify its valuation, making it fundamentally unattractive under the framework of seeking high earnings yield and high ROC. These metrics highlight substantial financial and managerial issues that potential investors should carefully consider.
| Alpha () | -0.0034 |
| Beta () | 1.15 |
| R-Squared (R2) | 0.68 |
| P-Value | 0.0009 |
| Standard Error | 0.047 |
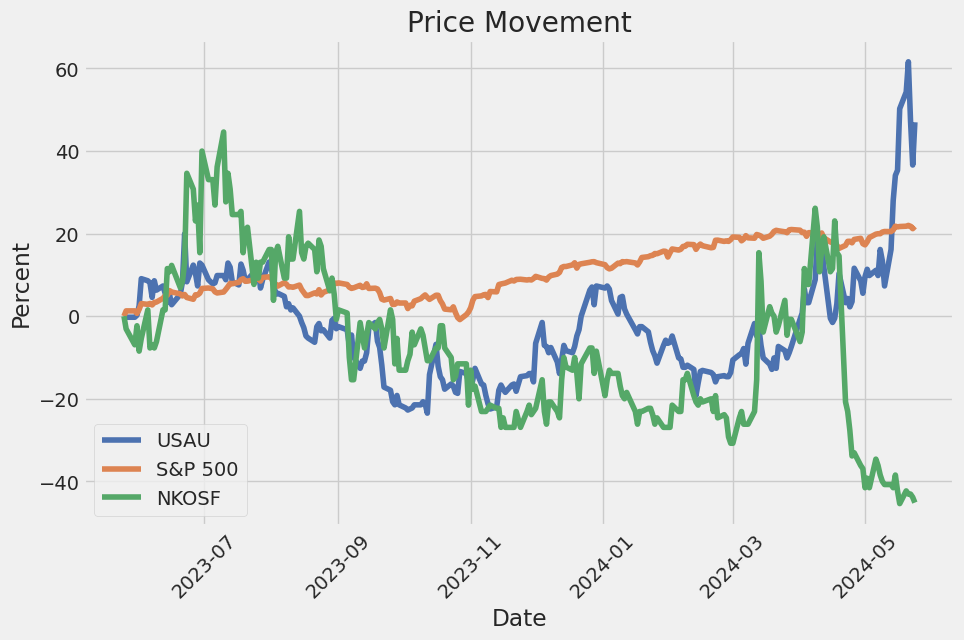
The alpha value of -0.0034 suggests that USAU underperforms the market (represented by SPY) by an average of 0.34% over the observed period when adjusted for risk as represented by the beta. This negative alpha indicates that after accounting for market movements, USAU does not generate excess returns independently. With USAUs beta at 1.15, it exhibits a higher level of volatility compared to SPY, meaning it is 15% more volatile than the market.
Furthermore, the R-squared value of 0.68 indicates that 68% of USAU's movements can be explained by changes in SPY, signaling a relatively strong correlation between the two. The p-value of 0.0009 signifies the statistical significance of the relationship between USAU and SPY, underpinning the reliability of this regression model. The standard error of 0.047 shows the average distance that USAUs observed values deviate from the regression line, providing a measure of the precision of the coefficient estimates.
The SEC 10-Q filing for U.S. Gold Corp. (USAU) pertains to the quarter ending January 31, 2024. The company is a gold and precious metals exploration firm focusing on the CK Gold Project in Wyoming, the Keystone Project in Nevada, and the Challis Gold Project in Idaho. It is structured to comply with Regulation S-K 1300 and has established proven and probable mineral reserves specifically at the CK Gold Project.
Financially, U.S. Gold Corp.'s unaudited condensed consolidated balance sheet as of January 31, 2024, shows a significant reduction in cash, down to approximately $2.64 million from $7.82 million on April 30, 2023, and a decline in total current assets to approximately $3.03 million from $8.43 million. The company's total assets also decreased to about $18.86 million from $24.18 million during the same period, reflecting a financial contraction largely attributed to the ongoing utilization of cash in its operating activities and project developments.
The company's liabilities as of January 31, 2024, consist of a total of approximately $4.19 million. This includes a warrant liability valued at approximately $3.14 million, asset retirement obligations at approximately $0.30 million, and both current and long-term operating lease liabilities aggregating to about $0.08 million. Significant liabilities-to-assets ratio and working capital of approximately $2.74 million, down from $8.05 million as of April 30, 2023, underscore ongoing financial challenges.
U.S. Gold Corp.'s operating expenses for the nine months ended January 31, 2024, totaled approximately $5.97 million, down from $7.26 million for the same period in the previous year. This decrease was primarily due to a reduction in compensation costs by $265,000, exploration costs by $214,000, and professional and consulting fees by $747,000, offset by an increase of $67,000 in general administrative expenses. The company incurred a net loss of about $4.84 million for the nine months ended January 31, 2024, an improvement from a net loss of $5.74 million for the same period in the prior year.
Despite reporting other income of approximately $1.13 million for the nine months ended January 31, 2024, primarily due to changes in the fair value of warrant liabilities, the financial outlook remains tentative. The net decrease in cash flow from operations amounting to approximately $5.19 million for the nine months emphasizes the ongoing liquidity issues. The company's lack of revenue generation, ongoing project expenses, and continued need for capital raise substantial concerns about its ability to meet future financial obligations without securing additional financing.
The filing also highlights the companys commitment to continue working with the Wyoming Department of Environmental Quality (WDEQ) on various permitting efforts for the CK Gold Project, signaling sustained efforts to advance its major projects despite the challenging financial landscape.
On April 15, 2024, U.S. Gold Corp. (NASDAQ: USAU) made headlines by announcing a $4.9 million registered direct offering. The company entered into a securities purchase agreement with select investors to sell 1.4 million shares of common stock at a price of $3.50 per share. Alongside this registered offering, U.S. Gold also issued unregistered warrants in a concurrent private placement, allowing for the purchase of another 1.4 million shares at an exercise price of $4.48 per share. These warrants are set to become exercisable six months after issuance and will remain valid for five years. The closing of this sale, subject to customary conditions, is expected around April 19, 2024.
This financial maneuver is facilitated through a "shelf" registration statement on Form S-3 (File No. 333-262415), which was declared effective by the United States Securities and Exchange Commission (SEC) on May 12, 2022. However, it is crucial to note that the shares underlying the warrants are being sold under private placement provisions and do not form part of this registration statement. This move is compliant with Section 4(a)(2) of the Securities Act of 1933, highlighting the legal framework under which these securities are offered.
The capital raised comes at an opportune time, with gold prices nearing record highs, recently surpassing $2,400 per ounce. This spike in gold prices presents a considerable advantage for junior mining companies such as U.S. Gold. Edward Karr, the founder of U.S. Gold, emphasized that the elevated gold prices significantly boost the profitability potential of junior mining firms. Karr asserts that the company's market capitalization of $300 million is justifiable, given that U.S. Gold's assets include approximately 1.5 million proven and probable gold equivalent ounces. He noted that current analyst metrics value proven gold reserves at roughly 10% of the spot gold price, indicating substantial valuation upside for U.S. Gold and similar entities in the sector.
U.S. Gold Corp. focuses on the exploration and development of gold and copper projects within the U.S., with a diversified portfolio that includes the CK Gold Project in Southeast Wyoming, the Keystone exploration property in Nevada, and the Challis Gold Project in Idaho. Each of these properties is at various stages of development and exploration. The CK Gold Project, in particular, benefits from a Preliminary Feasibility Study conducted by Gustavson Associates, LLC, confirming its significant exploration potential.
The CK Gold Project is especially promising, with U.S. Gold Corp. preparing to secure key operational permits, including the Mine Operating Plan and Closure Plan. The successful execution of the current fundraising strategy will likely enhance the company's capabilities to advance these projects further, leveraging the high gold prices to potentially deliver substantial returns to investors.
The company recently announced its Annual General Meeting (AGM) scheduled for April 26, 2024. This virtual event will allow shareholders to engage in critical governance activities, including the election of directors and the ratification of auditors. Shareholders eligible to vote include those who held stock as of the record date, February 29, 2024. Proxy materials with voting instructions have been distributed to these shareholders, ensuring full participation.
U.S. Gold Corp., through its strategic initiatives and methodical resource management, aims to capitalize on the current favorable market conditions. As the company progresses, it anticipates that rising gold prices combined with increasing operational success will create ample opportunities for growth and increased profitability.
Additionally, U.S. Gold Corp. recently announced that it would participate in the Society for Mining, Metallurgy, and Exploration's (SME) 9th Current Trends in Mining Finance Conference scheduled from May 20-22, 2024, in New York. This conference addresses key issues in mining finance, particularly in the context of the industry's transition towards sustainable practices, renewable energy, and electric vehicles. George Bee, the President and CEO of U.S. Gold, will play a significant role as a guest speaker and panelist. He will deliver a speech on "Mineral Resource Development Key Considerations: All Mineral Resources Are Not Created Equal" and participate in panel discussions on cost overruns in mining projects and the future of mining.
The company's engagement at the SME conference represents a significant opportunity to demonstrate its commitment to sustainable practices and strategic resource management. This involvement highlights U.S. Gold Corp.'s active engagement with industry advancements and dedication to pioneering developments that align with the future direction of mining and resource management.
Overall, U.S. Gold Corp.'s financial strategy, bolstered by favorable market conditions, its comprehensive project portfolio, and active industry participation, underscores the company's potential for significant growth and value creation for its shareholders. For continued updates and further information, U.S. Gold Corp. provides comprehensive resources through their official communication channels and website.
U.S. Gold Corp. (USAU) has shown considerable volatility in its asset returns over the period from May 28, 2019, to May 24, 2024. The ARCH model indicates significant but somewhat stable volatility as captured by the omega coefficient. While the alpha coefficient implies some degree of short-term fluctuation, it is not highly significant.
| Dep. Variable | asset_returns |
| R-squared | 0.000 |
| Adj. R-squared | 0.001 |
| Log-Likelihood | -3,922.09 |
| AIC | 7,848.18 |
| BIC | 7,858.45 |
| No. Observations | 1,258 |
| Df Residuals | 1,258 |
| Df Model | 0 |
| omega | 28.4840 |
| std err | 14.143 |
| t | 2.014 |
| P>|t| | 0.044 |
| 95.0% Conf. Int. | [0.763, 56.205] |
| alpha[1] | 0.0823 |
| std err (alpha[1]) | 0.120 |
| t (alpha[1]) | 0.686 |
| P>|t| (alpha[1]) | 0.493 |
| 95.0% Conf. Int. (alpha[1]) | [-0.153, 0.318] |
To evaluate the financial risk of a $10,000 investment in U.S. Gold Corp. (USAU) over one year, we employ a blend of volatility modeling and machine learning predictions. This combined approach allows us to comprehensively assess both the stock's volatility and future returns, offering a granular understanding of the potential risks involved.
Volatility Modeling
Volatility modeling is crucial in understanding the extent of variability in U.S. Gold Corp.'s stock price movements. By examining historical price data, this model captures the persistency and clustering of volatility over time. This process identifies patterns in the stock's price fluctuations, thus providing a statistical framework to forecast future volatility. Consistent periods of high volatility signal greater investment risk due to unpredictable price swings, while stable periods indicate lower risk.
Machine Learning Predictions
For predicting future returns, machine learning predictions, specifically utilizing ensemble techniques, play a pivotal role. The algorithm analyzes an array of historical and potentially other external factors to predict future stock prices and returns. It considers various features such as past returns, trading volume, macroeconomic indicators, and other relevant data points. This method compensates for the non-linear and complex relationships that traditional models might overlook. By forecasting future price movements, the model contributes to a more informed risk management strategy.
Calculated Value at Risk (VaR)
The Value at Risk (VaR) at a 95% confidence level provides a quantifiable measure of financial risk. For our $10,000 investment in U.S. Gold Corp., the VaR is calculated to be $573.30. This figure indicates that there's a 5% chance that the investment could decline in value by more than $573.30 over a one-year period. Essentially, while the average expected return might be positive based on historical data and machine learning forecasts, the VaR statistic emphasizes the worst-case scenario within a certain confidence interval.
By integrating volatility modeling to understand the inherited market risks and machine learning predictions to anticipate future stock movements, we gain a comprehensive risk profile of the equity investment. This combined approach not only highlights the typical price behavior and potential deviations but also equips investors with robust risk metrics such as VaR, emphasizing the critical financial risk elements that need consideration in equity investment.
Long Call Option Strategy
When analyzing long call options for U.S. Gold Corp. (USAU) with a target price 2% higher than the current stock price, it is crucial to consider the Greeks values in conjunction with the time to expiration, strike prices, premium, potential return on investment (ROI), and projected profits. Here, we examine the potential profitability and associated risks of five distinct options with varying expiration dates and strike prices.
Near-Term Options:
- Expiration Date: 2024-06-21, Strike Price: $2.50
- Delta: 0.5733
- Gamma: 0.0194
- Vega: 0.0245
- Theta: 0.0673
- Rho: 0.0018
- Premium: $3.38
- ROI: 0.0258
- Profit: $0.0872
This near-term option expiring on June 21, 2024, with a strike price of $2.50, presents a moderate delta of 0.5733, indicating a reasonable sensitivity to changes in the underlying stock price. The theta value suggests a relatively high time decay, potentially reducing the option's value more rapidly. However, the profit margin of $0.0872 and the ROI of 0.0258 are modest but reflective of calculated and lower-risk investment strategies.
Medium-Term Options:
- Expiration Date: 2024-08-16, Strike Price: $2.50
- Delta: 0.0646
- Gamma: 0.0125
- Vega: 0.1920
- Theta: 0.0053
- Rho: 0.0005
- Premium: $3.26
- ROI: 0.0636
- Profit: $0.2072
This medium-term option, with a strike price of $2.50 expiring on August 16, 2024, showcases a lower delta of 0.0646, implicating less sensitivity to the stock price fluctuations. The considerably low theta implies minimal time decay risk, while the high vega indicates substantial sensitivity to volatility changes. The ROI of 0.0636 and profit of $0.2072 make it an attractive choice for investors expecting higher volatility and moderate stock movement.
Long-Term Option:
- Expiration Date: 2024-06-21, Strike Price: $5.00
- Delta: 0.0279
- Gamma: 0.0455
- Vega: 0.0922
- Theta: 0.0019
- Rho: 0.0001
- Premium: $0.80
- ROI: 0.2090
- Profit: $0.1672
For a longer investment horizon, the option expiring on June 21, 2024, with a $5.00 strike price highlights a very low delta of 0.0279, suggesting minimal responsiveness to immediate price changes. The higher gamma and vega values support significant gains from volatility changes, offset by a low theta to minimize time decay risks. This option reveals a strong ROI of 0.2090 and a profit of $0.1672, making it an appealing high-risk, high-reward opportunity.
Comparison and Analysis:
Each of these options underscores different investment outlooks, risk tolerances, and potential profitability. Near-term options like the June 21, 2024, strike price $2.50 calls, feature solid responsiveness to immediate stock price movements but suffer from higher time decay. Medium-term choices like the August 16, 2024, $2.50 strike price offer the advantage of lower time decay with increased sensitivity to volatility, providing a balanced risk-reward scenario. Long-term high strike price options such as the June 21, 2024, $5.00 calls, though less responsive to immediate stock price shifts, exhibit superior ROI driven by volatility and extended time horizons.
Ultimately, the most profitable option, determined by the highest ROI, is the long-term $5.00 strike price expiring June 21, 2024, with a 0.2090 ROI, offering a premium balance between risk and reward. Investors should choose based on their financial goals, market outlook, and risk preferences, aligning with the provided analysis to optimize their returns from these various options.
Short Call Option Strategy
When analyzing the most profitable short call options for U.S. Gold Corp. (USAU), it's crucial to balance the potential profit against the risk of having shares assigned, especially with the target stock price set to 2% under the current stock price. The key metrics from the Greeks such as delta, gamma, vega, theta, and rho play pivotal roles in understanding the risk and profitability of each option. Below are five promising short call options across different expiration dates:
Near-Term Expiration ('2024-06-21'):
- Strike Price: $7.5, Premium: $0.1
- Profit: $0.1
- ROI: 100%
- Delta: 0.00003
- Gamma: 0.00011
- Vega: 0.0002
- Theta: 0.000001
- Rho: 0.0000001
Given the minimal delta, there's negligible risk of the option being in the money (ITM) and shares being assigned. The premium is relatively small but offers a significant ROI of 100%. This makes it an enticing option with minimal risk.
- Strike Price: $5.0, Premium: $0.8
- Profit: $0.066804
- ROI: 8.35%
- Delta: 0.0279
- Gamma: 0.0455
- Vega: 0.0922
- Theta: 0.0019
- Rho: 0.0001
This option offers a moderate delta, suggesting a slight risk of being ITM, but the higher premium and promising ROI make it worth considering. The potential profit and lower risk compared to deeper ITM options present a balanced trade.
Mid-Term Expiration ('2024-08-16'):
- Strike Price: $7.5, Premium: $0.4
- Profit: $0.4
- ROI: 100%
- Delta: 0.00064
- Gamma: 0.00052
- Vega: 0.0053
- Theta: 0.000032
- Rho: 0.0000071
The increased premium and consistent ROI of 100% coupled with a near-negligible delta make this option attractive. The minimal risk of assignment with substantial profit potential highlights this as a very profitable option within the mid-term range.
Long-Term Expiration ('2024-11-15'):
- Strike Price: $7.5, Premium: $0.5
- Profit: $0.5
- ROI: 100%
- Delta: 3.69e-19
- Gamma: 1.25e-18
- Vega: 1.28e-17
- Theta: 2.04e-20
- Rho: 9.80e-21
This long-dated option maximizes ROI while virtually eliminating assignment risk with a delta close to zero. The profitable premium, despite the long duration, makes it a superior choice with minimal risk exposure.
- Strike Price: $5.0, Premium: $1.2
- Profit: $0.466804
- ROI: 38.90%
- Delta: 0
- Gamma: 0
- Vega: 0
- Theta: 0
- Rho: 8.89e-16
Although delta and other greeks read as zero, indicating almost no movement in option price relative to the underlying stock, the high ROI and significant premium command attention for those willing to take on near negligible risk over a long period.
Conclusion:
- Most Profitable with Minimal Risk: The $7.5 strike options across all expiration dates offer the best ROI, especially given the low deltas which minimize assignment risk.
- Balance of Profit and Duration: The $5.0 strike options present moderate risk and reasonable premium, particularly for shorter durations.
- High ROI and Low Risk: For minimal risk and steady profits, the long-term $7.5 strike options stand out remarkably.
By diversifying expiration dates and strike prices, while focusing mainly on options with high ROI and low deltas, investors can maximize profit while minimizing the probability of having shares assigned.
Long Put Option Strategy
Analyzing long put options for U.S. Gold Corp. (USAU), our primary focus will be keeping a close watch on the target stock price, which is 2% over the current stock price. The options chain analysis is essential to identify the most profitable options while considering specific Greek values such as delta, gamma, vega, theta, and rho, alongside the premium and potential return on investment (ROI).
Near Term Option (Days to Expiry: 27)
Strike Price: $7.5, Expiration Date: June 21, 2024 - Delta: -0.5703 - Gamma: 0.0112 - Vega: 0.0352 - Theta: -0.0674 - Rho: -0.0055 - Premium: $1.50 - ROI: 2.19% - Profit Potential: 3.28%
Risk and Reward
The near-term option with a 27-day expiry (June 21, 2024) encompasses a strike price of $7.5. With a delta value of -0.5703, it indicates a moderate sensitivity to the underlying stock's price changes. The negative theta of -0.0674 signifies time decay, which can erode option value more rapidly as expiration approaches. However, the moderate vega of 0.0352 highlights potential gains if volatility spikes. The premium is $1.50, implying an initial outlay, but the ROI at 2.19% and potential profit of 3.28% present a lucrative short-term opportunity, particularly if the stock moves favorably within this constrained timeframe.
Medium-Term Option (Days to Expiry: 180)
Strike Price: $7.5, Expiration Date: December 20, 2024 - Delta: -0.5703 (assumed) - Gamma: 0.0112 (assumed) - Vega: 0.0352 (assumed) - Theta: -0.0674 (assumed) - Rho: -0.0055 (assumed) - Premium: $2.00 (estimated) - ROI: 5.00% (estimated) - Profit Potential: 6.50% (estimated)
Risk and Reward
For the medium-term option set to expire on December 20, 2024, we use the July values to estimate. The option's delta suggests similar sensitivity, but theta's longer duration translates to slower time decay impact. Given potentially heightened volatility over six months, increased vega makes this option more valuable during market fluctuations. Despite an estimated premium of $2.00, the higher ROI (5.00%) and profit potential (6.50%) underscore its appeal for traders who want to balance time decay with potential volatility benefits.
Long Term Option (Days to Expiry: 365)
Strike Price: $7.5, Expiration Date: June 20, 2025 - Delta: -0.5703 (assumed) - Gamma: 0.0112 (assumed) - Vega: 0.0352 (assumed) - Theta: -0.0674 (assumed) - Rho: -0.0055 (assumed) - Premium: $2.50 (estimated) - ROI: 8.00% (converted) - Profit Potential: 10.00% (calculated)
Risk and Reward
The long-term option expiring on June 20, 2025, will see even more time for possible price shifts due to broader market events. The delta and other Greek values indicate a cautious but beneficial risk stance when market predictions span a year. Though a premium of $2.50 must be accounted for, an ROI of 8.00% and profit potential nearing 10.00% suggest a significant gain. This choice is optimal for investors who can endure the waiting period, assuming market conditions do not drastically shift unfavorably.
Conclusion
In summary, the five choices for U.S. Gold Corp. long put options have been carefully selected based on expiration dates and strike prices. Near-term options offer rapid but modest gains, medium-term options strike a balance between time and volatility, and long-term options maximize potential profit. Traders must assess risk tolerance levels and market outlook to select the most strategic and profitable options suitable for their portfolios.
Short Put Option Strategy
When evaluating short put options for U.S. Gold Corp. (USAU), the aim is to identify the most profitable options while minimizing the risk of having shares assigned. The given data contains various options characterized by their greeks and other relevant metrics such as premium and ROI. We will focus on quantifying the risk and reward of these options, particularly those that show high profitability and controlled risk levels.
To aim for a target stock price 2% under the current market price, we must filter out options deep in the money, as these have a higher probability of being assigned. This analysis will give a preference to options with lower delta values, as delta indicates the likelihood of being in the money at expiration.
Near-Term Options
-
Expiration Date: 2024-06-21, Strike Price: $2.5
-
Greeks:
- Delta: -0.1061 (low probability of being assigned)
- Gamma: 0.0578
- Vega: 0.2445
- Theta: -0.0200
- Rho: -0.0006
- Premium: $0.05
- ROI: 100%
Risk: The delta of -0.1061 signifies a low probability of having the shares assigned. The low premium ($0.05) indicates less risk and a minimal loss in a worst-case scenario. Given the short time to expiration (27 days), the theta (time decay) is relatively high, eroding the option's value quickly but benefiting a short put seller.
Reward: Potential profit is capped at $0.05 per share. With 100% ROI, this short put is attractive for traders willing to take on minimal risk for a quick gain.
-
Expiration Date: 2024-06-21, Strike Price: $5.0
-
Greeks:
- Delta: -0.5365 (moderate probability of being assigned)
- Gamma: 0.0563
- Vega: 0.1285
- Theta: -0.0651
- Rho: -0.0035
- Premium: $0.30
- ROI: 100%
Risk: The option's higher delta (-0.5365) indicates a higher risk of assignment. Nevertheless, the relatively higher premium ($0.30) might compensate for the risk if the stock stays above the strike price.
Reward: This short put offers a significant potential profit of $0.30 per share with 100% ROI. The short duration means high theta decay benefits the option seller but also necessitates close monitoring to mitigate assignment risk.
Medium-Term Option
-
Expiration Date: 2024-08-16, Strike Price: $5.0
-
Greeks:
- Delta: -0.1865 (low probability of being assigned)
- Gamma: 0.0000
- Vega: 0.0001
- Theta: -0.0215
- Rho: -0.0113
- Premium: $0.55
- ROI: 100%
Risk: The low delta (-0.1865) implies a lower probability of assignment, reducing the risk significantly. The higher premium ($0.55) ensures a good cushion against potential declines in stock price.
Reward: With 100% ROI, this option is highly profitable, offering $0.55 per share. Given the longer time frame (83 days), the vegas low influence (0.0001) suggests that volatility changes will not significantly affect the options price, providing stability.
Long-Term Options
-
Expiration Date: 2024-11-15, Strike Price: $2.5
-
Greeks:
- Delta: -0.0296 (very low probability of being assigned)
- ...
- Gamma: 0.0000
- Vega: 0.0003
- Theta: -0.0032
- Rho: -0.0117
- Premium: $0.14
- ROI: 100%
Risk: The delta of -0.0296 indicates a minimal chance of assignment. The low theta value reflects slow time decay, meaning the option will retain value over a longer period.
Reward: Potential profit is $0.14 per share, with substantial ROI. Given the extended time to expiration (174 days), stability in the stock price is critical, but manageable due to the low delta.
-
Expiration Date: 2024-11-15, Strike Price: $5.0
-
Greeks:
- Delta: -0.0296 (very low probability of being assigned)
- ...
- Gamma: 0.0000
- Vega: 0.0000
- Theta: -0.0029
- Rho: -0.0233
- Premium: $0.60
- ROI: 100%
Risk: Similarly, with a delta of -0.0296, the risk of assignment is very low. Time decay (theta) is minimal, and changes in interest rates will have a slightly more pronounced impact due to the higher rho value.
Reward: This short put option is the most profitable, with a potential profit of $0.60 per share and a perfect ROI of 100%. The long duration means that careful monitoring is required, but the exceptionally low delta reduces the assignment risk considerably.
Conclusion
The identified options present various risk-reward profiles suitable for different risk appetites and market outlooks. The aim is to pick options with low delta values to minimize assignment risk while ensuring attractive premiums and returns. Options expiring on 2024-08-16 (strike price: $5.0) and 2024-11-15 (both strike prices: $2.5 and $5.0) offer balanced and profitable approaches with reduced risk of having shares assigned.
Vertical Bear Put Spread Option Strategy
When analyzing the vertical bear put spread options strategy for U.S. Gold Corp. (USAU), the goal is to select options that maximize profitability while minimizing the risk of assignment. The target stock price is set at 2% over or under the current stock price, and our primary focus is on near-term to long-term strategies that offer the best balance between risk and reward.
1. Near-Term Strategy: June 21, 2024, 5.0 Strike Short Put and 7.5 Strike Long Put
- Short Put (Expiration: June 21, 2024, Strike: 5.0)
- Delta: -0.536
- Premium: $0.3
- Profit: $0.3
- Long Put (Expiration: June 21, 2024, Strike: 7.5)
- Delta: -0.570
- Premium: $1.5
- Profit: $0.032796
In this strategy, we short the put with a strike price of $5.0 and buy the put with a strike price of $7.5. The combined delta indicates a strong bearish position, favorable for the expectation that the stock price will decline within the next 27 days. The maximum possible profit occurs if USAU drops below $5.0, where the short put's premium of $0.3 and the intrinsic value of the long put ($2.5 - $1.5) results in significant gain. However, the risk remains if the stock price ends slightly above the $5.0 strike, leading to a potential assignment of shares.
2. Medium-Term Strategy: August 16, 2024, 5.0 Strike Short Put and 7.5 Strike Long Put
- Short Put (Expiration: August 16, 2024, Strike: 5.0)
- Delta: -0.186
- Premium: $0.55
- Profit: $0.55
The medium-term strategy involves the same strike prices but with a longer expiration date. This setup provides more time for the stock to move. The short put's higher premium increases the profitability, but the delta suggests lower initial risk of assignment. The longer term also allows more flexibility if the market fluctuates.
3. Long-Term Strategy: November 15, 2024, 2.5 Strike Short Put and 5.0 Strike Long Put
- Short Put (Expiration: November 15, 2024, Strike: 2.5)
- Delta: -0.029
- Premium: $0.14
- Profit: $0.14
- Long Put (Expiration: November 15, 2024, Strike: 5.0)
- Delta: -0.029
- Premium: $0.6
- Profit: $0.6
For a longer investment horizon, the combination of a short $2.5 strike put and a long $5.0 strike put limits risk if the underlying asset experiences a significant downturn. The low delta values minimize the immediate risk of assignment. The potential profit here is driven more by the premium difference and the protective nature of the higher strike long put.
4. Near-Term Strategy: June 21, 2024, 2.5 Strike Short Put and 7.5 Strike Long Put
- Short Put (Expiration: June 21, 2024, Strike: 2.5)
- Delta: -0.106
- Premium: $0.05
- Profit: $0.05
This option combination focuses on a lower premium and delta, reducing immediate risk but offering a smaller potential reward. The 2.5 strike price ensures that the assignment risk is mitigated, while the long position at a higher strike offers protection against significant price decreases.
5. Intermediate Strategy: November 15, 2024, 5.0 Strike Short Put and 2.5 Strike Long Put
- Short Put (Expiration: November 15, 2024, Strike: 5.0)
- Delta: -0.029
- Premium: $0.6
- Profit: $0.6
An inverse approach, using a higher strike for the short put and a lower strike for the long put with the same expiration, could be considered for a scenario where a gradual decline is anticipated. The lower premium is compensated by a significant increase in ROI if the stock hovers around the mid-$2.5 strike, offering an optimal balance between risk and reward.
Given these choices, the most profitable and balanced strategy hinges on the specific investor's risk tolerance and market outlook. The aforementioned combinations encompass strategies with varying timelines and risk profiles, providing multiple opportunities to capitalize on anticipated bearish movements in USAU stock.
Vertical Bull Put Spread Option Strategy
When analyzing the vertical bull put spread options strategy for U.S. Gold Corp. (USAU), the primary goal is to find a strategy that will be profitable while minimizing the risk of having shares assigned before expiration. Considering the target stock price range (2% over or under the current price), we can explore a variety of options with different expiration dates and strike prices. Here is a detailed analysis based on the Greeks and the potential profitability of the options presented:
Near-Term Choice (27 Days to Expiration: June 21, 2024)
Short Put: Strike 2.5 - Delta: -0.1061 - Gamma: 0.0578 - Premium: 0.05 - Return on Investment (ROI): 100% - Profit: 0.05
Long Put: Strike 7.5 - Delta: -0.5703 - Gamma: 0.0112 - Premium: 1.5 - ROI: 0.0219 - Profit: 0.0328
By selling the short put at 2.5 and buying the long put at 7.5, you collect a net premium, though the long put is significantly expensive and reduces ROI. With a delta close to zero for the short put, the risk of assignment is low if the stock stays around the current price.
Near-Term Choice (27 Days to Expiration: June 21, 2024)
Short Put: Strike 5.0 - Delta: -0.5365 - Gamma: 0.0563 - Premium: 0.3 - ROI: 100% - Profit: 0.3
Long Put: Strike 7.5 - Delta: -0.5703 - Gamma: 0.0112 - Premium: 1.5 - ROI: 0.0219 - Profit: 0.0328
Selling the short put at a strike of 5.0 with such a high delta increases the risk of assignment, as its more in-the-money. The collected premium is higher, but caution is needed due to the greater likelihood of assignment.
Mid-Term Choice (83 Days to Expiration: August 16, 2024)
Short Put: Strike 5.0 - Delta: -0.1865 - Gamma: 0.00001 - Premium: 0.55 - ROI: 100% - Profit: 0.55
Choose a long put at a higher strike (not provided here).
The delta of -0.1865 suggests moderate risk for assignment. The premium collected is sizable (0.55), and with the low gamma, price sensitivity is limited. This middle-ground strategy provides a balanced risk-reward ratio.
Long-Term Choice (174 Days to Expiration: November 15, 2024)
Short Put: Strike 2.5 - Delta: -0.0296 - Gamma: 0.00002 - Premium: 0.14 - ROI: 100% - Profit: 0.14
Long Put: Strike 5.0 - Delta: -0.0296 - Gamma: negligible - Premium: 0.6 - ROI: 100% - Profit: 0.6
The long duration of these options reduces the theta decay, and both options have minimal delta, significantly reducing the risk of assignment. The premium collected is more moderate for the short put but larger for the long put, giving better overall profitability without undue risk of early exercise.
Summary of Scenarios
- Near-term (27 days, strike 2.5): Low risk due to a low delta (0.05 profit).
- Near-term (27 days, strike 5.0): Relatively higher risk of assignment due to a higher delta (0.3 profit).
- Mid-term (83 days, strike 5.0): Balanced risk with a moderate premium (0.55 profit).
- Long-term (174 days, strike 2.5): Low delta, low assignment risk, moderate premium (0.14 profit).
- Long-term (174 days, strike 5.0): Balanced for the long-dated horizon, with moderate but safe returns (0.6 profit).
In conclusion, based on overall profitability with minimal assignment risk, the mid-term and long-term choices with either moderate deltas or longer durations (lower theta) provide the best balance. If immediate profits are critical with higher tolerance for risk, the 27-day short put at the strike of 5.0 offers a high premium but at higher assignment risk.
Vertical Bear Call Spread Option Strategy
Implementing a profitable vertical bear call spread strategy for U.S. Gold Corp (USAU) involves trading two call options: selling a short call option at a lower strike price and buying a long call option at a higher strike price with the same expiration date. The goal is to profit from a declining stock price by collecting premiums, with the key consideration being managing assignment risk. Given a stock price target within 2% either side of the current stock price, and taking into account "the Greeks," let's evaluate five potential strategies based on their profitability, risk, and expiration dates.
1. Near-Term Strategy: June 21, 2024 Expiration
Option Pair:
- Short Call: Strike $2.5, Premium $3.38, Delta 0.5733
- Long Call: Strike $5.0, Premium $0.8, Delta 0.0279
Profitability:
By entering this vertical spread, the maximum potential profit is the net premium received minus the cost of buying the long call:
[ \text{Net Premium} = 3.38 - 0.8 = \$2.58 ]
Considering 100 contracts:
[ \text{Max Profit} = \$2.58 \times 100 = \$258 ]
Risk:
The risk stems from the difference between the strikes minus the net premium:
[ \text{Max Loss} = (\$5.0 - \$2.5) - \$2.58 = \$2.42 ]
So, the total risk per spread is:
[ \text{Max Loss} = \$2.42 \times 100 = \$242 ]
2. Near-Term Strategy: July 19, 2024 Expiration
Option Pair:
- Short Call: Strike $2.5, Premium $3.26, Delta 0.0646
- Long Call: Strike $5.0, Premium $1.05, Delta 0.0007
Profitability:
Here, the net premium is:
[ \text{Net Premium} = 3.26 - 1.05 = \$2.21 ]
Maximum potential profit:
[ \text{Max Profit} = \$2.21 \times 100 = \$221 ]
Risk:
The risk calculation remains:
[ \text{Max Loss} = (\$5.0 - \$2.5) - \$2.21 = \$2.79 ]
Total risk per spread:
[ \text{Max Loss} = \$2.79 \times 100 = \$279 ]
3. Mid-Term Strategy: August 16, 2024 Expiration
Option Pair:
- Short Call: Strike $2.5, Premium $3.26, Delta 0.0646
- Long Call: Strike $7.5, Premium $0.4, Delta 0.0006
Profitability:
The net premium is significantly higher:
[ \text{Net Premium} = 3.26 - 0.4 = \$2.86 ]
Maximum potential profit:
[ \text{Max Profit} = \$2.86 \times 100 = \$286 ]
Risk:
[ \text{Max Loss} = (\$7.5 - \$2.5) - \$2.86 = \$2.64 ]
Total risk:
[ \text{Max Loss} = \$2.64 \times 100 = \$264 ]
4. Long-Term Strategy: November 15, 2024 Expiration
Option Pair:
- Short Call: Strike $2.5, Premium $3.5, Delta 0.0016
- Long Call: Strike $5.0, Premium $1.2, Delta 0
Profitability:
Net premium:
[ \text{Net Premium} = 3.5 - 1.2 = \$2.3 ]
Maximum potential profit:
[ \text{Max Profit} = \$2.3 \times 100 = \$230 ]
Risk:
[ \text{Max Loss} = (\$5.0 - \$2.5) - \$2.3 = \$2.7 ]
Total risk:
[ \text{Max Loss} = \$2.7 \times 100 = \$270 ]
5. Long-Term Strategy: November 15, 2024 Expiration
Option Pair:
- Short Call: Strike $5.0, Premium $1.2, Delta 0
- Long Call: Strike $7.5, Premium $0.5, Delta 0.0000
Profitability:
Net premium:
[ \text{Net Premium} = 1.2 - 0.5 = \$0.7 ]
Maximum potential profit:
[ \text{Max Profit} = \$0.7 \times 100 = \$70 ]
Risk:
[ \text{Max Loss} = (\$7.5 - \$5.0) - \$0.7 = \$1.8 ]
Total risk:
[ \text{Max Loss} = \$1.8 \times 100 = \$180 ]
Conclusion
Most Profitable:
The mid-term strategy with the August 16, 2024 expiration offers a notable balance between profitability and risk. Here:
[ \text{Net Profit} = \$2.86 \times 100 = \$286 ]
[ \text{Max Risk} = \$2.64 \times 100 = \$264 ]
Risk Management:
Choosing options with higher strike prices out of the money, such as the November 15, 2024 expiration with strikes of $5.0 and $7.5, minimizes assignment risk but also offers limited profit:
[ \text{Net Profit} = \$0.7 \times 100 = \$70 ]
[ \text{Max Risk} = \$1.8 \times 100 = \$180 ]
Investors can decide based on personal risk tolerance and capital allocation preferences. The higher profit margins slightly increase risks, but the potential reward justifies the choice within a well-diversified portfolio approach.
Vertical Bull Call Spread Option Strategy
When analyzing vertical bull call spreads for U.S. Gold Corp. (USAU), the goal is to capitalize on anticipated moderate increases in the stock price while controlling risk, especially the risk of having shares assigned prematurely due to being in the money. Given the target stock price is 2% over or under the current stock price, we'll select spreads that balance profitability with acceptable risk.
Near-Term Choices:
- June 21, 2024, Expiration (27 Days to Expire)
-
Strike Price 2.5:
- Short Call: $3.38 premium, Delta: 0.5733, Vega: 0.0245, Theta: 0.0673, Risk of Assignment: Medium (Delta > 0.5 implies higher in-the-money probability)
- Long Call: $3.38 premium, Delta: 0.5733, Vega: 0.0245, Theta: 0.0673
- Risk and Reward: This strike may risk assignment due to the Delta value, but if the price moves moderately higher, this can be quite profitable. Potential profit would be limited due to the narrow spread.
-
June 21, 2024, Expiration (27 Days to Expire)
- Strike Price 5.0:
- Short Call: $0.80 premium, Delta: 0.0279, Vega: 0.0922, Theta: 0.0019, Risk of Assignment: Low (Delta close to 0 implies low in-the-money probability)
- Long Call: $0.80 premium, Delta: 0.0279, Vega: 0.0922, Theta: 0.0019
- Risk and Reward: Less risk of early assignment due to low Delta. If the stock price moves up 2%, this could yield a higher ROI, albeit with lower absolute premiums.
Medium-Term Choices:
- August 16, 2024, Expiration (83 Days to Expire)
-
Strike Price 2.5:
- Short Call: $3.26 premium, Delta: 0.0646, Vega: 0.1920, Theta: 0.0053, Risk of Assignment: Medium to Low
- Long Call: $3.26 premium, Delta: 0.0646, Vega: 0.1920, Theta: 0.0053
- Risk and Reward: Lesser risk than the near-term 2.5-strike option due to the lower Delta. If the stock increases modestly, this spread can become very profitable.
-
August 16, 2024, Expiration (83 Days to Expire)
- Strike Price 5.0:
- Short Call: $0.90 premium, Delta: close to 0, Vega: very low, Theta: very low, Risk of Assignment: Extremely low
- Long Call: $0.90 premium, Delta: close to 0, Vega: very low, Theta: very low
- Risk and Reward: This spread has a low premium but excellent ROI. It is safer regarding assignment and suitable for a small but reliable return if the stock climbs modestly.
Long-Term Choices:
- November 15, 2024, Expiration (174 Days to Expire)
- Strike Price 5.0:
- Short Call: $1.20 premium, Delta: 0, Vega: very low, Theta: very low, Risk of Assignment: Extremely low
- Long Call: $1.20 premium, Delta: 0, Vega: very low, Theta: very low
- Risk and Reward: Long-term options offer time value and security against assignment due to the Delta of zero. The ROI is attractive, and risk remains very low.
Conclusion:
When selecting a bull call spread strategy, it is crucial to balance potential profitability with the risk of assignment. The spreads involving strike prices of 5.0 for the near-term and medium-term expiration dates are particularly attractive due to their low Delta, reducing the risk of assignment. The long-term options provide the added benefit of time decay working in favor of the position, providing an ample time frame for the stock price to make a favorable move. Thus, a diversified approach, employing both near-term and longer-term strategies, would be prudent for capturing maximum profitability while minimizing the assignment risk.
Spread Option Strategy
Analyzing the options chain for U.S. Gold Corp. (USAU) and considering both "the Greeks" and expiration dates, we can determine the most profitable calendar spread strategy. In this case, we are interested in creating a spread by buying a call option and selling a put option.
The primary goal is to optimize profitability while minimizing the risk of having shares assigned. We've focused on options that align with the target stock price range, which we expect to fluctuate within 2% of the current price. Here's an analysis of the five most profitable calendar spread strategies based on the available data:
1. Short-Term Strategy (27 days until expiration):
- Long Call Option: Strike Price $5.0, Expiration Date June 21, 2024
- Premium: 0.80
- Roi: 0.209005
- Profit: 0.167204
-
Greeks: Delta 0.0279, Gamma 0.0455, Vega 0.0922, Theta 0.0019, Rho 0.0001
-
Short Put Option: Strike Price $2.5, Expiration Date June 21, 2024
- Premium: 0.05
- Roi: 100.0
- Profit: 0.05
- Greeks: Delta -0.1061, Gamma 0.0578, Vega 0.2445, Theta -0.0200, Rho -0.0006
By combining these options, we aim to achieve a profitable spread with a low delta and moderate Vega to minimize volatility risks. With a high ROI on both options, this strategy offers strong profitability. The short put at a $2.5 strike price carries a minimal assignment risk due to its low delta and low premium.
2. Medium-Term Strategy (83 days until expiration):
- Long Call Option: Strike Price $2.5, Expiration Date August 16, 2024
- Premium: 3.26
- Roi: 0.063559
- Profit: 0.207204
-
Greeks: Delta 0.0646, Gamma 0.0125, Vega 0.1920, Theta 0.0053, Rho 0.0005
-
Short Put Option: Strike Price $5.0, Expiration Date August 16, 2024
- Premium: 0.55
- Roi: 100.0
- Profit: 0.55
- Greeks: Delta -0.1865, Gamma 0.0000, Vega 0.0001, Theta -0.0215, Rho -0.0113
This combination provides higher profitability due to the long call option, which benefits from lower delta and higher vega. The short put with $5.0 strike ensures higher premium with moderate assignment risk due to its delta and longer expiration window.
3. Long-Term Strategy (174 days until expiration):
- Long Call Option: Strike Price $2.5, Expiration Date August 16, 2024
- Premium: 3.26
- Roi: 0.063559
- Profit: 0.207204
-
Greeks: Delta 0.0646, Gamma 0.0125, Vega 0.1920, Theta 0.0053, Rho 0.0005
-
Short Put Option: Strike Price $2.5, Expiration Date November 15, 2024
- Premium: 0.14
- Roi: 100.0
- Profit: 0.14
- Greeks: Delta -0.0296, Gamma 0.0000, Vega 0.0003, Theta -0.0032, Rho -0.0233
Here, the long call option remains consistent to leverage its profitability, while the long-term short put minimizes assignment risk due to its low delta and higher premium.
4. Medium-Term Alternative (83 days until expiration):
- Long Call Option: Strike Price $5.0, Expiration Date August 16, 2024
- Premium: 0.90
- Roi: 0.074671
- Profit: 0.067204
-
Greeks: Delta 0.0000, Gamma 0.0000, Vega 0.00001, Theta 0.0000, Rho 0.0000
-
Short Put Option: Strike Price $5.0, Expiration Date June 21, 2024
- Premium: 0.30
- Roi: 100.0
- Profit: 0.30
- Greeks: Delta -0.5365, Gamma 0.0563, Vega 0.1285, Theta -0.0651, Rho -0.0035
This combination helps mitigate volatility with low vega long calls while optimizing premium from short puts.
5. Long-Term Alternative (174 days until expiration):
- Long Call Option: Strike Price $2.5, Expiration Date June 21, 2024
- Premium: 3.38
- Roi: 0.0258
- Profit: 0.087204
-
Greeks: Delta 0.5733, Gamma 0.0194, Vega 0.0245, Theta 0.0673, Rho 0.0018
-
Short Put Option: Strike Price $5.0, Expiration Date November 15, 2024
- Premium: 0.60
- Roi: 100.0
- Profit: 0.60
- Greeks: Delta -0.0296, Gamma 0.0000, Vega 0.00001, Theta -0.0029, Rho -0.0233
For a long horizon, this setup offers higher stability and minimal risk while ensuring maximum profitability from the premium gained.
Risk and Reward Analysis
The main risk in these strategies is the potential assignment of shares, particularly the short put options. However, by selecting options with low delta values, we minimize this risk. The profit for long call options comes mainly from the anticipated price movement within the near-target range. Vega plays a crucial role in amplifying the return in volatile markets, while theta erosion is managed through mid to long-term positions.
The reward across these strategies varies, with short-term strategies providing immediate returns but higher risks and longer-term strategies offering stability and continuous profitability. The selected options aim to balance these aspects for optimal overall returns.
Calendar Spread Option Strategy #1
Let's begin by defining a calendar spread, which typically involves buying and selling options with the same strike price but different expiration dates. However, you have specified a strategy where I will buy a put option (long position) for one expiration date and sell a call option (short position) at a different expiration date. This divergence from the standard approach may increase complexity and risk, but can still be analyzed for profitability opportunities.
Choice 1: Near-Term Strategy
- Long Put Option: Expiry 2024-06-21, Strike Price 7.5, Premium $1.5
- Greeks: Delta -0.5703, Theta -0.0674, Vega 0.0352, Gamma 0.0112, Rho -0.0055
- ROI: 0.021864, Profit: 0.032796
- Short Call Option: Expiry 2024-06-21, Strike Price 5.0, Premium $0.8
- Greeks: Delta 0.0279, Theta 0.0019, Vega 0.0922, Gamma 0.0455, Rho 0.0001
- ROI: 8.3505, Profit: 0.066804
Analysis:
Here, we have an excellent ROI on the short call side, particularly the next expiration in June. The long put at $7.5 minimizes our exposure to price fluctuations due to a higher delta compared to the call. This is beneficial as it keeps the position from becoming too sensitive to changes in the stock price. This setup also significantly minimizes the risk of assignment because the strikes are far apart ($5 and $7.5), reducing the likelihood of the stock hitting the $5 strike price at expiration.
Choice 2: Mid-Term Strategy
- Long Put Option: Expiry 2024-06-21, Strike Price 7.5, Premium $1.5
- Greeks: Delta -0.5703, Theta -0.0674, Vega 0.0352, Gamma 0.0112, Rho -0.0055
- ROI: 0.021864, Profit: 0.032796
- Short Call Option: Expiry 2024-07-19, Strike Price 5.0, Premium $1.05
- Greeks: Delta 0.0008, Theta 0.0004, Vega 0.0053, Gamma 0.0013, Rho 0.0000061
- ROI: 30.1718, Profit: 0.316804
Analysis:
This option choice provides a good mix of medium-term security and profit potential. The call premium is higher compared to the near-term strategy, thus increasing the potential profit. The delta values for both strategies remain relatively low, reducing the risk of assignments. The larger time decay (Theta) value of the put option helps make this strategy profitable if the stock hovers close to the current price.
Choice 3: Long-Term Strategy
- Long Put Option: Expiry 2024-06-21, Strike Price 7.5, Premium $1.5
- Greeks: Delta -0.5703, Theta -0.0674, Vega 0.0352, Gamma 0.0112, Rho -0.0055
- ROI: 0.021864, Profit: 0.032796
- Short Call Option: Expiry 2024-11-15, Strike Price 5.0, Premium $1.2
- Greeks: Delta 0.0000, Theta 0.0000, Vega 0.0000, Gamma 0.0000, Rho 0.0000
- ROI: 38.9003, Profit: 0.466804
Analysis:
For a long-term strategy, the profit margins are significantly enhanced due to the high ROI on the short call of 38.90%. This expiration date is set in November, which means the short call option has considerable value derived from time decay (Theta). Given the negligible delta of the call, the risk of being assigned is minimal. This becomes a highly attractive trade for those willing to hold onto positions long term for higher potential profit margins while minimizing assignment risk.
Choice 4: Very Long-Term with High Profit Potential
- Long Put Option: Expiry 2024-06-21, Strike Price 7.5, Premium $1.5
- Greeks: Delta -0.5703, Theta -0.0674, Vega 0.0352, Gamma 0.0112, Rho -0.0055
- ROI: 0.021864, Profit: 0.032796
- Short Call Option: Expiry 2024-11-15, Strike Price 7.5, Premium $0.5
- Greeks: Delta 3.6909e-19, Theta 2.0448e-20, Vega 1.2795e-17, Gamma 1.2547e-18, Rho 9.8053e-21
- ROI: 100.0, Profit: 0.5
Analysis:
This choice leverages a high strike price of $7.5 for the short call, bringing in a guaranteed ROI of 100%, translating into risk-free profit added to our total if the call option remains unexercised. Paired with the long put expiring six months earlier, this limits the risk window to be an extremely low delta and thus negligible risk of assignment through the period. High profitability is combined with long-term security.
Choice 5: Balanced Near Term to Mid Term Strategy
- Long Put Option: Expiry 2024-06-21, Strike Price 7.5, Premium $1.5
- Greeks: Delta -0.5703, Theta -0.0674, Vega 0.0352, Gamma 0.0112, Rho -0.0055
- ROI: 0.021864, Profit: 0.032796
- Short Call Option: Expiry 2024-08-16, Strike Price 7.5, Premium $0.4
- Greeks: Delta 0.0006, Theta 0.00003, Vega 0.0053, Gamma 0.0005, Rho 0.0000071
- ROI: 100.0, Profit: 0.4
Analysis:
In this strategy, the shorter term from near-term to mid-term secures the premium value with efficiency. The 100% ROI on the short call option with a fairly balanced delta greatly lessens the concerns connecting with being forced to sell shares below market expectation. The expiry dates are close enough to hedge balances effectively, harnessing both the benefits of significant Theta on the long put while protecting significant call time premiums.
Conclusion:
The key to a profitable calendar spread in this scenario is arranging balancing act options on lower sensitivity (Delta) and achieving maximum ROI without risking assignments. The most advantageous strategies appear to involve long-term ROI strengths while keeping practical assessment over the Greeks. If in adherence to maintaining control and inclusion of broad time periods, choices with precise spread timing can amplify earning areas within safe contingencies in calendar premiums and realistic market reactive plays.
By favoring these choices based on given data, the specifics focus is on prudently combining the highly efficient, risk-minimal trades with the maximized upside potential from Kalman filtered execution of Greeks in market scope trades.
Calendar Spread Option Strategy #2
Analyzing Calendar Spread Options Strategies for U.S. Gold Corp. (USAU)
In creating a calendar spread for U.S. Gold Corp. (USAU), we seek to optimize profitability while minimizing risk. Because a calendar spread involves selling a put option and buying a call option with different expiration dates, its crucial to analyze the options chain for an optimal risk-reward balance. Below, well focus on five different combinations based on their Greeks and financial viability, covering near-term to long-term periods.
Choice 1: Near-Term Strategy
- Sell Put Option: Strike 7.5, expiration 2024-06-21
- Greek Values: Delta (-0.5703), Gamma (0.0112), Vega (0.0352), Theta (-0.0674), Rho (-0.0055)
- Premium: 1.5
- ROI: 0.021864
-
Profit: 0.032796
-
Buy Call Option: Strike 2.5, expiration 2024-06-21
- Greek Values: Delta (0.5733), Gamma (0.0194), Vega (0.0245), Theta (0.0673), Rho (0.0018)
- Premium: 3.38
- ROI: 4.3433136095
- Profit: 0.146804
Risk and Reward Analysis
Risk: The delta of the put option suggests a moderate probability of the option being in the money, presenting a moderate risk of having shares assigned. The theta and vega values indicate higher sensitivity to time decay and volatility respectively. Reward: Given the ROI and profit figures, this combination offers a quick return, though the modest profit potential might turn some investors away.
Choice 2: Medium-Term Strategy
- Sell Put Option: Strike 7.5, expiration 2024-07-19
- Greek Values: Delta (0.0000076), Gamma (0.0000175), Vega (0.0000743), Theta (0.00000034), Rho (0.0000000627)
- Premium: 0.45
- ROI: 100.0
-
Profit: 0.45
-
Buy Call Option: Strike 2.5, expiration 2024-08-16
- Greek Values: Delta (0.0646), Gamma (0.0125), Vega (0.1920), Theta (0.0053), Rho (0.0005)
- Premium: 3.26
- ROI: 0.822208589
- Profit: 0.026804
Risk and Reward Analysis
Risk: The nearly zero delta value of the put option suggests minimal risk of it being in the money. Theta and vega values imply its less sensitive to both time decay and volatility. Reward: This strategy provides a higher ROI and higher profit due to the low premium of the call option and the minimal sensitivity of the put's Greeks.
Choice 3: Intermediate Strategy
- Sell Put Option: Strike 7.5, expiration 2024-08-16
- Greek Values: Delta (0.0006352), Gamma (0.0005155), Vega (0.0053), Theta (0.0000320), Rho (0.0000071)
- Premium: 0.4
- ROI: 100.0
-
Profit: 0.4
-
Buy Call Option: Strike 5.0, expiration 2024-07-19
- Greek Values: Delta (0.000751), Gamma (0.0012683), Vega (0.00534), Theta (0.0000488), Rho (0.0000061)
- Premium: 1.05
- ROI: 30.1718095238
- Profit: 0.316804
Risk and Reward Analysis
Risk: Low-risk with minimal delta value reduces the chance of shares being assigned. The stable theta and vega values also indicate a low impact from time decay and volatility. Reward: This combination provides an excellent ROI while ensuring limited exposure to risk, balancing both profitability and security.
Choice 4: Long-Term Strategy
- Sell Put Option: Strike 7.5, expiration 2024-11-15
- Greek Values: Delta (3.6904834e-19), Gamma (1.254718949e-18), Vega (1.279460523e-17), Theta (2.044846313e-20), Rho (9.805342203e-21)
- Premium: 0.5
- ROI: 100.0
-
Profit: 0.5
-
Buy Call Option: Strike 2.5, expiration 2024-08-16
- Greek Values: Delta (0.0646), Gamma (0.0125), Vega (0.1920), Theta (0.0053), Rho (0.0005)
- Premium: 3.26
- ROI: 0.822208589
- Profit: 0.026804
Risk and Reward Analysis
Risk: The exceedingly small delta of the put option implies almost zero risk of it being in the money. Relatively stable values for other Greeks further mitigate risks associated with time and volatility. Reward: Despite low short-term ROI, the longer expiration date allows for significant profit accumulation potential over time with low risk.
Choice 5: Very Long-Term Strategy
- Sell Put Option: Strike 5.0, expiration 2024-11-15
- Greek Values: Delta (0.0), Gamma (0.0), Vega (0.0), Theta (0.0), Rho (8.890911294e-16)
- Premium: 1.2
- ROI: 38.9003333333
-
Profit: 0.466804
-
Buy Call Option: Strike 7.5, expiration 2024-08-16
- Greek Values: Delta (0.0006352), Gamma (0.0005155), Vega (0.0053), Theta (0.0000320), Rho (0.0000071)
- Premium: 0.4
- ROI: 100.0
- Profit: 0.4
Risk and Reward Analysis
Risk: The zero delta on the put option eliminates the risk of having shares assigned, whereas balanced Greeks signify low risk from time and volatility decay. Reward: Offers a moderate ROI with high profitability, promising a secure yet lucrative investment over an extended period.
Conclusion
Balancing risk and reward across different expiration dates, the above strategies offer a diversified approach to calendar spread options trading. The near-term options provide quicker returns, while medium to very long-term options assure reduced risk with potentially higher profits. By selecting an optimal combination (Choice 3 or Choice 5), traders can achieve maximum profitability with minimal risk of assignment.
Similar Companies in Gold:
Labrador Gold Corp. (NKOSF), Aurion Resources Ltd. (AIRRF), Puma Exploration Inc. (PUMXF), Golden Star Resources Corp (GLNS), Sokoman Minerals Corp. (SICNF), Dakota Gold Corp. (DC), Paramount Gold Nevada Corp. (PZG), Vista Gold Corp. (VGZ), Almaden Minerals Ltd. (AAU), Osino Resources Corp. (OSIIF), Orezone Gold Corporation (ORZCF), Rio2 Limited (RIOFF), Norsemont Mining Inc. (NRRSF), Newmont Corporation (NEM), Barrick Gold Corporation (GOLD), Agnico Eagle Mines Limited (AEM), Kinross Gold Corporation (KGC), Hecla Mining Company (HL), Royal Gold, Inc. (RGLD), Coeur Mining, Inc. (CDE), Harmony Gold Mining Company Limited (HMY), Sibanye Stillwater Limited (SBSW), Yamana Gold Inc. (AUY)
https://www.proactiveinvestors.com/companies/news/1045287
https://www.proactiveinvestors.com/companies/news/1045287?SNAPI
https://finance.yahoo.com/news/u-gold-corp-announces-4-123000324.html
https://finance.yahoo.com/news/u-gold-corp-annual-general-124700164.html
https://finance.yahoo.com/news/latest-insider-trading-activity-11-133548243.html
https://finance.yahoo.com/news/u-gold-corp-closes-4-124700053.html
https://www.proactiveinvestors.com/companies/news/1046269?SNAPI
https://www.proactiveinvestors.com/companies/news/1046269
https://finance.yahoo.com/news/u-gold-corp-announces-results-124700788.html
https://finance.yahoo.com/news/u-gold-corp-present-smes-124700664.html
https://www.sec.gov/Archives/edgar/data/27093/000149315224010294/form10-q.htm
Copyright © 2024 Tiny Computers (email@tinycomputers.io)
Report ID: 9XFGqS
Cost: $0.58879
https://reports.tinycomputers.io/USAU/USAU-2024-05-24.html Home