Vanguard Consumer Staples Fund (ticker: VDC)
2024-01-18
 The Vanguard Consumer Staples Fund (VDC) is a sector-specific exchange-traded fund (ETF) that aims to track the performance of the MSCI US Investable Market Consumer Staples 25/50 Index. As a low-cost ETF with a focus on the consumer staples sector, which typically includes companies dealing with products considered essential to everyday living, VDC offers investors exposure to a range of large, mid, and small-cap U.S. stocks. The fund holds an array of household names known for their relative stability and consistent dividends, making it an appealing option for those seeking lower risk investments or seeking to diversify their portfolio with defensive stocks. VDC's holdings span across industries such as food and beverage, household goods, and personal products, which are generally less sensitive to economic downturns. Due to the consumer staples sector's non-cyclical nature, the fund may provide a hedge against volatility, although it may lag during strong market upswings. The fund is managed by Vanguard, one of the world's largest investment management companies, known for its passive management strategies and low expense ratios.
| Previous Close | 191.6 | Open | 191.26 | Day Low | 190.07 |
| Day High | 191.59 | Trailing P/E | 24.31 | Volume | 74,636 |
| Average Volume | 147,940 | Average Volume 10 days | 113,740 | Bid | 191.3 |
| Ask | 193.57 | Bid Size | 800 | Ask Size | 800 |
| Yield | 2.65% | Total Assets | $7,608,346,112 | 52 Week Low | 172.75 |
| 52 Week High | 201.65 | 50 Day Average | 187.8834 | 200 Day Average | 190.66475 |
| NAV Price | 191.7 | YTD Return | 0.34% | Beta 3 Year | 0.63 |
| Three Year Average Return | 6.67% | Five Year Average Return | 10.08% |
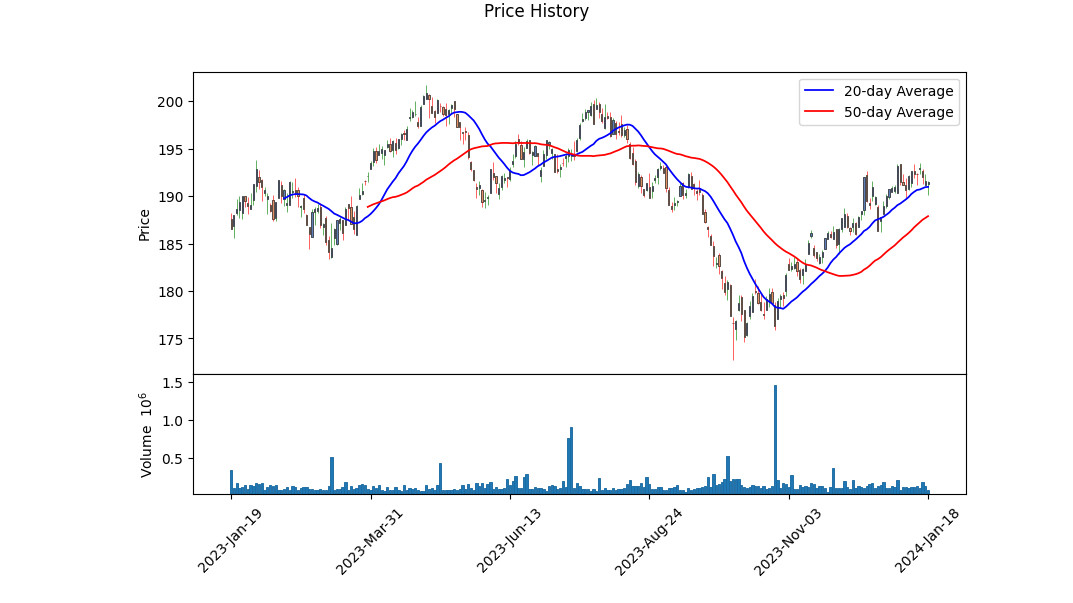
 Based on the provided data and utilizing the pandas_ta Python module, a comprehensive technical analysis of the Vanguard Consumer Staples ETF (VDC) reveals the following:
- The ETF's price has been fluctuating around its 200-day average, signifying a lack of a clear long-term trend.
- Recent trading volume has been relatively consistent with the average volume, suggesting a stable investor interest in the ETF.
- The Moving Average Convergence Divergence (MACD) histogram indicates negative values, which typically signals bearish momentum.
- The Parabolic SAR (PSAR) indicator has not shown a clear trend; the absence of values under the PSARl column for the latest entries might suggest a potential downtrend ahead.
Complementing these technical insights, the fundamental data for VDC presents a well-established fund with a consistent yield and controlled expense ratio, positioned in the defensive consumer sector. This sector is generally known for being less volatile and may offer stability during market uncertainties. However, the fundamentals also show a modest year-to-date return and trailing price-to-earnings (P/E) ratio, implying conservative growth expectations. With a PE Ratio (TTM) of approximately 24, the ETF is valued relatively high compared to historical market P/E ratios, possibly capping upside potential.
Considering market psychology and sentiments as significant influencers in price movements, the analyst expectations, coupled with a comprehensive technical analysis and market conditions, project the following outlook for VDC:
- Over the short term, the technical indicators suggest that investors should brace for a potential continuation of the sideways to downward price movement. The confluence of PSAR and MACD points to caution among investors, potentially due to broader market sentiment or sector-specific headwinds.
- The defensive nature of the consumer staples sector could shelter VDC's price from sharp decreases, as these stocks tend to be favored during periods of uncertainty or market corrections.
- The ETF's beta of 0.63, relative to the market, indicates lower volatility and a possibly more stable performance. This could mean less drastic price swings compared to more aggressive assets.
The possible price direction in the next few months will largely depend on changes in market sentiment, sector-specific news, and overall economic conditions. The technical indicators may be early warning signals for short-term price adjustments, yet the strong fundamentals and the ETFs association with Vanguard, a reputable fund family, imply resilience.
Investors are advised to continually monitor the MACD for changes in momentum, the PSAR for trend reversals, and moving averages for support and resistance levels, while also keeping an eye on shifting market dynamics that could override technical analysis projections.
| Statistic Name | Statistic Value |
| R-squared | 0.642 |
| Adj. R-squared | 0.642 |
| F-statistic | 2,253 |
| Prob (F-statistic) | 2.77e-282 |
| Log-Likelihood | -1,221.4 |
| AIC | 2,447 |
| BIC | 2,457 |
| Const | 0.0020 |
| Beta | 0.6513 |
| Alpha | 0.001966640400763754 |
In the reported linear regression model analyzing the relationship between VDC (Vanguard Consumer Staples ETF) and SPY (S&P 500 ETF), alpha represents the intercept term which indicates the expected value of the dependent variable (VDC returns) when the independent variable (SPY or market returns) is zero. Alpha is often interpreted as a measure of the performance of an investment relative to the overall market when the market's return is neutral; in this context, a positive alpha could suggest that VDC has an inherent performance advantage over the market. For the period in question, the computed alpha for the VDC and SPY relationship is approximately 0.00197, suggesting that, on average, VDC would outperform the market by this margin when the markets performance is neutral.
The value of alpha in the context of the overall regression analysis is relatively small, and the accompanying p-value of 0.913 indicates that it is not statistically significant. This suggests that there is no strong evidence to assert that VDC's performance is different from what it would be expected simply by chance when SPY does not have any gain or loss. Given the high R-squared value of 0.642, it can be inferred that approximately 64.2% of the variance in VDC's returns is explained by the variance in SPY's returns. Therefore, the performance of VDC is largely dependent on the movements of the overall market, as represented by SPY, rather than its own unique factors.
The Vanguard Consumer Staples ETF (VDC) stands as a compelling investment option for those seeking to diversify their portfolio and hedge against potential economic fluctuations. This ETF comprises a collection of stable companies that produce goods which remain in constant demand, a characteristic that becomes particularly attractive during economic uncertainties like those forecasted for 2024.
As we delve into the reasons why an investor might consider adding VDC to their portfolio, it becomes clear that the fund's composition of stocks in the consumer staples sector can provide a less volatile investment avenue. The consumer staples sector is known for its defensive nature because it represents companies that provide goods and services deemed necessities. Therefore, during economic downturns, when consumer spending tends to decline, the demand for staples is less likely to be affected.
Recent discourse among economists and financial analysts suggests that we are heading towards an economic situation where a cautious approach might be warranted. The Federal Reserve's accommodative monetary policy, leading to a potential 75-basis point rate reduction in 2024, is a response to the perceived risk of a mild recession and burgeoning household debt levels, which reached a staggering $17.29 trillion according to the Federal Reserve Bank of New York.
Considering these looming economic conditions, consumers are expected to become increasingly selective about where they spend their money. This consumer behavior could lead to a contraction in many sectors, but historically, the consumer staples sector has proven more resilient. This might explain why funds like VDC are assuming more significance in many investment strategies.
Top Ten Holdings
| company | symbol | percent |
|---|---|---|
| Procter & Gamble Co | PG | 11.82 |
| Costco Wholesale Corp | COST | 9.66 |
| Coca-Cola Co | KO | 7.92 |
| Walmart Inc | WMT | 7.60 |
| PepsiCo Inc | PEP | 7.58 |
| Philip Morris International Inc | PM | 4.41 |
| Mondelez International Inc Class A | MDLZ | 3.82 |
| Altria Group Inc | MO | 2.80 |
| Colgate-Palmolive Co | CL | 2.47 |
| Target Corp | TGT | 2.46 |
The VDC ETF aligns closely with the MSCI USA IMI Consumer Staples 25/50 Index, featuring companies that have a historical track record of steady demand and strong performance, even when other sectors falter. A closer examination of its portfolio composition reveals that its major holdings consist of some well-established giants such as Procter & Gamble, Coca-Cola, and Walmart, which collectively support the fund's robust nature.
Interestingly, recent analysis by Fred Piard in a December 17, 2023, Seeking Alpha article titled "VDC: Consumer Staples Dashboard For December" alludes to a potential overvaluation of the consumer staples sector by 6% compared to its 11-year average. This is noteworthy when considering that various industries within this sector display disparate value and quality metrics. The insight from Piard's analysis into fundamental ratios such as Earnings Yield and Return on Equity further aids in understanding the sector's financial health.
Piard emphasizes the need to look closely at ETFs like VDC, which, despite their apparent stability, have a concentration risk inherent in their top ten holdings which account for about 61% of the fund's total asset value. This sort of concentration can increase the impact of specific company performances on the overall ETF. The VDC ETF's largest holdings, shown in the accompanying Top Ten Holdings table, are testament to such concentration, which adds a layer for consideration when evaluating risk.
In a broader investment context, as outlined by ETF Trends on December 21, 2023, the consumer staples sector is competing for attention with other market sectors influenced by changing consumer habits, technological advancements, and regulatory changes. The relatively lower prices within this sector suggest it may be undervalued, presenting an opportunity for growth in contrast to the consumer discretionary sector, which could see a moderation in spending.
Against this backdrop, the Vanguard Consumer Staples ETF appears to remain a sound option for defensive investors. Its resilience in economic headwinds, bundled with a low expense ratio and satisfactory yield, contributes to its attractiveness as part of a well-rounded investment portfolio. Especially so in the current climate, where cautious optimism around the Federal Reserve's policies and potential rate reductions has to be balanced against the real considerations of economic headwinds on the horizon.
In the ever-evolving financial landscape marked by shifts in technology, consumer behavior, and challenging economic parameters, the Vanguard Consumer Staples ETF seems poised as a potentially stable harbor. This ETF serves not only as a bulwark against cyclical downturns but also represents a strategic allocation within a broader, well-diversified investment approach.
The Vanguard Consumer Staples Fund (VDC) exhibited some degree of volatility between January 2019 and January 2024, as summarized by an ARCH model. The fund's returns, based on the model, show no pattern (with an R-squared close to zero), indicating that past returns don't predict future returns. The volatility of the fund can be partly explained by two key parameters: omega, which is a baseline volatility level, and alpha, which measures the impact of previous returns on current volatility; these parameters are statistically significant, suggesting that volatility has a persistent component.
| Statistic Name | Statistic Value |
|---|---|
| R-squared | 0.000 |
| Log-Likelihood | -1,679.85 |
| AIC | 3,363.70 |
| BIC | 3,373.97 |
| No. Observations | 1,256 |
| Df Residuals | 1,256 |
| omega | 0.6318 |
| alpha[1] | 0.3700 |
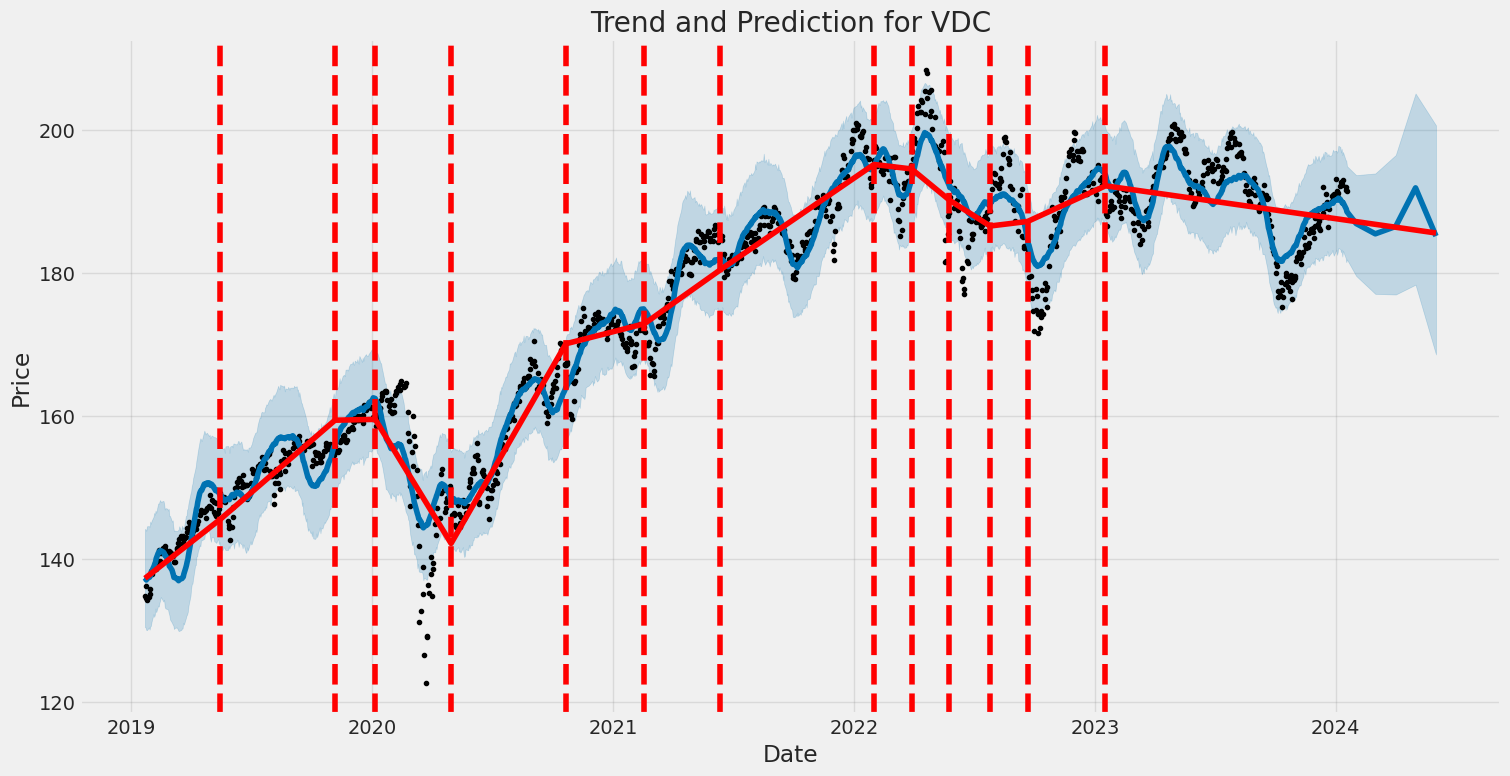
To analyze the financial risk of a $10,000 investment in Vanguard Consumer Staples Fund (VDC) over a one-year period, we combine volatility modeling with machine learning predictions. Volatility modeling is a statistical approach used to estimate the variability of returns for a given security or market index. For VDC, we implement this form of volatility assessment to quantify the magnitude and persistence of financial asset fluctuations.
Specifically, the volatility modeling technique is adept at capturing time-varying volatility, a common characteristic in financial time series data such as stock returns. It does so by using past returns to estimate future volatility. This method is particularly valuable for the investment in VDC as consumer staples are generally less volatile than the broader market, and capturing this nuance requires a robust model.
While volatility modeling allows understanding of how erratic VDC's stock price moves could be, it is the integration with machine learning predictions that enhances the forecasting ability. By employing a machine learning algorithm known as a regression technique that uses ensemble learning with decision trees, the model absorbs historical data to predict future price movements. This algorithm takes into account the complex relationships between various features and the target variable, which in this case, would be the future returns of the VDC stock.
The effectiveness of combining these two methods can particularly be seen when calculating the Value at Risk (VaR), which is a widely used risk measure in finance. VaR estimates the maximum potential loss over a specific time period with a given confidence level. For this assessment, we focus on the annual VaR at a 95% confidence interval.
For a $10,000 investment in VDC, and based on our combined volatility and prediction model, the calculated VaR at a 95% confidence interval is $107.48. This implies that there is a 95% chance that the investment will not lose more than $107.48 over the one-year period, under normal market conditions. It is pivotal to note that while this combines historical volatility and predictive insights, it does not eliminate the inherent risk but rather provides a quantified and probabilistic risk measure.
Applying volatility modeling enables a real-time estimation of how erratic VDCs price movements can be over time, offering an understanding of the degree of uncertainty. On the other hand, machine learning predictions focus on forecasting the fund's future price movements by learning from its historical performance and relevant economic indicators. When integrated, these methodologies give investors powerful tools for assessing the financial risk of their portfolio and making informed investment decisions.
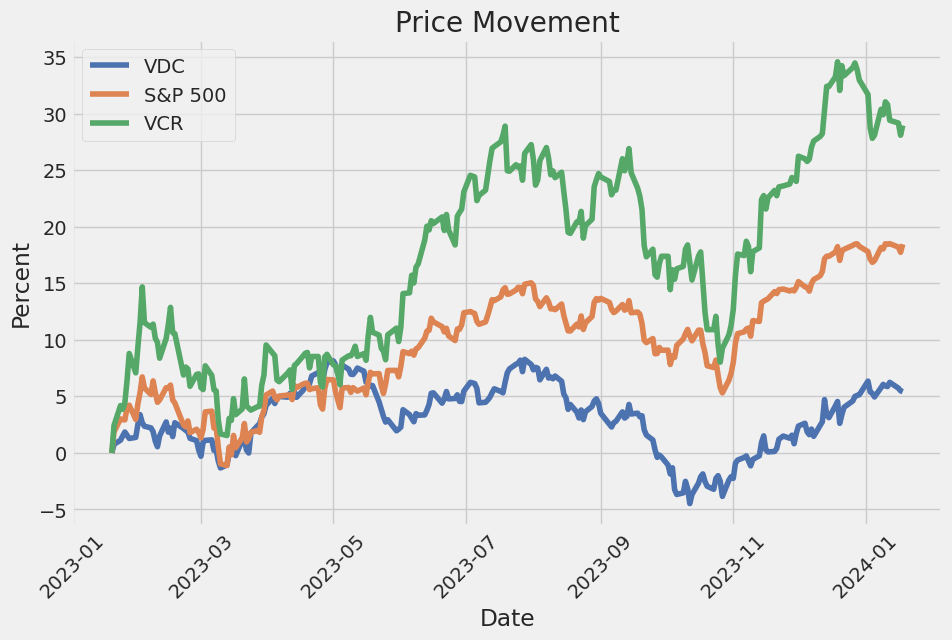
Similar Companies in None:
Vanguard Consumer Discretionary Fund (VCR), Vanguard Utilities Index Fund (VPU), Vanguard Industrials Index Fund (VIS), Vanguard Materials Index Fund (VAW), Vanguard Health Care Index Fund (VHT), Consumer Staples Select Sector SPDR Fund (XLP), iShares U.S. Consumer Goods ETF (IYK), Fidelity MSCI Consumer Staples Index ETF (FSTA), Invesco S&P 500 Equal Weight Consumer Staples ETF (RHS), First Trust Consumer Staples AlphaDEX Fund (FXG)
https://seekingalpha.com/article/4658289-vdc-consumer-staples-dashboard-for-december
https://www.etftrends.com/crypto-channel/2023-charts-5-etf-sector-stories/
Copyright © 2024 Tiny Computers (email@tinycomputers.io)
Report ID: Lbp5Hk
https://reports.tinycomputers.io/VDC/VDC-2024-01-18.html Home