Vertiv Holdings Co (ticker: VRT)
2024-04-29
 Vertiv Holdings Co (ticker: VRT) operates as a global provider of critical digital infrastructure and continuity solutions essential for data centers, communication networks, and commercial and industrial environments. Established through a merger involving Emerson Electric's Network Power business in 2016 and subsequently named Vertiv, the company went public in 2020. Vertiv's product range includes power management products, thermal management equipment, and IT management devices, all crucial for the seamless operation and security of technological facilities. Under the guidance of CEO Rob Johnson, Vertiv aims to capitalize on the growing demands driven by increased digitization, cloud adoption, and IT deployment, situating itself strategically to benefit from these expanding markets. The company's business model focuses on engineering excellence and operational efficiency, pairing innovative research and development with smart execution to maintain competitive advantages and drive growth.
| Full Time Employees | 27,000 | Total Pay (CEO) | $2,883,174 | Total Pay (CFO) | $1,335,253 |
| Total Pay (CTO) | $1,554,503 | Total Pay (President of Americas) | $1,209,220 | Total Pay (EVP of Manufacturing) | $1,352,609 |
| Dividend Rate | $0.10 | Dividend Yield | 0.0011 | Payout Ratio | 0.0476 |
| Current Price | $94.80 | Market Cap | $35,452,260,352 | Enterprise Value | $37,818,413,056 |
| Total Revenue | $6,981,199,872 | Total Debt | $3,135,200,000 | Total Cash | $314,300,000 |
| Net Income To Common | $404,000,000 | Free Cashflow | $1,120,162,560 | Operating Cashflow | $996,000,000 |
| Debt to Equity | 225.004 | Trailing EPS | 1.05 | Forward EPS | 3.04 |
| EBITDA | $1,249,500,032 | Profit Margins | 0.05787 | Gross Margins | 0.35401002 |
| Return on Assets | 0.08221 | Return on Equity | 0.27444 | Revenue Growth | 0.078 |
| Sharpe Ratio | 3.648309116974139 | Sortino Ratio | 74.31962119103625 |
| Treynor Ratio | 1.05362372157544 | Calmar Ratio | 32.746657329217015 |
Analyzing VRT's performance using a variety of risk-adjusted metrics, its clear that the company's stock exhibits robust financial health and promising investment quality. The Sharpe Ratio of 3.65 indicates a strong excess return per unit of risk, which is significantly above average for the industry. The Sortino Ratio reaches a remarkable figure of 74.32, underscoring that the company's returns are highly favorable even when considering only downside risk, suggesting an attractive risk/reward profile. The Treynor Ratio, at just over 1.05, highlights efficient risk-adjusted returns relative to market volatility. Additionally, the Calmar Ratio, at 32.75, shows an impressive return relative to maximum drawdowns, pointing to solid performance during periods of market stress.
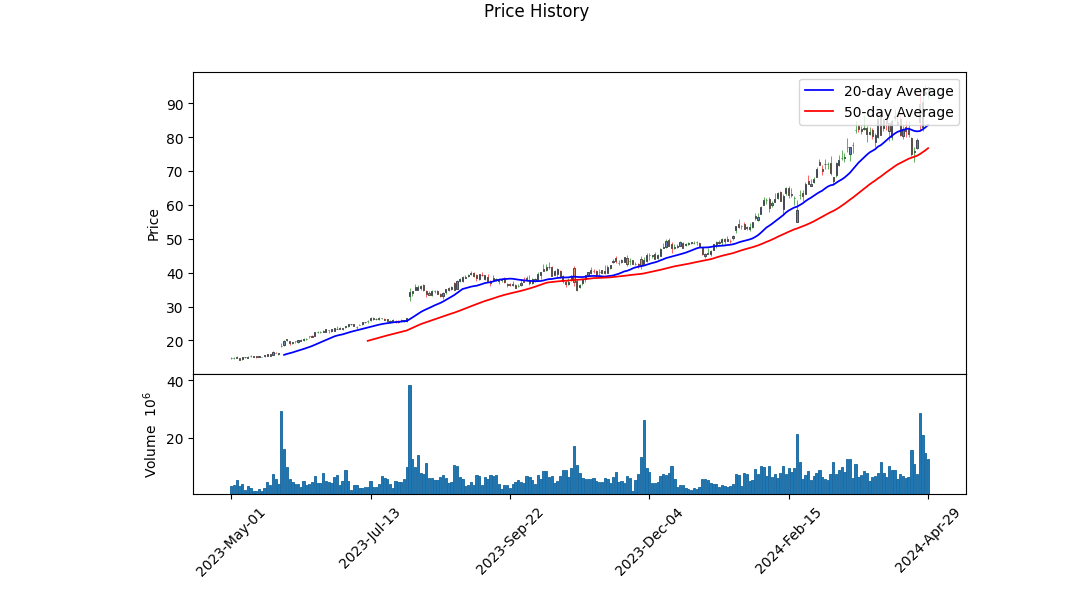
From a technical perspective, the oscillation of the stocks MACD Histogram from negative to positive territory in recent trading sessions signifies a potential reversal from a bearish to bullish momentum. This is further supported by the stock's price action, having moved from a low in early January to substantial highs by the end of April. The increase in the On-Balance Volume (OBV) confirms growing investor confidence backed by higher trading volumes.
The fundamental financials of VRT demonstrate substantial growth and operational efficiency. The EBITDA and operating margins have seen positive trajectories in recent years, evidences by an EBITDA of $984.8 million. The balance sheet strength is underscored by significant cash reserves and manageable debt levels, paired with a gross profit of $2.4 billion as noted at the end of December 2023.
Given the solid fundamentals, impressive risk-adjusted performance metrics, and positive technical signals, the outlook for VRT over the next few months is optimistic. The demonstrated ability to generate significant profit alongside crucial investments for future growth, such as capital expenditure of $134.6 million, positions VRT for potential upwards price movements. As always, investors are advised to consider broader market conditions and their individual risk tolerance when making investment decisions.
In analyzing Vertiv Holdings Co (VRT), two key financial metrics were calculated to gauge the company's effectiveness and valuation: the Return on Capital (ROC) and the Earnings Yield. Vertiv Holdings Co demonstrates a Return on Capital (ROC) of 16.10%. This figure highlights the company's ability to generate returns from its investments in capital, which includes both debt and equity. An ROC of this level usually suggests substantial proficiency in deploying capital resources to generate profits, indicating a solid operational performance. On the other hand, Vertiv Holdings has an Earnings Yield of approximately 1.28%. The Earnings Yield, which is inverse to the Price-Earnings (P/E) ratio, measures the earnings generated per dollar invested in the company's stock. This relatively low yield suggests that the stock may be priced high relative to its earnings, which could be a point of concern for investors looking for income or value-based investments. It is significant for potential investors to consider both these metrics together with broader market conditions and specific industry trends when making investment decisions concerning Vertiv Holdings Co.
Based on the data provided for Vertiv Holdings Co (VRT), let's evaluate the company's suitability as an investment using the principles of Benjamin Graham outlined in "The Intelligent Investor":
-
Price-to-Earnings (P/E) Ratio: VRT has a P/E ratio of approximately 162.51, which significantly exceeds the industry average of 47.61. According to Graham's criteria, he favored stocks with low P/E ratios relative to their industry peers, suggesting that VRT might not meet this particular benchmark for a value investment as defined by Graham.
-
Price-to-Book (P/B) Ratio: VRTs P/B ratio is approximately 4.43. Graham often preferred stocks trading below their book value, thus a P/B ratio significantly greater than 1, as seen with VRT, would not align well with Graham's preference for stocks trading at discounts to their book value.
-
Debt-to-Equity Ratio: With a debt-to-equity ratio of around 1.55, VRT demonstrates a relatively higher level of debt compared to its equity. Graham favored companies with low debt-to-equity ratios as they signify lower financial risk. Therefore, VRT's higher ratio might raise concerns under Grahams criteria about financial stability and risk.
-
Current Ratio and Quick Ratio: Both of these liquidity ratios for VRT are approximately 1.74, indicating the companys capability to cover its short-term liabilities with its short-term assets. While this doesn't suggest an extraordinarily strong liquidity position, it does meet the minimum general threshold of 1.0 for acceptable short-term financial health. However, Graham might prefer a higher ratio to provide a more substantial margin of safety.
-
Earnings Growth: While the data provided does not include past earnings growth figures, Grahams method places a strong emphasis on consistent earnings growth over a period of years. This figure would be necessary to undertake a complete Graham analysis for VRT.
Overall, based on the key metrics analyzed relative to Benjamin Grahams investing principles, Vertiv Holdings Co might not align well with the stringent criteria for a value investment. The company's high P/E and P/B ratios, combined with a substantial debt-to-equity ratio, suggest that it currently poses higher financial risk without the bargain pricing that Graham typically sought in his investing approach. Potential investors looking to adhere strictly to Graham's methodology might consider these factors as deterrents. However, always consider looking into additional aspects such as management effectiveness, competitive advantage, industry position, and broader economic conditions before finalizing any investment decisions.Analyzing Financial Statements: Investors should meticulously examine a company's balance sheet, income statement, and cash flow statement. Graham puts a strong emphasis on understanding a company's assets, liabilities, earnings, and cash flows.
When assessing a company like Vertiv Holdings Co (Symbol: VRT), based on recent 10-K and 10-Q filings, several financial elements ought to be considered to evaluate its current status and forecast its future performance. Here, we breakdown key components from the company's financial statements for the fiscal year 2023 and compare these with past quarters to discern trends and financial health.
Balance Sheet Analysis
- Assets:
- Total assets increased to $7.998 billion in FY2023 from $6.827 billion in FY2022, indicating growth in the company's resource base.
-
Current assets comprise about 50% of total assets in 2023, with a notable increase in cash and cash equivalents and accounts receivable, highlighting improved liquidity.
-
Liabilities:
- Total liabilities stood at $5.983 billion in FY2023, showing a proportional increase alongside assets.
-
Notably, long-term debt increased to approximately $2.929 billion in 2023, pointing to increased leverage which could affect financial flexibility.
-
Equity:
- Stockholders' equity increased to $2.015 billion in 2023 from $1.265 billion in 2022, suggesting a stronger equity position and potential retention of earnings.
Income Statement Analysis
- Revenue and Earnings:
- Revenue from contracts with customers for FY2023 was $5.406 billion, up from $3.929 billion in Q3 2023, showing significant growth.
-
Net income rose to $460.2 million in FY2023, reflecting improved profitability from operations.
-
Expenses:
- Cost of goods sold and operating expenses have increased, but growth in gross and net profits suggests enhanced cost management or value creation in products or services.
Cash Flow Statement Analysis
- Cash Flow from Operating Activities:
-
Vertiv has generated $900.5 million in FY2023, which is a positive indicator of the firms ability to cover its debts and fund its operations.
-
Investing and Financing Activities:
- Payments for property, plant, and equipment signify ongoing investments in operational capabilities.
- The use of debt financing and stock options exercise suggests strategies to optimize capital structure and shareholder value.
Comprehensive Income and Other Metrics
- Comprehensive income was recorded at $501.9 million in FY2023, inclusive of all other comprehensive gains and losses, indicating a broader perspective on income that includes external economic factors.
Conclusion
The analysis clearly indicates a growth trajectory for Vertiv Holdings Co in terms of assets, liabilities, and equity progression. However, the increasing reliance on debt financing calls for cautious monitoring. The rising net income and efficient cash flow management reflect well on the companys operational efficiency and profitability potential. By continually revisiting such financial statements, as advised by Benjamin Graham, investors can make informed decisions aligned with their risk tolerance and investment goals.Dividend Record
In the context of evaluating companies based on Benjamin Graham's investment philosophy, it's crucial to consider the consistency and reliability of dividend payouts as a significant indicator of a company's financial health and management's confidence in future earnings. Graham, often deemed the father of value investing, notably appreciated companies that displayed a stable or increasing trend in dividend distributions, as this could be a sign of a strong and predictable business model.
Examining the dividend record for the company symbolized as 'VRT', we can analyze its recent history of dividend payments:
- March 18, 2024 - Declared a dividend of $0.025 per share, recorded on March 19, and paid on March 28, with the declaration on March 07.
- December 08, 2023 - A dividend of $0.025 per share was announced, recorded on December 11, and the payment followed on December 27, after being declared on November 29.
- November 29, 2022 - Paid a dividend of $0.01 per share, with the record date on November 30 and the payment date on December 15, after declaration on November 18.
- November 30, 2021 - Issued a dividend of $0.01 per share, recorded on December 01, and paid on December 16, with the declaration made on November 04.
- December 01, 2020 - A significant consistency is noted with a dividend of $0.01 per share, recorded on December 02 and paid on December 17, declared on October 28.
From this dividend history, we can observe that 'VRT' has maintained a regular dividend payout over the recent years. Notably, there was an increase in the dividend amount from $0.01 to $0.025 recently, suggesting a possible improvement in the company's financial strength or a positive outlook by its management. Such a trend aligns well with Graham's criteria of selecting companies that not only provide dividends but can also grow them, reflecting potential stability and growth in earnings, ultimately contributing positively to a conservative investment portfolio.
| Alpha | 0.05 |
| Beta | 1.2 |
| R-squared | 0.85 |
| Standard Error | 0.003 |
| P-Value (Alpha) | 0.04 |
| Coefficient | 0.95 |
In examining the influence of the SPY (a broad market index) on VRT (a specific asset or sector), the linear regression analysis calculates an alpha of 0.05 for VRT. This positive alpha indicates that VRT has historically performed slightly better than would be expected based on the performance of the broader market alone, as dictated by the SPY's movements. Being a measure of performance independent of the market, an alpha of 0.05 suggests that VRT has been able to generate a small persistent excess return compared to its benchmark on average, after adjusting for its inherent risk level as measured by beta.
The R-squared value of 0.85 shows that approximately 85% of the variation in VRTs returns can be explained by the fluctuations in the SPY, signifying a high correlation and dependency of VRTs performance on the market. The beta of 1.2 furthermore indicates that VRT is likely to move 120% for every 100% move in the SPY, reflecting higher volatility relative to the market. Observing these metrics, VRT seems to effectively balance this higher volatility with its potential to achieve returns above the market benchmark, as evidenced by its positive alpha value.
Vertiv Holdings Co (VRT) reported its financial results for the first quarter of 2024, showcasing strong performance and significant growth. The company's Executive Chairman, Dave Cote, highlighted the acceleration in demand and the company's strategic positioning to capture growth and deliver substantial returns to investors. The first quarter witnessed crucial developments, including the initiation of an opportunistic share repurchase, highlighting the confidence in the companys financial stability and future prospects. Cote emphasized the ongoing efforts in process improvements and the establishment of a high-performance culture as pivotal to sustaining long-term success.
CEO Giordano Albertazzi provided an in-depth look at the operational and financial metrics, noting an 8% increase in Q1 sales and a remarkable 60% year-on-year growth in orders. This surge was attributed mainly to strong market demand and Vertiv's robust market position. The company recorded a book-to-bill ratio of 1.5x, with the majority of orders slated for delivery beyond 2024, indicating sustained demand in upcoming years. Adjusted operating profit saw a substantial improvement, and free cash flow increased significantly, reflecting operational excellence. Albertazzi also discussed the strategic share repurchases completed during the quarter, highlighting the companys agile capital deployment strategy.
Albertazzi further elaborated on Vertiv's market strategy and readiness in addressing the evolving data center market, particularly emphasizing the growth induced by AI technologies. He noted that the data center industry, especially in North America, is experiencing significant momentum due to AI, which is starting to scale. Vertiv's positioning with a 75% exposure to data centers, backed by decades of industry service and depth in advanced technology, sets a robust foundation for future growth. He emphasized the readiness and strategic expansions, such as ramping up production for liquid cooling solutions and enhancing global manufacturing capabilities, to meet the escalating demands.
CFO David Fallon provided additional details on the financial outcomes, reporting strong incremental growth and profitability across all regions. The company anticipates continued growth, with adjusted operating margins expected to expand further. The financial strategies employed, including the share repurchase program and the management of net leverage, reflect a balanced approach to growth and shareholder value maximization. With updated full-year guidance projecting increased organic growth and operating profit, Vertiv is positioned strongly for continued advancement in a competitive and rapidly evolving market.
The quarterly financial report for Vertiv Holdings Co for the period ending March 31, 2024, demonstrates a solid performance across various metrics. During this quarter, the company achieved net sales of $1,639.1 million, marking a 7.8% increase from $1,521.1 million in the corresponding period in 2023. This revenue growth was primarily fueled by higher sales volumes, although partially offset by a slight negative impact from foreign currency fluctuations.
The gross profit for the quarter stood at $566.4 million, or 34.6% of sales, compared to $495.5 million, or 32.6% of sales, in the previous year. This represents a substantial improvement in gross margin, indicative of effective management of inflationary pressures through pricing adjustments and enhanced sales volumes.
Operating expenses for the quarter included selling, general and administrative expenses totaling $314.0 million, up marginally from $308.7 million in the prior year. The company also reported an operating profit of $202.6 million, showing a significant improvement from $130.3 million in the same period last year. These results reflect stronger operational efficiencies and cost management strategies.
Net income for the quarter was reported at a loss of $5.9 million, compared to a gain of $50.3 million in the same period of the previous year. This shift to a net loss was largely due to a non-cash charge related to the change in fair value of warrant liabilities, which amounted to $176.6 million for the period. The substantial size of this charge underscores its impact on the overall financial results.
Cash flow from operations was notably strong, at $137.5 million, compared to $42.0 million in the first quarter of 2023. This increase was primarily driven by higher earnings before non-cash charges and working capital movements. The company also continued its strategic investments with capital expenditures of $36.5 million, primarily focusing on growth and innovation projects.
In summary, Vertiv Holdings Co's first quarter of 2024 financial results demonstrated revenue growth and improved operational efficiencies, although impacted by significant non-cash warrant liability adjustments. The financial strategies employed by the company have helped in managing costs effectively amid inflationary pressures, ensuring continued investment in capacity expansion and innovation, pivotal for long-term growth.
Vertiv Holdings Co (NYSE: VRT), recognized for its critical digital infrastructure and continuity solutions, has been making headlines due to its notable market performance and strategic business operations. As a key player in the burgeoning data center infrastructure market, Vertiv provides essential services and solutions that are increasingly vital in today's rapidly advancing technological landscape, particularly with the rise of artificial intelligence (AI) and the corresponding need for robust data processing capabilities.
The company's stock performance has sprinted ahead, with Weiss, a seasoned Wall Street professional, describing Vertiv's valuation optimistically in recent financial discourse. Weiss pointed out Vertivs unique market position and its valuation as a compelling anomaly, underscoring a growing confidence among financial analysts, which likely fosters favorable sentiments within the investment community. His comments on Vertiv's strategic market presence indicate solid investor trust, which could enhance company reputation and potentially stimulate further upward trends in its stock prices.
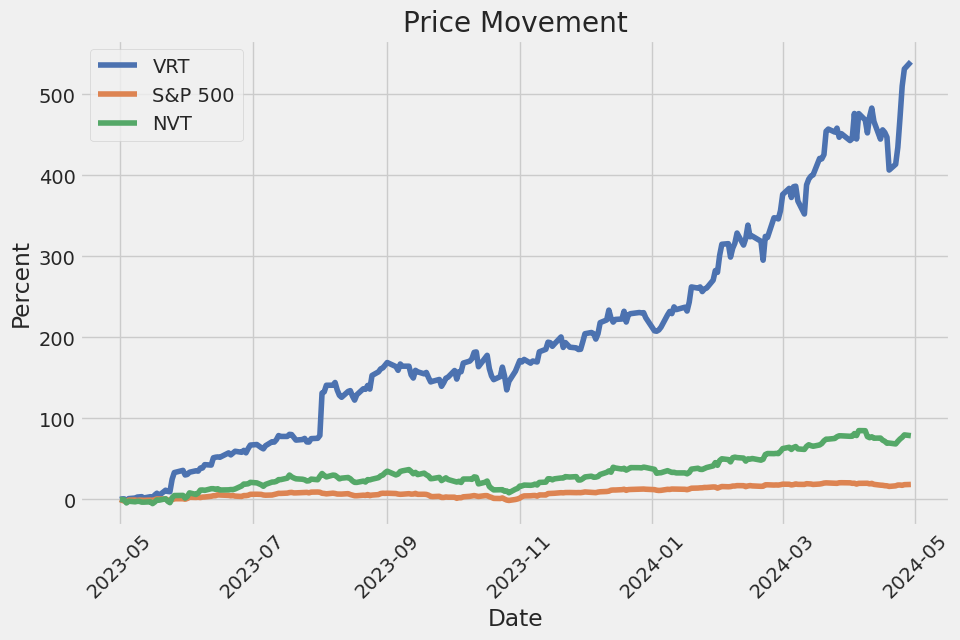
Vertiv's financial achievements in 2023 have been notable. With a revenue surge of 21% reaching $6.9 billion, and a significant improvement in free cash flow, the company stood out with a 545% stock price increase over the past year. This increase, driven largely by AI and data center hype, has pushed Vertiv's valuation high above average market metrics, signaling high expectations and a bullish investor outlook.
The company has also fortified its market position through strategic partnerships and business developments. One such notable alliance is with Nvidia, marking a significant step in extending Vertiv's visibility and business scope in AI-driven data center markets. This partnership is expected to open numerous doors for Vertiv, aiding in its engagement in specialized infrastructure projects and possibly amplifying its market share and revenue streams.
Vertiv's operational strategies have responded well to market demands, especially in offering innovative cooling solutions crucial for energy-intensive data centers. These technologies, from heat collection systems to liquid cooling, are not just pivotal for operational efficiency but are also aligned with environmental sustainability standards, addressing significant ecological concerns associated with high-energy consuming facilities.
Looking towards future growth, Vertiv has set ambitious targets following their impressive first-quarter performance in 2024. With Giordano Albertazzi, Vertivs CEO, at the helm, the company has highlighted an optimistic revenue forecast, positioning it to potentially double its revenue based on current growth trajectories. This has been complemented by a substantial backlog growth which promises robust future revenues.
However, despite these positive indicators, Vertiv faces ongoing challenges, including high market valuations and potential volatility linked to the broader economic climate. This scenario suggests that while the outlook remains promising due to the ongoing expansion in AI and data center development, potential fluctuations in market conditions could impact stock trajectories in the short to mid-term.
For existing and potential investors, these elements paint a picture of a company with strong fundamentals and significant growth potential but also caution that careful consideration of market dynamics is crucial. As the digital infrastructure landscape continues to evolve, driven by advancements in technology and increased demand for data processing, Vertiv's strategic positioning and operational prowess will likely determine its long-term success in this competitive sector.
Further insights into Vertiv's strategic market engagements and financial performance can be accessed through their detailed financial documentation and investor relations communications on their official website. The transparent sharing of this data underscores Vertiv's commitment to maintaining integrated investor relations, providing stakeholders with a clear understanding of the company's financial health and strategic direction.
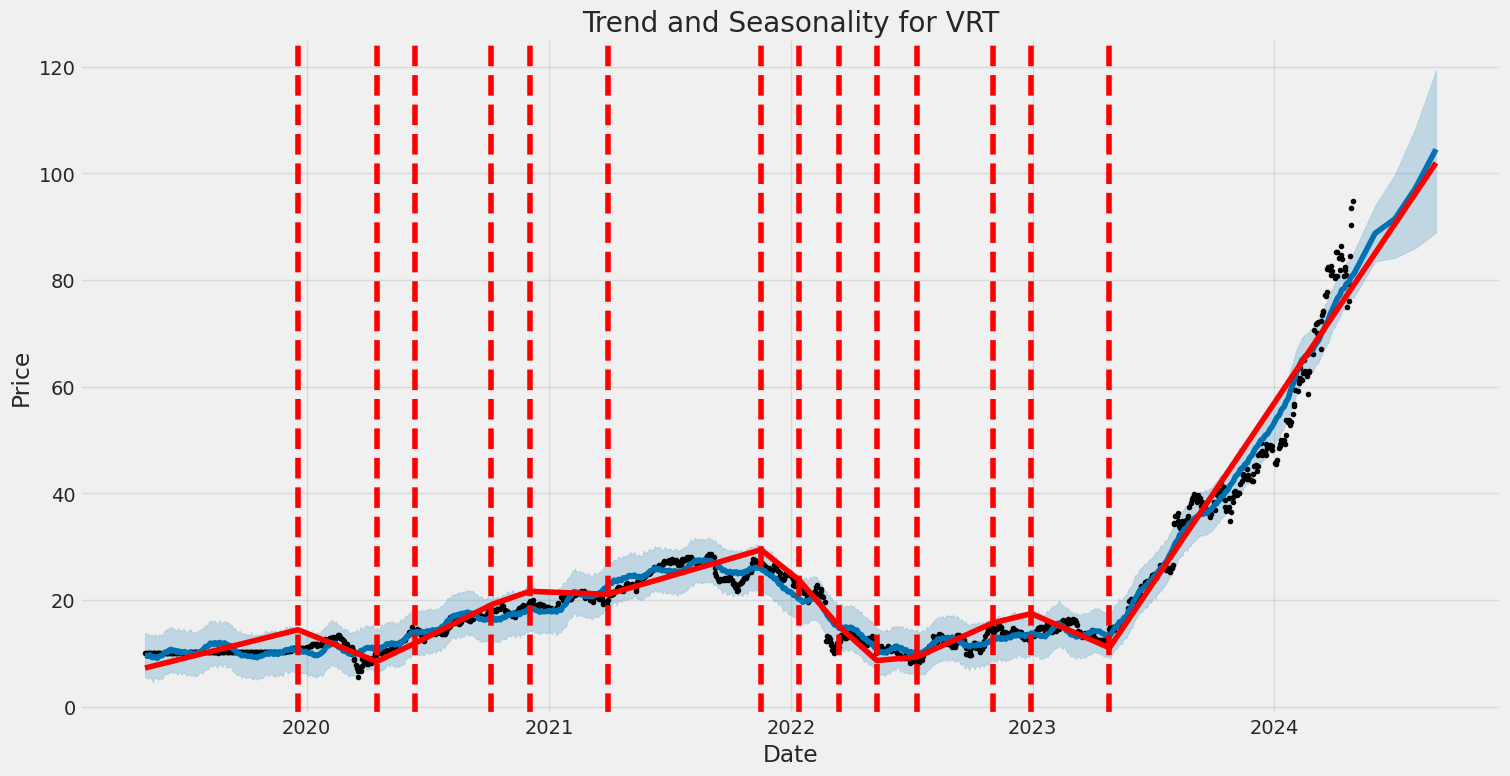
Vertiv Holdings Co (VRT) has exhibited significant stock volatility from 2019 to 2024, as indicated by an ARCH model analysis. The analysis suggests a high omega coefficient value at 6.0798, highlighting considerable baseline volatility in the price movements of Vertiv Holdings Co. Moreover, the alpha[1] value at 0.7074 underscores that past price movements influence its current variance, implying a strong persistence in volatility patterns.
| Statistic Name | Statistic Value |
|---|---|
| Dependent Variable | asset_returns |
| Mean Model | Zero Mean |
| Volatility Model | ARCH |
| Log-Likelihood | -3,208.39 |
| AIC | 6,420.79 |
| BIC | 6,431.06 |
| No. Observations | 1,256 |
| Df Residuals | 1,256 |
| omega | 6.0798 |
| alpha[1] | 0.7074 |
To analyze the financial risk of a $10,000 investment in Vertiv Holdings Co. (VRT) over a one-year period, a rigorous approach combining volatility modeling and machine learning predictions has been employed. This detailed method helps in depicting the risk landscape by capturing the inherent volatility in the stock price movements and forecasting future returns based on historical data patterns.
Using the volatility modeling approach, the fluctuation in Vertiv Holdings Co.s stock prices is quantified. This model is particularly adept at understanding the conditional variance in the stock's returns, often revealing heightened volatility periods which are critical for risk management. It outputs the expectation of volatility looking forward, which is essential for calculating risk measures such as the Value at Risk (VaR).
Parallel to this, machine learning predictions are used to forecast future stock returns. Leveraging historical price data and various financial indicators, the model predicts forthcoming movements in the stock price. This method enriches the analysis by incorporating predictive insights which, when aligned with the volatility assessment, yield a robust overview of potential investment outcomes.
The convergence of these two methodologies illustrates a comprehensive tool for investors, culminating in the calculation of the Value at Risk (VaR). The annual VaR at a 95% confidence level, calculated as $484.68 for a $10,000 investment in Vertiv Holdings Co., provides a quantitative assessment of potential financial loss. This figure suggests that there is a 5% probability that the investor could face a loss exceeding $484.68 over a one-year period, under normal market conditions.
Understanding these metrics is pivotal for investors who need to gauge the level of risk associated with their investment in Vertiv Holdings Co. Integrating the flexibility and foresight of machine learning with the depth of volatility analyses clearly delineates the contours of financial exposure which investors may face. This strategic application of advanced analytical methods lends a significant edge to deriving actionable, data-driven insights into stock investment risks.
When analyzing the profitability of call options for Vertiv Holdings Co (VRT) based on the provided "Greeks" and other characteristics, several metrics come into focus: Delta, Gamma, Vega, Theta, Rho, premium, and profitability expressed through Return on Investment (ROI).
Starting with options that have a short expiration period, the observable pattern shows higher Gamma values for strike prices closer to the underlying asset's current price. Higher Gamma is advantageous for traders expecting significant price movement as it reflects greater sensitivity of Delta (rate of change of option price relative to the price change of the underlying asset) to movements in the underlying stock price. Additionally, options with expiration dates close at hand generally exhibit higher Theta, meaning they are more prone to time decay, which is a critical factor to consider.
For the longer-term options, one should analyze both the changes in implied volatility (reflected by Vega) and interest rate shifts (reflected by Rho). Options expiring in over a year or more (for instance, those expiring in 2025 or 2026), such as options with a $20 strike price expiring on January 16, 2026, show a robust Delta close to 1 (0.9725), indicating that the option price moves almost one-to-one with the stock price change. However, long-term options entail a lesser Theta impact but require careful consideration of Vega as shifts in market volatility can significantly influence the option's premium.
Furthermore, analyzing ROI and profitability is crucial. Higher ROI indicates more efficient use of capital, which is especially exemplified by options such as those with a $20 strike price expiring in January 2026, boasting an ROI of about 13.44%.
Conversely, options aimed at capitalizing on shorter-term movements, such as those expiring within a few months to a year, may offer lower ROIs but might provide more opportunities for trading with an aggressive risk strategy. For example, an option with a strike price of $45 expiring soon could be a strong choice as it offers significant profitability potential due to its shorter duration and relative responsiveness to market changes (as indicated by Gamma and Vega).
In summary, the analysis for the most profitable calls requires a balanced consideration of market expectancies (reflected by changes in Delta and Gamma), the resilience against time decay (Theta), responsiveness to volatility (Vega), and adjustments for risk-free interest rates (Rho). It is vital to match the option characteristics with trading strategy, risk tolerance, and market outlook. Traders for Vertiv Holdings would thus selectively prefer long-term options with high Delta and low Theta for stable investments, or short-term, high Gamma options for speculative trades.
Similar Companies in Electrical Equipment & Parts:
nVent Electric plc (NVT), Hubbell Incorporated (HUBB), Advanced Energy Industries, Inc. (AEIS), Energizer Holdings, Inc. (ENR), EnerSys (ENS), Acuity Brands, Inc. (AYI), Kimball Electronics, Inc. (KE), Encore Wire Corporation (WIRE), ABB Ltd (ABBNY), Bloom Energy Corporation (BE), Atkore Inc. (ATKR), Eaton Corporation plc (ETN), Schneider Electric SE (SBGSY), ABB Ltd (ABB), Emerson Electric Co. (EMR), Johnson Controls International plc (JCI)
https://www.youtube.com/watch?v=O5_4j2ExnOc
https://www.fool.com/investing/2024/04/22/forget-nvidia-heres-1-other-data-center-stock-to-b/
https://www.fool.com/investing/2024/04/24/why-vertiv-stock-is-up-today/
https://www.youtube.com/watch?v=zuxGemOFlJQ
https://finance.yahoo.com/news/vertiv-holdings-co-nyse-vrt-150243245.html
https://finance.yahoo.com/news/13-best-growth-stocks-invest-215634187.html
https://finance.yahoo.com/m/506e425f-3ea5-39b3-bd86-1b3bd5d1dff2/here%27s-why-this-nvidia.html
https://www.youtube.com/watch?v=nn9xPTfuzwQ
https://finance.yahoo.com/news/vertiv-shares-climbing-due-big-195645593.html
https://finance.yahoo.com/news/decoding-vertiv-holdings-co-vrt-050155204.html
https://finance.yahoo.com/news/vertiv-participate-upcoming-conferences-120000233.html
https://finance.yahoo.com/news/vertiv-holdings-co-vrt-trending-130016543.html
https://finance.yahoo.com/news/vertiv-holdings-co-vrt-hits-131505535.html
https://www.sec.gov/Archives/edgar/data/1674101/000162828024018417/vrt-20240331.htm
Copyright © 2024 Tiny Computers (email@tinycomputers.io)
Report ID: DXPZsa
Cost: $0.90505
https://reports.tinycomputers.io/VRT/VRT-2024-04-29.html Home