Vanguard Total Stock Market Index Fund (ticker: VTI)
2024-01-19
 The Vanguard Total Stock Market Index Fund (VTI) offers investors exposure to the entire U.S. equity market, encompassing large, mid, and small-cap growth and value stocks. As an exchange-traded fund (ETF), VTI is designed to track the performance of the CRSP US Total Market Index, providing a comprehensive portfolio in a single investment. As of the knowledge cutoff date, VTI is known for its low expense ratio and high liquidity, making it an attractive option for both retail and institutional investors seeking diversified exposure to the stock market without the need to pick individual stocks. Vanguard's reputation for affordability and a strong emphasis on index investing is evident in VTI, which has become a cornerstone holding for many investors long-term portfolios. The fund's market-cap-weighted strategy means it tends to be heavily weighted towards the largest companies in the stock market, which can influence performance outcomes in periods where market leadership rotates between large and small-cap stocks.

| Previous Close | 234.59 | Open | 235.64 | Day Low | 234.62 |
| Day High | 236.955 | Trailing P/E | 22.257284 | Volume | 3,357,798 |
| Average Volume | 3,590,650 | Average Volume 10 Days | 3,577,920 | Bid | 236.76 |
| Ask | 236.75 | Bid Size | 800 | Ask Size | 800 |
| Yield | 1.44% | Total Assets | $1,458,543,788,032 | Fifty Two Week Low | 190.18 |
| Fifty Two Week High | 238.74 | Fifty Day Average | 229.5676 | Two Hundred Day Average | 218.1532 |
| Trailing Annual Dividend Rate | 2.802 | Trailing Annual Dividend Yield | 1.1944% | NAV Price | 234.68 |
| YTD Return | -1.10868% | Beta 3 Year | 1.01 | Three Year Average Return | 7.58921% |
| Five Year Average Return | 13.53596% |
 Based on the technical analysis of Vanguard Total Stock Market ETF (VTI), several key indicators can be discerned which offer insights into the potential stock price movement in the coming months. VTI reflects an aggregate performance of the total U.S. stock market, so its indicators are essentially a proxy for broad market sentiment and trends.
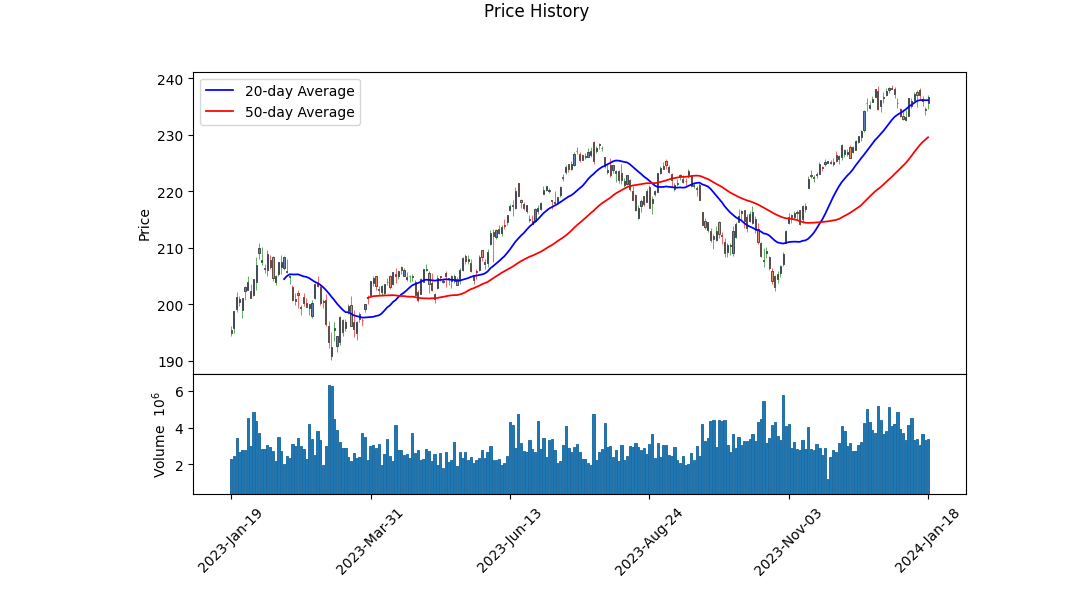
Technical Indicators Assessment: - The On-Balance Volume (OBV) has increased over the observed period, suggesting growing interest and a potential accumulation phase. - The Moving Average Convergence Divergence (MACD) histogram moved into negative territory towards the end of the period, indicating that momentum may be waning, and a bearish divergence could be forming. - The latest closing price is trending above the 50-day and 200-day moving averages, signaling an upward trend in the mid to long term. - Historical trading volumes seem stable with regular fluctuations, neither signaling overextended rallies nor selloffs.
Fundamental Analysis Observations: - The Price to Earnings (PE) ratio of 22.26 indicates the market is pricing VTI at a premium to historical average earnings. - The yield of 1.44% implies a moderate dividend income stream for investors. - The year-to-date (YTD) total return being negative at -1.11% reflects some corrective movements during the current year. - A Beta value close to 1 suggests that the ETF's volatility is closely correlated with the market.
Sentiment Based on Fundamentals: The solid net assets of VTI, which stand at approximately 1.46 trillion, reflect a strong, well-capitalized fund that commands significant market influence. Its low expense ratio of 0.03% demonstrates cost efficiency for investors, which could boost its attractiveness during uncertain market conditions. However, the slight negative yield to date hints at cautious investor sentiment prevailing in the short term.
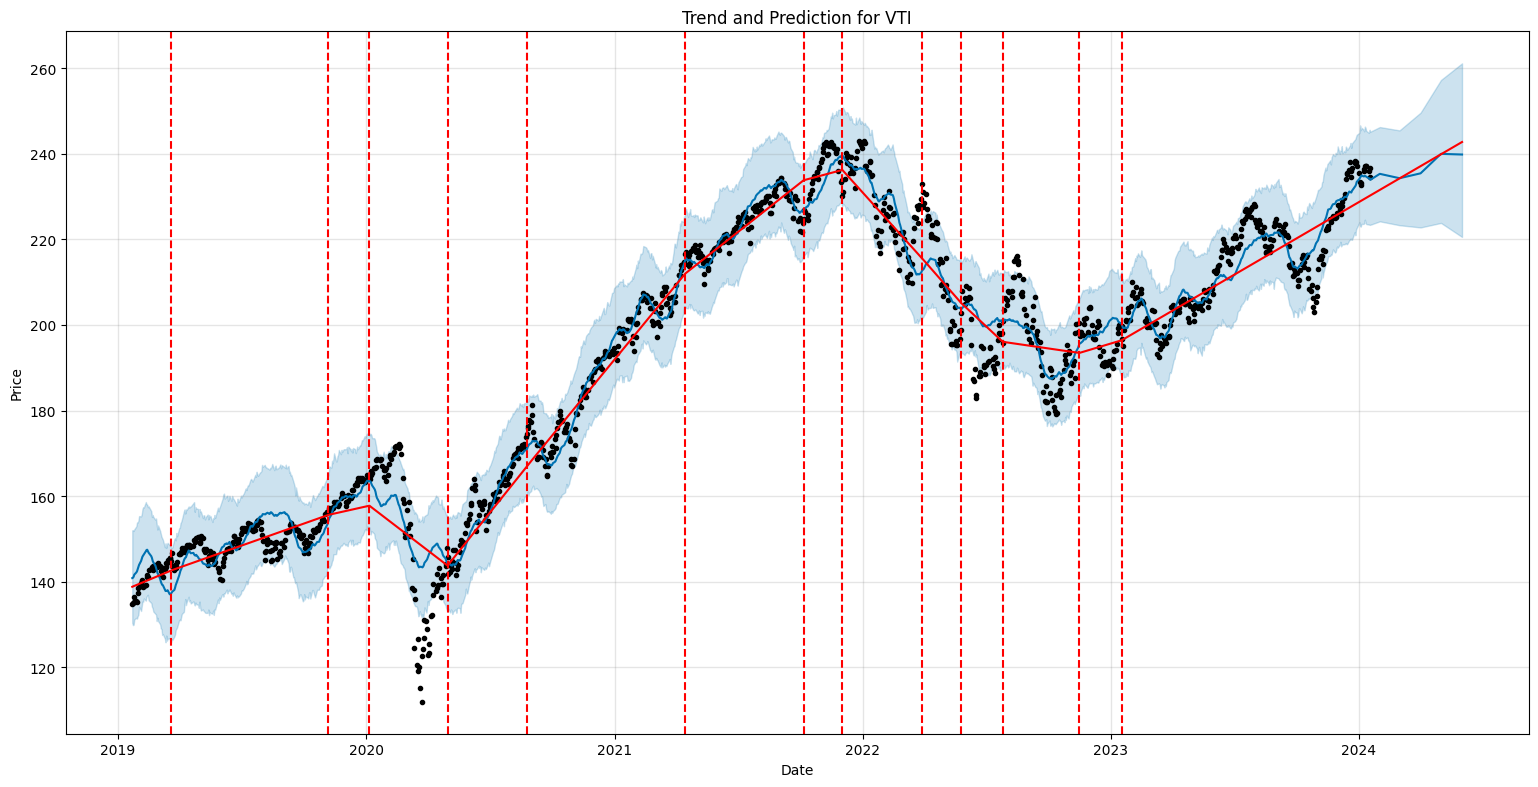
Inferred Price Movement: The combination of both technical and fundamental data points to a cautiously optimistic outlook for VTI's price movement over the next few months. The positive OBV trend suggests accumulation, while the ETF trading above its moving averages shows resilience and an uptrend that could persist in the mid-term. Yet, the negative MACD histogram and the negative YTD total return imply the potential for volatility and temporary pullbacks.
Investors should monitor the MACD for signs of a positive turnaround and the OBV for continued accumulation as confirmatory indications of ongoing bullish sentiment. Additionally, keeping an eye on broader market trends, economic indicators, and interest rate decisions, all of which can significantly influence the direction of VTI given its reflection of the total stock market, will be essential. Given the robust assets and the low expense ratio, VTI is poised to remain an attractive vehicle for broadly diversified exposure to the U.S. stock market, with a steady, albeit possibly restrained, positive trend in the upcoming months barring any unforeseen negative macroeconomic shifts.
| Statistic Name | Statistic Value |
| R-squared | 0.992 |
| Adj. R-squared | 0.992 |
| F-statistic | 154,300 |
| Prob (F-statistic) | 0.00 |
| Log-Likelihood | 864.87 |
| AIC | -1,726 |
| BIC | -1,715 |
| No. Observations | 1,256 |
| Df Residuals | 1,254 |
| coef (const) | -0.0034 |
| coef (VTI) | 1.0238 |
| std err (const) | 0.003 |
| std err (VTI) | 0.003 |
| t (const) | -1.004 |
| t (VTI) | 392.780 |
| P>|t| (const) | 0.316 |
| P>|t| (VTI) | 0.000 |
| [0.025 0.975] (const) | -0.010 0.003 |
| [0.025 0.975] (VTI) | 1.019 1.029 |
| Omnibus | 82.850 |
| Prob(Omnibus) | 0.000 |
| Skew | -0.053 |
| Kurtosis | 5.629 |
| Jarque-Bera (JB) | 362.405 |
| Prob(JB) | 2.02e-79 |
| Durbin-Watson | 2.194 |
| Cond. No. | 1.32 |
| Alpha | -0.0034488093154173838 |
| Beta | 1.023752847950378 |
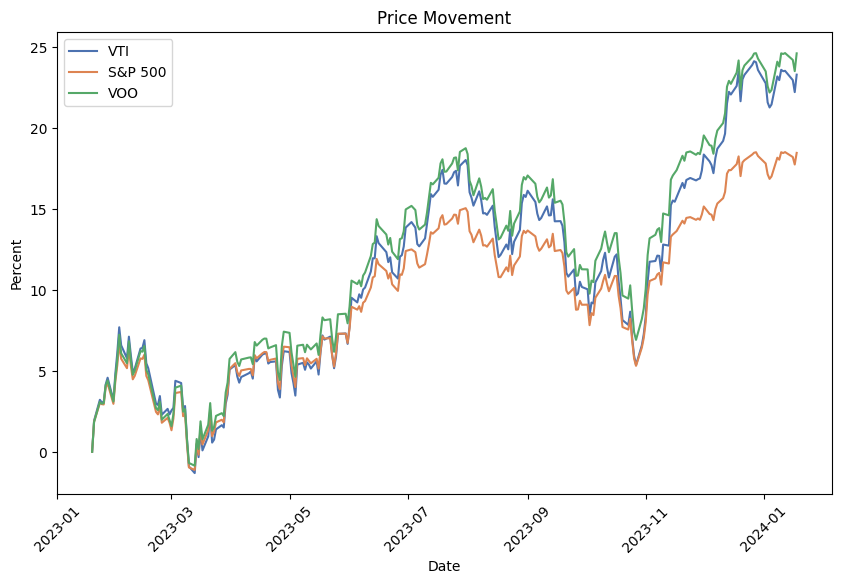
The linear regression model indicates a strong positive relationship between VTI and SPY with an R-squared value of 0.992, suggesting that 99.2% of the variability in VTI is explained by SPY. This high R-squared along with a very low p-value near 0 for the F-statistic implies the relationship is statistically significant. However, the alpha (intercept) value is -0.0034488093154173838 and is not statistically significant with a p-value of 0.316. This means that if SPY had a value of zero (hypothetically, as market indices cannot be zero), VTI would be expected to return a slightly negative performance.
The beta coefficient, which represents the sensitivity of VTI returns to SPY returns, is 1.023752847950378. This beta value is significantly different from zero (p-value of essentially 0.000), demonstrating a nearly proportional positive relationship between VTI and SPY movements; for every 1% increase in SPY, VTI is expected to increase by approximately 1.024%. With the standard error for this beta estimate being only 0.003 and given the 95% confidence interval ranges from 1.019 to 1.029, the estimation is precise. Alpha being negative, even though non-significant, indicates that VTI underperforms SPY by a very small margin on average, after adjusting for market movements.
The Vanguard Total Stock Market ETF (VTI) remains one of the most prominent exchange-traded funds in the financial landscape, offering investors comprehensive coverage of the U.S. equities market. The fund's appeal is grounded in its ability to provide access to a vast range of U.S. stocks across all market capitalizations, including large-, mid-, small-, and even micro-cap stocks. Known for its broad exposure, VTI is designed to track the performance of the CRSP US Total Market Index, which covers approximately 100% of the investable U.S. stock market. With 4,028 individual stocks in its portfolio, VTI stands as a paragon of diversification within the ETF market.
VTI's structure offers investors the simplicity of a single transaction while simultaneously achieving a level of diversification that would be cumbersome and costly to replicate with individual stock purchases. As an ETF, VTI incorporates the advantages of the burgeoning ETF market, which includes enhanced transparency, creativity in fund composition, tax efficiency, and importantly, low expense ratios that have contributed to the rapid growth of this financial sector.
Top Ten Holdings
| company | symbol | percent |
|---|---|---|
| Apple Inc | AAPL | 6.11 |
| Microsoft Corp | MSFT | 6.00 |
| Amazon.com Inc | AMZN | 3.04 |
| NVIDIA Corp | NVDA | 2.50 |
| Alphabet Inc Class A | GOOGL | 1.78 |
| Meta Platforms Inc Class A | META | 1.69 |
| Alphabet Inc Class C | GOOG | 1.47 |
| Tesla Inc | TSLA | 1.44 |
| Berkshire Hathaway Inc Class B | BRK-B | 1.37 |
| Eli Lilly and Co | LLY | 1.07 |
The fund's low expense ratio of just 0.03% is a significant draw for cost-conscious investors who are well aware that fees can eat into returns over time. The impact of low expense ratios on investment outcomes is profound, particularly when considering the long-term horizon typical of many VTI investors. This cost efficiency places VTI in a highly competitive position in the market, offering investors the blend of broad exposure and low management fees.
One of the aspects of VTI that must be noted is its liquidity. On average, nearly 3 million shares of VTI are traded every day, facilitating easy entry and exit points for investors, and contributing to the fund's stability and attractiveness as a trading vehicle. As of the date of this report, VTI managed assets to the tune of $330.4 billion, a testament to its widespread acceptance and the trust it has garnered from the investor community.
VTI's popularity extends beyond individual investors to become a staple in numerous investment strategies. For instance, the fund is frequently incorporated into the simple but effective three-fund strategy that includes a stock index fund, a bond index fund, and a money market fund. This balanced approach offers investors greater control over their investment mix, potentially lower fees, and the ability to tailor their portfolio more closely to individual circumstances. This strategy stands in contrast to the convenience but potential rigidity of target date funds that adjust asset allocation with aging.
Regarding performance, VTI has shown strong resilience and growth, approaching within 10% of its all-time high as of an article published on December 5, 2023. The ETF's broad-market exposure including thousands of stocks across various sectors offers an alternative to the S&P 500's heavier focus on large-cap stocks, extending into many mid- and small-cap companies. This extended market reach facilitates inclusion in a broad swathe of economic activities and sectors, providing what can be considered a more holistic view of the U.S. economy.
Investment strategies often highlight the importance of starting to invest early and leveraging the long-term growth trend of the market. ETFs like VTI serve as the groundwork upon which these strategies are built, affording investors both the simplicity and the historical effectiveness associated with broad market index funds. The convenience offered by modern brokerage services, including commission-free trades and access to fractional shares, only amplifies the attractiveness of VTI as an investment foundation.
Not all perspectives view VTI in a favorable short-term light, however. Some analysts caution about overenthusiastic market sentiment and potentially unsustainable equity valuations. Forecasts of a potential slowdown or recession in 2024, along with warnings about the high short-term interest rates enduring until a downturn occurs, suggest that caution may be warranted. Such analyses recommend a conservative trading stance and the diversification of one's portfolio as a hedge against stock market turbulence.
Nonetheless, VTI's robust nature, low maintenance, and diversified holdings, which cover nearly every industry thriving in the U.S., render it an attractive investment to ride the bullish wave into what many hope to be a continued market uptrend. Its considerable assets and the strong management behind it add confidence to the perspectives predicting a robust future for VTI. For those less inclined toward active portfolio management, ETFs like VTI with their broad-based and low-cost approach offer a compelling "buy-and-forget" investment choice.
In conclusion, the Vanguard Total Stock Market Index Fund presents a solid investment opportunity for those looking to achieve broad exposure to the U.S. stock market. Its low-cost structure, extensive diversification, and strong historical performance render it suitable for various investment strategies, including the foundational base for portfolios or as a complement to more specific investment themes. While there are always risks inherent to investing in equities, especially given the uncertainties of future economic conditions, VTI's sturdy design and management cater to investors seeking market participation with a long-term viewpoint.
For more information on the Vanguard Total Stock Market Index Fund and investment strategies associated with it, one may review a selection of insightful articles available on platforms such as Zacks.com, The Motley Fool, and Seeking Alpha. These resources provide a deeper dive into VTI's attributes and its role in various investment scenarios.
The Vanguard Total Stock Market Index Fund (VTI) experienced fluctuations in its performance from January 22, 2019, to January 18, 2024, as seen in the volatility modeling results. The ARCH model, used to analyze the returns and volatility of VTI, suggests that volatility clustering might be present, with larger movements in asset prices followed by more large movements (either up or down), and calm periods followed by more calm periods. Despite the attempts to model the observed behavior, the inherent unpredictability of the market means that such models can only provide an estimate, not a precise prediction, of future market behavior.
| Statistic Name | Statistic Value |
|---|---|
| R-squared | 0.000 |
| Log-Likelihood | -1996.20 |
| AIC | 3996.40 |
| BIC | 4006.67 |
| No. Observations | 1,256 |
| omega | 0.9358 |
| alpha[1] | 0.5034 |
To analyze the financial risk associated with a $10,000 investment in the Vanguard Total Stock Market Index Fund (VTI) over a one-year period, an intricate approach combining volatility modeling and machine learning predictions is adopted.
Volatility modeling plays a crucial role in assessing the fiscal health and predictability of investment funds. Specifically, for VTI, this model is used to estimate the fluctuation in the fund's stock price over time, which is an essential indicator of risk. The volatility model is capable of capturing heteroskedasticity the irregularity of variance that can occur over time in financial markets to provide a detailed forecast of risk. Such an examination uses historical prices to gauge the likely scale and frequency of price movements, setting the foundation for risk evaluation.
In parallel with volatility modeling, machine learning predictions through a technique akin to the RandomForestRegressor are employed to anticipate future returns of the fund. This machine learning model is a type of ensemble learning that utilizes numerous decision trees to generate predictions and accounts for a significant number of variables that could influence the performance of the fund. By learning from historical data and recognizing complex, non-linear patterns, the algorithm generates future return projections with a degree of confidence.
When both the outputs of volatility modeling and machine learning predictions are brought together, a more nuanced and comprehensive view of the investment's potential risk emerges. This hybrid approach can incorporate a wider array of data points and potential variables, leading to a more robust understanding of the VTI's expected performance.
Focusing on the results, particularly the Value at Risk (VaR) is paramount. VaR measures the maximum anticipated loss over a specific time frame, given a certain level of confidence. For this analysis, the calculated VaR for the $10,000 investment in VTI, at a 95% confidence level, is $130.02. This indicates that there is a 95% probability that the investment will not lose more than $130.02 over the one-year period, due to normal market fluctuations grounded in the statistical assumptions of the model.
This calculated VaR provides an investor with a tangible dollar figure that encapsulates the inherent risk of the investment, given normal market conditions. It is crucial for investors to comprehend that VaR does not account for extreme market events, which can cause losses that exceed the predicted rangea limitation inherent in any model-based risk assessment. However, within the confines of the established confidence interval and market behaviors, this fusion of volatility modeling and machine learning predictions serves as an effective toolset for gauging financial risk in equity investment.
Similar Companies in None:
Vanguard 500 Index Fund (VOO), Vanguard Total Intl Stock Idx Fund (VXUS), Vanguard Real Estate Index Fund (VNQ), Vanguard Total Bond Market Index Fund (BND), Vanguard High Dividend Yield Index Fund (VYM), BlackRock (BLK), State Street Corporation (STT), Charles Schwab Corporation (SCHW), Invesco (IVZ), Fidelity Investments (FNF), T. Rowe Price (TROW), Northern Trust (NTRS), Franklin Resources (BEN), Janus Henderson (JHG), American Century Investments (CNS)
https://www.fool.com/investing/2023/12/05/vanguard-largest-fund-closing-in-on-all-time-high/
https://www.zacks.com/stock/news/2195495/a-guide-to-the-25-cheapest-etfs
https://seekingalpha.com/article/4657673-buy-vti-to-ride-this-bull-into-2024-to-new-all-time-highs
https://www.fool.com/retirement/2023/12/14/before-you-buy-a-target-date-fund-consider-this-si/
https://www.fool.com/investing/2023/12/14/1-no-brainer-investment-you-must-make-before-2023/
https://www.fool.com/investing/2023/12/28/how-should-a-beginner-invest-in-stocks-start-with/
https://www.zacks.com/stock/news/2203053/etf-asset-report-of-q4
https://seekingalpha.com/article/4660200-avus-an-upgrade-to-vti
https://www.zacks.com/stock/news/2203538/etf-asset-report-december
https://www.etftrends.com/innovative-etfs-channel/moving-averages-sp-finishes-december-up-4-4/
https://www.fool.com/investing/2024/01/06/1-magnificent-etf-im-loading-up-on-in-2024/
https://www.fool.com/investing/2024/01/10/stocks-bonds-both-this-is-best-investment-strategy/
https://www.zacks.com/stock/news/2208104/an-etf-retirement-portfolio-for-2024
https://www.fool.com/investing/2024/01/11/new-to-stock-market-2024-vanguard-etfs/
Copyright © 2024 Tiny Computers (email@tinycomputers.io)
Report ID: aztLvNK
https://reports.tinycomputers.io/VTI/VTI-2024-01-19.html Home